41 Twin Pines Rd · Brunswick, NC
Flood risk 1/10 · Minimal
- FEMA flood zone
- X (unshaded)
- Chance of flooding over 30 yrs
- 0.0%
- Est. flood insurance / yr
- $507 – $1,088
Fire risk 4/10 · Minor
- Est. fire insurance / yr
- $906 – $1,684
Heat risk 8/10 · Major
- Hot days now (above 106°F)
- 7 days/yr
- Hot days in 30 yrs
- 17 days/yr
Wind risk 8/10 · Major
- Chance of severe wind over 30 yrs
- 80.0%
Air-quality risk 1/10 · Minimal
- Unhealthy air days now
- 0 days/yr
- Unhealthy air days in 30 yrs
- 0 days/yr
Risk factors via First Street. Map © Google.
Why this score? — see what drove the B- grade
The composite is a weighted blend of 9 inputs, each scored 0–100. Each bar is that input's sub-score; the figure is the points it added to the 100-point composite (weight × sub-score).
- Cash flow +30.0/30.0
- 1% rule +10.0/10.0
- DSCR +10.0/10.0
- ARV discount +7.5/15.0
- Schools +3.9/10.0
- Livability +2.9/5.0
- Rent growth +2.5/5.0
- Condition / age +2.5/5.0
- Appreciation +0.0/10.0
$78,700
🖨 Deal sheet 📄 Offer letter ✓ Due diligence
Listing remarks
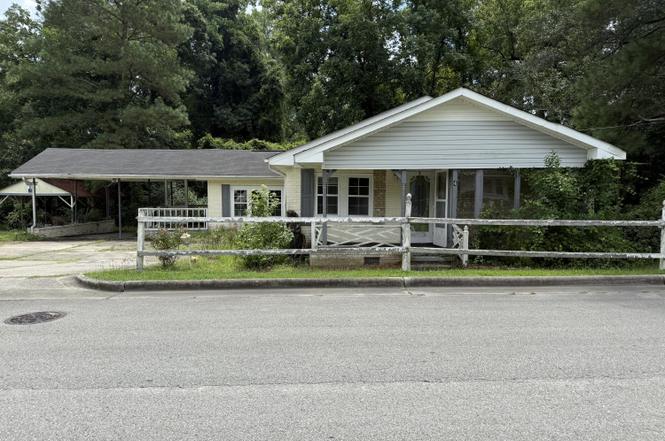
Discover the opportunity to transform this classic circa 1950 one-story home into the standout property of the neighborhood. Situated on a spacious lot with mature trees, a welcoming front porch, a carport, and an inviting footprint ready for your creative vision. The fenced front yard, screened porch, and established landscaping offer great curb appeal once refreshed. Whether you're an investor, DIY enthusiast, or buyer looking to customize your next home, this property delivers incredible value and a solid foundation to build upon. With renovations, this could become the cozy cottage or stylish modern retreat you've been imagining. This property is owned by the US DEPT OF HUD. HUD case ID
Key facts
- Carport
- Spacious lot
- Screened porch
Tags
Property features AI
Exterior
- Parking: Attached garage; Has carport (1 space); Off-street paved parking
- Utilities: Utilities: see remarks
- Home design: Single-family residence; One level
- Construction: Frame construction; Shingle roof; Foundation details: see remarks; Built in (year not provided)
- Exterior features: Porch; Partial fencing; Property has a view; City street and state road frontage; Lot dimensions approximately 82 x 112 x 81 x 107
Interior
- Bathrooms: 1 full bathroom
- Heating & cooling: Has heating (type not specified); Has cooling (type not specified)
- Interior features: No built-in kitchen appliances listed; Basement: None; Total of 4 rooms
Neighborhood map
What this means for you Summary
Snapshot
- This is a 2-bed/2.0-bath single-family listed at $79k.
Deal economics
- At list price, monthly cash flow is $832 ($10k/yr) — positive.
- The deal already cash-flows at list — no discount required.
- Meets the 1% rule at list price ($2k rent vs $79k).
- Recommended offer: $69k (12.0% below list) — sets the bar for market timing.
Location & tenants
- Location reads 57/100 on livability (#611 in NC) — a working-class tenant base; expect higher turnover. Strengths: cost of living A+, crime A-; Watch: health & safety C-, housing D+, amenities F.
- Whiteville City Schools (town): math 49% / reading 46% proficiency, ranked #81 of 178 in NC (top 46%) — families likely to look elsewhere, expect single-tenant / working-renter base with shorter leases; 74% free/reduced lunch — lower-income household profile, screen leases tightly.
- Zoned schools: Edgewood Elementary (math 49% / reading 43%, grade D-, #551 of 1,410 statewide, top 40%, 454 students, 99% FRL); Central Middle (math 46% / reading 45%, grade D+, #154 of 475 statewide, top 33%, 462 students, 99% FRL); Whiteville High (math 57% / reading 57%, grade C, #248 of 535 statewide, top 48%, 662 students, 99% FRL) — zoned schools average 99% FRL vs 74% district-wide (25 pts higher); higher-poverty schools than district average — tighter screening recommended.
- Market conditions: 115 active listings in the ZIP; 1 comparable units currently listed for rent nearby; 24 units permitted in Columbus County in 2024 (0 in 5+ unit buildings).
Forward outlook
- Local home prices are declining (-3.0%/yr); year-one equity from $544 of loan paydown is wiped out by about $2k of value loss. Plan a longer hold.
- Columbus County population projected at -19% by 2050 — secular population decline; favor cash flow + early exit over multi-decade hold.
- At projected returns (-3.0% appreciation + 3.0% rent growth), your $22k cash investment doubles in ~3 years — after that, you're playing with house money.
Negotiation context
- It's been on market 175 days — a 12% lower offer ($69k) is reasonable based on typical stale-listing flexibility.
- 3 sale attempts since 18y ago; this cycle's ask has dropped $29k (27%) from the opening price — seller is motivated, your offer sets the floor, not the list.
Risks & watch-outs
- Watch-outs: built in 1950 — expect roof / HVAC / electrical / plumbing capex.
- Climate carrying-cost: severe wind risk, 80% chance of damaging wind over 30y; extreme-heat days projected 7→17/yr by 2055 (HVAC capex compounding) — expect insurance premiums to compound above CPI over the hold.
Questions for the listing agent
- It's been on market 175 days. Have you received any prior offers? Is the seller open to a 12% concession, seller financing, or rate buy-down credit?
- Built in 1950 — when were the roof, HVAC, electrical panel, plumbing, and water heater last replaced?
- Why hasn't it sold? Are there any deal-killer items the seller is aware of (foundation, flood, title, zoning, code violations)?
- Is there a deadline driving the sale (1031 exchange, divorce, estate, relocation)? That informs how much negotiation room exists.
- Schools are F-rated, which usually means shorter tenancies and higher turnover. Who's the typical renter profile here, and what's been the actual vacancy rate?
- What's the average days-on-market for RENTAL listings here right now (not sales)? A rising rental-DOM trend means longer vacancies and softer asking-rent achievability than the comps imply.
- What's the recent tenant-quality profile in this submarket — average credit score on applications, eviction rate, late-payment / NSF rate, and stable-employment percentage? A property-management company in the area should have these aggregated.
- How much new for-sale + rental construction is in the pipeline within 1–3 miles? Heavy new supply typically softens prices + rents 12–24 months out; constrained supply supports both.
Investment metrics
- 1% rule
- 2.16% ✓
- Cap rate
- 18.98%
- Cash-on-cash
- 45.31%
- DSCR
- 3.02
- GRM
- 3.9
CMA / ARV
- ARV (on-the-fly)
- $29,505
- Comps found
- 1
Show comp detail 1 sale within ~0.75 mi
| Address | Dist | Beds/Ba | Sqft | Sold | Price | $/sf | Match |
|---|---|---|---|---|---|---|---|
| 599 Bitmore Rd | 0.19mi | 2/1.0 | 1,285 (-8%) | 19mo | $27,000 | $21 | 57 |
Match score weights: distance 35% · size 25% · config 20% · recency 20%. Top-matched comps best support the ARV.
Projected returns pro-forma
-3.0% appreciation · 3.0% rent growth · sell at horizon
- IRR
- 42.4%
- Equity multiple
- 2.83×
- Total profit
- $40,251
- Equity at exit
- $11,734
- IRR
- 48.5%
- Equity multiple
- 5.69×
- Total profit
- $103,315
- Equity at exit
- $6,805
Cash invested: $22,036 (down + closing). Projections, not guarantees.
Landlord ↔ Tenant lean methodology
- Overall (STATE)
- 85 Strongly Landlord-Friendly
- State North Carolina
- 85 Strongly Landlord-Friendly · R+3
- County
- — inherits STATE
- City
- — inherits STATE
ZIP-level market 28472
- Home prices YoY
- -5.2%
- Active inventory
- 115
- Price-to-rent
- 3.9×
Monthly cashflow live
- Estimated rent
- $1,700 medium interval (Pro) →
- Mortgage (P&I)
- −$413
- Tax from tax record
- −$65 /mo · $784/yr
- Insurance
- −$33
- HOA
- −$0
- Vacancy / Maint / Mgmt
- −$357
- Net cashflow
- $832
Break-even live
UW: 25.0% down · 7.5% · 30yr · 1.5% tax · 5.0% vac · 8.0% maint · 8.0% mgmt
Financing live
Cash to close
- Down payment
- $19,675
- Closing costs
- $2,361
- Reserves months
- —
- Total cash needed
- —
Loan-product check · same deal, 3 products live
Conventional
25% down · 7.5% · 30yr
- Down + closing
- —
- Monthly P&I
- —
- Monthly cashflow
- —
- DSCR
- —
- Eligible?
- —
Personal DTI + credit; lowest rate.
DSCR
20% down · 8.5% · 30yr
- Down + closing
- —
- Monthly P&I
- —
- Monthly cashflow
- —
- DSCR
- —
- Eligible?
- —
No personal income docs; deal must DSCR.
Hard money
10% down · 12.0% · 12mo
- Down + closing
- —
- Monthly P&I
- —
- Monthly cashflow
- —
- DSCR
- —
- Eligible?
- —
Short-term bridge; refi at stabilization.
Rent comps 1 comps
| Address | Beds | Baths | Sqft | Rent | $/sqft | DOM | Units | Dist |
|---|---|---|---|---|---|---|---|---|
| 53 Crew CT Whiteville, NC | 3.0 | 3.0 | 1383 | $1,700 | $1.23 | 23d | 1 | 1.12mi |
Listing history 12 events
-
2026-06-01status $78,700 Pending 175 DOM
-
2026-06-01days on market $78,700 Active 175 DOM
-
2026-05-31days on market $78,700 Active 174 DOM
-
2026-04-07status Active
-
2026-04-02historical
-
2026-03-22price $78,700
-
2026-02-18price $87,480
-
2026-01-22price $97,200
-
2025-12-02$108,000 Active
-
2025-01-21soldstatus $112,300
-
2009-06-05historical
-
2008-06-05$10,750
ⓘ Source: listings_history table (triggers on properties + properties_extension) + one-shot
backfill from property_details.listing_events for pre-trigger history.
Tax reassessment forecast NC · Resets to sale price
- Current annual tax
- $784 · $65/mo
- Projected year-2 tax
- $784 · $65/mo
- Expected delta
- $0/yr ($0/mo · -0.0%)
ⓘ Screening estimate from a state-policy table — verify with the county assessor before closing.
Climate risk First Street
- Flood 1/10 Low FEMA zone X (unshaded) · 0% chance over 30 yrs
- Wildfire 4/10 Moderate
- Heat 8/10 Severe 7 d/yr ≥106°F today · 17 d/yr by 30 yrs out
- Wind 8/10 Severe 80% chance of damaging wind over 30 yrs
- Air quality 1/10 Low 0 unhealthy d/yr today · 0 by 30 yrs out
Nearby sold comps map
Loading sold comps map…
Walkable amenities ~0.75 mi
Loading nearby amenities…
Taxation est. · year 1
- Rental income
- $20,400
- − Mortgage interest
- −$4,408
- − Property taxes
- −$784
- − Insurance
- −$394
- − Repairs & maintenance
- −$1,632
- − Management
- −$1,632
- − Depreciation
- −$2,289
- Taxable income
- $9,260
- Est. tax owed @ 24.0%
- −$2,222
- After-tax cash flow
- $7,763/yr
For passive investors: Depreciation is non-cash, so a rental often shows a tax loss while cash-flowing — sheltering income. Rental losses are passive: they offset passive income freely, and up to $25,000/yr can offset ordinary (W-2) income if you actively participate and your MAGI is under $100k (phasing out to $0 by $150k); unused losses carry forward. On sale, claimed depreciation is recaptured at up to 25%, and gains may owe capital-gains tax (a 1031 exchange can defer both). Figures are a year-1 estimate at your 24.0% rate — not tax advice; consult a CPA.
Schools (NCES district)
- District
- Whiteville City Schools
- NCES district ID
- 3704920
- Math proficiency
- 49% ▲ 7.00%
- Reading proficiency
- 46% ▬ 0.00%
- Median HH income
- $34,751
- Composite
- 39.27/100
- National rank
- #3999
- State rank
- #81 of 178 in NC
Livability — Brunswick
- Score
- 57/100
- State rank
- #611
- US rank
- #22196
Category grades
Schools grade is shown separately in the Schools card above.
Census & demographics
- Census place
- Brunswick, NC
- Population (ZIP)
- 17,833
Population outlook (Columbus County) Hauer SSP2
- Today (2025)
- 54,250 people
- By 2030
- 52,378 · -3.5%
- By 2040
- 48,226 · -11.1%
- By 2050
- 44,103 · -18.7%
- By 2075
- 35,271 · -35.0%
- By 2100
- 26,909 · -50.4%
Race, ethnicity, and origin ACS 2023
- Neighborhood character
- Diverse neighborhood (Simpson 0.55)
- Race & ethnicity
- White 59% Black 32% Hispanic / Latino 4% Two or more races 3% Native American 2%
- Common ancestry
- Serbian 1% Slovak 1% Romanian 1%
- Foreign-born
- 3% · Canada
- Languages at home
- 94% English-only · Spanish 5%
Political lean MEDSL · Columbus
- 2024 margin
- Solid R (+33.9) · D 32.8% · R 66.7%
- 2008→2024 swing
- -26.0pp toward R · 2008: -7.9pp · 2024: -33.9pp
- All cycles
- 2024: R+33.9 2020: R+27.9 2016: R+22.1 2012: R+7.9 2008: R+7.9
Not yet ingested
- Civics
- —
Market trends
- HPI YoY
- ▼ -13.72%
- Current HPI
- 252.022
- Rent YoY
- —
- Metro
- —
- State GDP YoY
- ▲ 3.28%
- F500 in state
- 26
Industry mix (Fortune 500 HQ in NC)
| Industry | F500 HQs | Revenue |
|---|---|---|
| Financial Services | 2 | $213B |
|
||
| Retail | 2 | $95B |
|
||
| Industrial Conglomerate | 1 | $38B |
|
||
| Metals / Steel | 1 | $35B |
|
||
| Utilities | 1 | $30B |
|
||
| Industrial Machinery | 1 | $19B |
|
||
Price history
+632.1% since first listed9 events — show timeline
- 2026-04-07 Relisted — Hive MLS
- 2026-04-02 Listing Removed — Hive MLS
- 2026-03-22 Price Changed $78,700 Hive MLS
- 2026-02-18 Price Changed $87,480 Hive MLS
- 2026-01-22 Price Changed $97,200 Hive MLS
- 2025-12-02 Listed $108,000 Hive MLS
- 2025-01-21 Sold (Public Records) $112,300 Public Records
- 2009-06-05 Listing Removed — Hive MLS
- 2008-06-05 Listed $10,750 Hive MLS
Property tax history
+9.4%/yrLatest (2025): $784 · +36.7% YoY. Source: county tax records.
Cash-flow waterfall
monthlySold comps — $/sqft
last 12 mo · ≤1 miLoading sold comps…