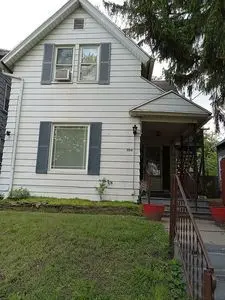
 Duplex
1156 Gordon St · Toledo, OH
Flood risk 1/10 · Minimal
- FEMA flood zone
- X (unshaded)
- Chance of flooding over 30 yrs
- 0.0%
- Est. flood insurance / yr
- $507 – $1,088
Fire risk 1/10 · Minimal
- Est. fire insurance / yr
- $713 – $1,323
Heat risk 3/10 · Minor
- Hot days now (above 101°F)
- 7 days/yr
- Hot days in 30 yrs
- 16 days/yr
Wind risk 2/10 · Minimal
- Chance of severe wind over 30 yrs
- —
Air-quality risk 2/10 · Minimal
- Unhealthy air days now
- 1 days/yr
- Unhealthy air days in 30 yrs
- 2 days/yr
Risk factors via First Street. Map © Google.
Why this score? — see what drove the B grade
The composite is a weighted blend of 9 inputs, each scored 0–100. Each bar is that input's sub-score; the figure is the points it added to the 100-point composite (weight × sub-score).
- Cash flow +30.0/30.0
- 1% rule +10.0/10.0
- DSCR +10.0/10.0
- ARV discount +7.5/15.0
- Appreciation +5.4/10.0
- Rent growth +4.5/5.0
- Livability +3.3/5.0
- Condition / age +2.5/5.0
- Schools +1.6/10.0
$89,500
🖨 Deal sheet 📄 Offer letter ✓ Due diligence
Multi-family units
County records classify this as Multi-Family (2-4 Unit). Listing-text estimate: 2 units. confirmed
Listing remarks
This home is registered with The National Historic Society---has been recently remodeled with a 1/2 bath--- also updated with home performance improvements including insulation, heating & amp; weatherization in 2019--an extra lot also has been added for additional yard footage--- privacy fence also added in 2025--lot includes a 2 car detached garage with loft--- property has a partially furnished duplex apartment for additional income with an outside entrance --- inside entrance has an operable stair-lift
Key facts
- Extra lot
- Recently remodeled
- Privacy fence
Tags
Property features AI
Exterior
- Home design: Built in 1887
- Construction: Living area approximately 1790; Historic 1887 construction
- Exterior features: Located in the Southside subdivision
Neighborhood map
What this means for you Summary
Snapshot
- This is a 2 × 3-bed/2.5-bath units multifamily listed at $90k.
Deal economics
- At list price, monthly cash flow is $1k ($12k/yr) — positive. Per door: $501/mo.
- The deal already cash-flows at list — no discount required.
- Meets the 1% rule at list price ($2k rent vs $90k).
- Recommended offer: $87k (3.0% below list) — sets the bar for market timing.
- Cap rate 19.7% vs local median 7.6% in Toledo — top-decile yield for the area; either an underpriced asset or a hidden risk that comps aren't pricing in. Stress-test before assuming the spread holds.
Location & tenants
- Location reads 66/100 on livability (#645 in OH) — a middle-class / working-renter tenant base. Strengths: cost of living A+, housing A+, health & safety A+; Watch: amenities C-, schools D-, crime F.
- Toledo City (urban): math 15% / reading 24% proficiency, ranked #634 of 656 in OH (top 97%) — low school quality limits family demand, transient renter base, plan for 1-2y turnover; 72% free/reduced lunch — lower-income household profile, screen leases tightly.
- Market conditions: Rents rising fast (+7.8%/yr); 99 active listings in the ZIP; 9 comparable units currently listed for rent nearby; rentals at typical pace (median 23d on market — plan ~3-4 weeks tenant-placement turnaround); 44% of comp listings sitting > 30 days — soft ceiling on asking rent; lower-income renter base — watch delinquency; 415 units permitted in Lucas County in 2024 (122 in 5+ unit buildings).
- At $2,005/mo this rent would consume 57% of the median local household income ($42k/yr) (locally 1603% of renters already pay >50% of income on rent) — very limited rent-growth headroom before tenants either downsize or default.
Forward outlook
- In year one you build about $1k of equity ($619 loan paydown + $671 appreciation (0.8% local appreciation)).
- Lucas County population projected at -16% by 2050 — secular population decline; favor cash flow + early exit over multi-decade hold.
- At projected returns (0.8% appreciation + 7.8% rent growth), your $25k cash investment doubles in ~2 years — after that, you're playing with house money.
Negotiation context
- It's been on market 37 days — a 3% lower offer ($87k) is reasonable based on typical stale-listing flexibility.
Risks & watch-outs
- Watch-outs: built in 1887 — expect roof / HVAC / electrical / plumbing capex.
Questions for the listing agent
- It's been on market 37 days. Have you received any prior offers? Is the seller open to a 3% concession, seller financing, or rate buy-down credit?
- Can we see the unit-by-unit rent roll, current vacancy, and any below-market leases? What's the average tenancy length?
- What capital expenditures (roof, boiler, parking lot, exteriors) have been made in the last 5 years, and what's planned in the next 2?
- Built in 1887 — when were the roof, HVAC, electrical panel, plumbing, and water heater last replaced?
- Is there a deadline driving the sale (1031 exchange, divorce, estate, relocation)? That informs how much negotiation room exists.
- Schools are D-rated, which usually means shorter tenancies and higher turnover. Who's the typical renter profile here, and what's been the actual vacancy rate?
- Crime grade is F in this area — have there been break-ins, vandalism, or insurance claims at this property in the last 3 years? What carrier currently insures it and at what premium?
- What's the average days-on-market for RENTAL listings here right now (not sales)? A rising rental-DOM trend means longer vacancies and softer asking-rent achievability than the comps imply.
- What's the recent tenant-quality profile in this submarket — average credit score on applications, eviction rate, late-payment / NSF rate, and stable-employment percentage? A property-management company in the area should have these aggregated.
- How much new apartment / multifamily construction is in the pipeline within 1–3 miles? Heavy new supply (>2% of stock underway) typically softens rents 12–24 months out; light construction supports rent growth.
Investment metrics
- 1% rule
- 2.24% ✓
- Cap rate
- 19.72%
- Cash-on-cash
- 47.96%
- DSCR
- 3.13
- GRM
- 3.7
CMA / ARV
- ARV (on-the-fly)
- $28,640
- Comps found
- 3
Show comp detail 3 sales within ~0.75 mi
| Address | Dist | Beds/Ba | Sqft | Sold | Price | $/sf | Match |
|---|---|---|---|---|---|---|---|
| 1266 Western Ave | 0.17mi | 3/2.0 | 1,667 (-7%) | 5mo | $26,150 | $16 | 72 |
| 825 Colburn St | 0.60mi | 4/2.0 (+1) | 1,999 (+12%) | 4mo | $50,000 | $25 | 40 |
| 225 Wasaon St | 0.68mi | 4/2.0 (+1) | 2,024 (+13%) | 1mo | $18,700 | $9 | 36 |
Match score weights: distance 35% · size 25% · config 20% · recency 20%. Top-matched comps best support the ARV.
Projected returns pro-forma
0.75% appreciation · 7.8% rent growth · sell at horizon
- IRR
- 54.9%
- Equity multiple
- 3.97×
- Total profit
- $74,533
- Equity at exit
- $29,392
- IRR
- 58.6%
- Equity multiple
- 9.32×
- Total profit
- $208,565
- Equity at exit
- $38,177
Cash invested: $25,060 (down + closing). Projections, not guarantees.
Landlord ↔ Tenant lean methodology
- Overall (STATE)
- 73 Landlord-Friendly
- State Ohio
- 73 Landlord-Friendly · R+6
- County
- — inherits STATE
- City
- — inherits STATE
ZIP-level market 43609
- Home prices YoY
- 0.3%
- Rents YoY
- 7.8%
- Active inventory
- 99
- Price-to-rent
- 7.4×
Monthly cashflow live
- Estimated rent
- $2,005 high interval (Pro) →
- Mortgage (P&I)
- −$469
- Tax from tax record
- −$76 /mo · $909/yr
- Insurance
- −$37
- HOA
- −$0
- Vacancy / Maint / Mgmt
- −$421
- Net cashflow
- $1,002
Break-even live
2-unit breakdown (identical units grouped — click to expand)
| Units | Beds | Baths | Est. rent |
|---|---|---|---|
| 2× units | 3 | 2.5 | $2,004 |
| #1 | 3 | 2.5 | $1,002 |
| #2 | 3 | 2.5 | $1,002 |
| Total (2 units) | $2,005 | ||
UW: 25.0% down · 7.5% · 30yr · 1.5% tax · 5.0% vac · 8.0% maint · 8.0% mgmt
Financing live
Cash to close
- Down payment
- $22,375
- Closing costs
- $2,685
- Reserves months
- —
- Total cash needed
- —
Loan-product check · same deal, 3 products live
Conventional
25% down · 7.5% · 30yr
- Down + closing
- —
- Monthly P&I
- —
- Monthly cashflow
- —
- DSCR
- —
- Eligible?
- —
Personal DTI + credit; lowest rate.
DSCR
20% down · 8.5% · 30yr
- Down + closing
- —
- Monthly P&I
- —
- Monthly cashflow
- —
- DSCR
- —
- Eligible?
- —
No personal income docs; deal must DSCR.
Hard money
10% down · 12.0% · 12mo
- Down + closing
- —
- Monthly P&I
- —
- Monthly cashflow
- —
- DSCR
- —
- Eligible?
- —
Short-term bridge; refi at stabilization.
Rent comps 9 comps
| Address | Beds | Baths | Sqft | Rent | $/sqft | DOM | Units | Dist |
|---|---|---|---|---|---|---|---|---|
| 1021 Walbridge Ave Toledo, OH | 3.0 | 1.0 | 1592 | $975 | $0.61 | 43d | 1 | 0.20mi |
| 523 Nicholas St Toledo, OH | 3.0 | 1.0 | 1290 | $1,350 | $1.05 | 13d | 1 | 0.59mi |
| 2424 Broadway St Toledo, OH | 3.0 | 1.0 | 1416 | $1,049 | $0.74 | 13d | 1 | 0.77mi |
| 825 Brighton Ave Toledo, OH | 3.0 | 1.0 | 1533 | $1,350 | $0.88 | 43d | 1 | 0.88mi |
| 319 N Detroit Ave Toledo, OH | 3.0 | 1.0 | 1341 | $845 | $0.63 | 43d | 1 | 1.02mi |
| 1122 Pinewood Ave Toledo, OH | 3.0 | 1.0 | 1559 | $1,150 | $0.74 | 13d | 1 | 1.20mi |
| 1140 Palmwood Ave Toledo, OH | 3.0 | 1.0 | 1292 | $1,500 | $1.16 | 43d | 1 | 1.38mi |
| 2802 Broadway St Unit 1 Toledo, OH | 3.0 | 1.0 | 1650 | $1,400 | $0.85 | 13d | 1 | 1.44mi |
| 337 Broadway St Unit 201 Toledo, OH | 2.0 | 1.0 | 1455 | $1,650 | $1.13 | 23d | 1 | 1.45mi |
Listing history 17 events
-
2026-06-18days on market $89,500 Active 37 DOM
-
2026-06-17days on market $89,500 Active 36 DOM
-
2026-06-16days on market $89,500 Active 35 DOM
-
2026-06-15days on market $89,500 Active 34 DOM
-
2026-06-14days on market $89,500 Active 32 DOM
-
2026-06-10days on market $89,500 Active 29 DOM
-
2026-06-09days on market $89,500 Active 28 DOM
-
2026-06-08days on market $89,500 Active 27 DOM
-
2026-06-07days on market $89,500 Active 26 DOM
-
2026-06-05days on market $89,500 Active 23 DOM
-
2026-06-03days on market $89,500 Active 22 DOM
-
2026-06-02days on market $89,500 Active 21 DOM
-
2026-06-01days on market $89,500 Active 20 DOM
-
2026-05-31days on market $89,500 Active 19 DOM
-
2026-05-30days on market $89,500 Active 18 DOM
-
2026-05-13price $89,500 511-char remark
-
2026-05-12$149,000 Active 511-char remark
ⓘ Source: listings_history table (triggers on properties + properties_extension) + one-shot
backfill from property_details.listing_events for pre-trigger history.
Tax reassessment forecast OH · Partial reset (capped growth)
- Current annual tax
- $909 · $76/mo
- Projected year-2 tax
- $1,152 · $96/mo
- Expected delta
- +$244/yr (+$20/mo · 26.8%)
ⓘ Screening estimate from a state-policy table — verify with the county assessor before closing.
Climate risk First Street
- Flood 1/10 Low FEMA zone X (unshaded) · 0% chance over 30 yrs
- Wildfire 1/10 Low
- Heat 3/10 Moderate 7 d/yr ≥101°F today · 16 d/yr by 30 yrs out
- Wind 2/10 Low
- Air quality 2/10 Low 1 unhealthy d/yr today · 2 by 30 yrs out
Nearby sold comps map
Loading sold comps map…
Walkable amenities ~0.75 mi
Loading nearby amenities…
Taxation est. · year 1
- Rental income
- $24,060
- − Mortgage interest
- −$5,013
- − Property taxes
- −$909
- − Insurance
- −$448
- − Repairs & maintenance
- −$1,925
- − Management
- −$1,925
- − Depreciation
- −$2,604
- Taxable income
- $11,237
- Est. tax owed @ 24.0%
- −$2,697
- After-tax cash flow
- $9,322/yr
For passive investors: Depreciation is non-cash, so a rental often shows a tax loss while cash-flowing — sheltering income. Rental losses are passive: they offset passive income freely, and up to $25,000/yr can offset ordinary (W-2) income if you actively participate and your MAGI is under $100k (phasing out to $0 by $150k); unused losses carry forward. On sale, claimed depreciation is recaptured at up to 25%, and gains may owe capital-gains tax (a 1031 exchange can defer both). Figures are a year-1 estimate at your 24.0% rate — not tax advice; consult a CPA.
Schools (NCES district)
- District
- Toledo City
- NCES district ID
- 3904490
- Math proficiency
- 15% ▼ -16.00%
- Reading proficiency
- 24% ▼ -13.00%
- Median HH income
- $32,137
- Composite
- 15.76/100
- National rank
- #9276
- State rank
- #634 of 656 in OH
Livability — Toledo
- Score
- 66/100
- State rank
- #645
- US rank
- #11442
Category grades
Schools grade is shown separately in the Schools card above.
Census & demographics
- Census place
- Toledo, OH
- County
- Lucas County · 380,724 people
- City population
- 280,811
- Metro
- Toledo, OH
- Population (ZIP)
- 21,404
- Household income
- $42,313
- Rent vs Own
- Severe rent burden
- 1603.0
Population outlook (Lucas County) Hauer SSP2
- Today (2025)
- 420,751 people
- By 2030
- 410,187 · -2.5%
- By 2040
- 384,019 · -8.7%
- By 2050
- 355,125 · -15.6%
- By 2075
- 291,683 · -30.7%
- By 2100
- 233,670 · -44.5%
Race, ethnicity, and origin ACS 2023
- Neighborhood character
- Diverse neighborhood (Simpson 0.66)
- Race & ethnicity
- White 47% Black 29% Hispanic / Latino 17% Two or more races 9%
- Hispanic origin (detail)
- Mexican 15%
- Common ancestry
- Romanian 5% Lithuanian 2% Italian 1%
- Foreign-born
- 4% · Canada, China
- Languages at home
- 92% English-only · Spanish 5% Arabic 1% French/Haitian/Cajun 1%
Political lean MEDSL · Lucas
- 2024 margin
- D (+12.6) · D 55.8% · R 43.2%
- 2008→2024 swing
- -18.9pp toward R · 2008: 31.4pp · 2024: 12.6pp
- All cycles
- 2024: D+12.6 2020: D+16.8 2016: D+17.4 2012: D+30.4 2008: D+31.4
Not yet ingested
- Civics
- —
Market trends
- HPI YoY
- ▲ 0.75%
- Current HPI
- 235.2515
- Rent YoY
- ▲ 7.80%
- Metro
- Toledo, OH
- State GDP YoY
- ▲ 1.98%
- F500 in state
- 48
Industry mix (Fortune 500 HQ in OH)
| Industry | F500 HQs | Revenue |
|---|---|---|
| Insurance | 3 | $145B |
|
||
| Industrial Machinery | 3 | $49B |
|
||
| Financial Services | 3 | $24B |
|
||
| Consumer Goods | 2 | $93B |
|
||
| Aerospace / Defense | 2 | $47B |
|
||
| Utilities | 2 | $33B |
|
||
Price history
-39.9% since first listed2 events — show timeline
- 2026-05-13 Price Changed $89,500 FSBO.com
- 2026-05-12 Listed $149,000 FSBO.com
Property tax history
+9.3%/yrLatest (2025): $909 · +15.9% YoY. Source: county tax records.
Cash-flow waterfall
monthlySold comps — $/sqft
last 12 mo · ≤1 miLoading sold comps…