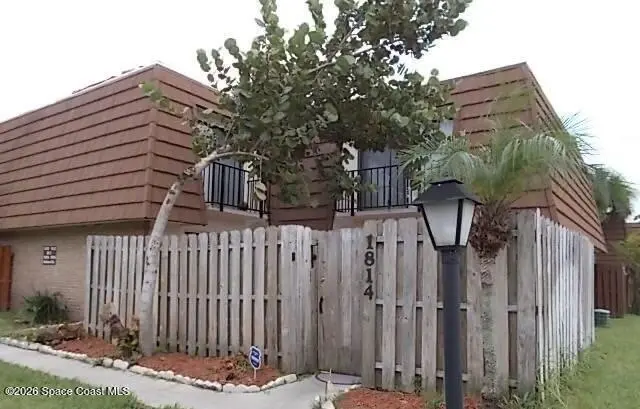
1814 Kaileen Cir NE · Palm Bay, FL
Flood risk 1/10 · Minimal
- FEMA flood zone
- X (unshaded)
- Chance of flooding over 30 yrs
- 0.0%
- Est. flood insurance / yr
- $507 – $1,088
Fire risk 1/10 · Minimal
- Est. fire insurance / yr
- $947 – $1,759
Heat risk 10/10 · Severe
- Hot days now (above 105°F)
- 7 days/yr
- Hot days in 30 yrs
- 22 days/yr
Wind risk 10/10 · Severe
- Chance of severe wind over 30 yrs
- 99.0%
Air-quality risk 1/10 · Minimal
- Unhealthy air days now
- 0 days/yr
- Unhealthy air days in 30 yrs
- 0 days/yr
Risk factors via First Street. Map © Google.
Why this score? — see what drove the C- grade
The composite is a weighted blend of 9 inputs, each scored 0–100. Each bar is that input's sub-score; the figure is the points it added to the 100-point composite (weight × sub-score).
- Cash flow +14.6/30.0
- 1% rule +8.3/10.0
- ARV discount +7.5/15.0
- Schools +4.7/10.0
- DSCR +4.5/10.0
- Livability +3.6/5.0
- Condition / age +2.5/5.0
- Rent growth +2.4/5.0
- Appreciation +2.2/10.0
$130,000
🖨 Deal sheet (PDF) 📄 Offer letter ✓ Due diligence
Listing remarks
Welcome to this charming 2-bedroom, 1.5-bath townhome in desirable Vista Oaks West! This home features an open-concept kitchen, dining, and family room layout, creating a spacious and inviting atmosphere perfect for everyday living and entertaining. Sliding glass doors lead to your own private fenced patio, ideal for relaxing outdoors or enjoying morning coffee. Additional features include in-unit washer and dryer hook-ups, convenient under-stair storage, tile and vinyl flooring throughout for easy maintenance, and two assigned parking spaces. The HOA fee includes water, sewer, trash, cable, and internet, offering added value and convenience. Conveniently located near shopping, dining, scho
Key facts
- $435 HOA
- 2 parking spots
- Built 1980
Neighborhood map
What this means for you Summary
Snapshot
- This is a 3-bed/2.0-bath townhouse listed at $130k.
Deal economics
- At list price, monthly cash flow is $32 ($380/yr) — positive.
- The deal already cash-flows at list — no discount required.
- Meets the 1% rule at list price ($2k rent vs $130k).
Location & tenants
- Location reads 72/100 on livability (#366 in FL) — a middle-class / working-renter tenant base. Strengths: cost of living A+, housing A+; Watch: employment D+, amenities F, health & safety D-.
- Brevard (suburban): math 53% / reading 57% proficiency, ranked #19 of 73 in FL (top 26%) — acceptable for families but not a draw, mixed tenant base, ~2y average lease.
- Zoned schools: University Park Elementary School (math 22% / reading 32%, grade F, #1,969 of 2,144 statewide, top 94%, 484 students, 76% FRL); Stone Magnet Middle School (math 33% / reading 35%, grade F, #426 of 571 statewide, top 75%, 670 students, 69% FRL); Palm Bay Magnet Senior High School (math 25% / reading 37%, grade F, #429 of 667 statewide, top 65%, 1,486 students, 63% FRL) — zoned schools average 69% FRL vs 43% district-wide (26 pts higher); higher-poverty schools than district average — tighter screening recommended.
- Zoned-school proficiency averages 31% at this address vs 55% district-wide (-24 pts) — the specific schools serving this property underperform the Brevard average; the district grade overstates school quality for this exact location.
- Market conditions: Rents soft (-0.5%/yr); 324 active listings in the ZIP; 40 comparable units currently listed for rent nearby; rentals at typical pace (median 23d on market — plan ~3-4 weeks tenant-placement turnaround); 4,602 units permitted in Brevard County in 2024 (702 in 5+ unit buildings).
- This rent runs 37% of the median local income ($56k/yr) — at the standard rent-burdened threshold; future hikes will face affordability resistance.
Forward outlook
- Local home prices are declining (-3.0%/yr); year-one equity from $899 of loan paydown is wiped out by about $4k of value loss. Plan a longer hold.
- Brevard County population projected at +15% by 2050 — modest demand growth; plan on rents tracking national, not racing it.
Negotiation context
- Only 9 days on market — expect competitive offers; lowballing is unlikely to land.
- 6 sale attempts since 10y ago; this cycle's ask has dropped $30k (19%) from the opening price — seller is motivated, your offer sets the floor, not the list.
- Current owner paid $95k; 37% above their basis — modest negotiation headroom, anchor on the comps not their cost.
Risks & watch-outs
- Watch-outs: HOA is 25% of rent.
- Climate carrying-cost: severe wind risk, 99% chance of damaging wind over 30y; extreme-heat days projected 7→22/yr by 2055 (HVAC capex compounding) — expect insurance premiums to compound above CPI over the hold.
Questions for the listing agent
- What does the HOA fee cover, when was the last increase, and are there any pending special assessments or reserve-fund shortfalls?
- Is there a deadline driving the sale (1031 exchange, divorce, estate, relocation)? That informs how much negotiation room exists.
- What's the average days-on-market for RENTAL listings here right now (not sales)? A rising rental-DOM trend means longer vacancies and softer asking-rent achievability than the comps imply.
- What's the recent tenant-quality profile in this submarket — average credit score on applications, eviction rate, late-payment / NSF rate, and stable-employment percentage? A property-management company in the area should have these aggregated.
- How much new for-sale + rental construction is in the pipeline within 1–3 miles? Heavy new supply typically softens prices + rents 12–24 months out; constrained supply supports both.
Investment metrics
- 1% rule
- 1.33% ✓
- Cap rate
- 6.59%
- Cash-on-cash
- 1.04%
- DSCR
- 1.05
- GRM
- 6.3
CMA / ARV
No comps found within radius.
Projected returns pro-forma
-3.0% appreciation · 0.0% rent growth · sell at horizon
- IRR
- -19.5%
- Equity multiple
- 0.35×
- Total profit
- $-23,818
- Equity at exit
- $19,383
- IRR
- -26.3%
- Equity multiple
- -0.00×
- Total profit
- $-36,522
- Equity at exit
- $11,240
Cash invested: $36,400 (down + closing). Projections, not guarantees.
Landlord ↔ Tenant lean methodology
- Overall (STATE)
- 87 Strongly Landlord-Friendly
- State Florida
- 87 Strongly Landlord-Friendly · R+3
- County
- — inherits STATE
- City
- — inherits STATE
ZIP-level market 32905
- Home prices YoY
- -1.8%
- Rents YoY
- -0.5%
- Active inventory
- 324
- Price-to-rent
- 6.3×
Monthly cashflow live
- Estimated rent
- $1,728 high interval (Pro) →
- Mortgage (P&I)
- −$682
- Tax from tax record
- −$163 /mo · $1,952/yr
- Insurance
- −$54
- HOA
- −$435
- Vacancy / Maint / Mgmt
- −$363
- Net cashflow
- $32
Break-even live
Sensitivity live
| Price | -10% $105 | -5% $68 | +0% $32 | +5% $-5 | +10% $-42 |
|---|---|---|---|---|---|
| Rent | -10% $-105 | -5% $-37 | +0% $32 | +5% $100 | +10% $168 |
| Rate | -1.0pp $97 | -0.5pp $65 | base $32 | +0.5pp $-2 | +1.0pp $-36 |
UW: 25.0% down · 7.5% · 30yr · 1.5% tax · 5.0% vac · 8.0% maint · 8.0% mgmt
Financing live
Cash to close
- Down payment
- $32,500
- Closing costs
- $3,900
- Reserves months
- —
- Total cash needed
- —
Loan-product check · same deal, 3 products live
Conventional
25% down · 7.5% · 30yr
- Down + closing
- —
- Monthly P&I
- —
- Monthly cashflow
- —
- DSCR
- —
- Eligible?
- —
Personal DTI + credit; lowest rate.
DSCR
20% down · 8.5% · 30yr
- Down + closing
- —
- Monthly P&I
- —
- Monthly cashflow
- —
- DSCR
- —
- Eligible?
- —
No personal income docs; deal must DSCR.
Hard money
10% down · 12.0% · 12mo
- Down + closing
- —
- Monthly P&I
- —
- Monthly cashflow
- —
- DSCR
- —
- Eligible?
- —
Short-term bridge; refi at stabilization.
Rent comps 40 comps
| Address | Beds | Baths | Sqft | Rent | $/sqft | DOM | Units | Dist |
|---|---|---|---|---|---|---|---|---|
| 1630 Bottlebrush Dr Palm Bay, FL | 2.0 | 1.0 | 600 | $1,495 | $2.49 | 25d | 1 | 0.16mi |
| 1700 Woodlake Dr NE Palm Bay, FL | 1.0–2.0 | 1.0–2.0 | 875 | $1,500 | $1.71 | 25d | 12 | 0.23mi |
| 3711 Vista Oaks Cir NE Palm Bay, FL | 2.0 | 1.5 | 1236 | $1,500 | $1.21 | 23d | 1 | 0.26mi |
| 4001 Pinewood Dr NE Palm Bay, FL | 2.0 | 2.0 | 1036 | $1,269 | $1.22 | 25d | 5 | 0.26mi |
| 520 Benton Dr Melbourne, FL | 3.0 | 2.0 | 1281 | $1,850 | $1.44 | 25d | 1 | 0.34mi |
| 3016 Pinewood Dr NE Palm Bay, FL | 1.0–2.0 | 1.0 | 800 | $1,103 | $1.38 | 25d | 1 | 0.34mi |
| 1880 Mogra Cir NE Palm Bay, FL | 2.0–3.0 | 2.0 | 1090 | $1,899 | $1.74 | 16d | 6 | 0.41mi |
| 1300 Arlington Ln NE #125 Palm Bay, FL | 2.0 | 2.5 | 1140 | $1,500 | $1.32 | 21d | 1 | 0.48mi |
| 342 Crown Blvd Melbourne, FL | 3.0 | 2.0 | 1224 | $1,900 | $1.55 | 25d | 1 | 0.52mi |
| 2106 Tarrytown Ln NE Palm Bay, FL | 3.0 | 2.0 | 1281 | $1,900 | $1.48 | 16d | 1 | 0.66mi |
| 2168 Tarrytown Ln NE Palm Bay, FL | 3.0 | 2.0 | 1281 | $1,775 | $1.39 | 16d | 1 | 0.67mi |
| 1894 Coco Plum St NE Palm Bay, FL | 2.0 | 2.0 | 1188 | $1,200 | $1.01 | 21d | 1 | 0.67mi |
| 4315 S Babcock St Melbourne, FL | 1.0–3.0 | 1.0–2.0 | 996 | $2,026 | $2.03 | 15d | 15 | 0.69mi |
| 1924 Seagrape St NE Palm Bay, FL | 2.0 | 2.0 | 1206 | $1,575 | $1.31 | 16d | 1 | 0.81mi |
| 2399 Coconut Palm Dr NE Palm Bay, FL | 2.0 | 2.0 | 968 | $1,795 | $1.85 | 25d | 1 | 0.87mi |
| 1000 Palm Place Dr NE Palm Bay, FL | 1.0–2.0 | 1.0–2.0 | 884 | $2,185 | $2.47 | 23d | 8 | 0.92mi |
| 2331 Commerce Park Dr NE Palm Bay, FL | 1.0–3.0 | 1.0–2.0 | 1094 | $2,024 | $1.85 | 16d | 33 | 0.95mi |
| 2361 Commerce Park Dr NE Palm Bay, FL | 1.0–3.0 | 1.0–2.0 | 1106 | $2,255 | $2.04 | 16d | 47 | 0.98mi |
| 1265 Ethel Cir NE Palm Bay, FL | 3.0 | 2.0 | 1346 | $1,750 | $1.30 | 16d | 1 | 1.09mi |
| 2152 Spring Creek Cir NE Palm Bay, FL | 3.0 | 2.0 | 1465 | $2,249 | $1.54 | 25d | 1 | 1.19mi |
| 1264 Dawn St NE Palm Bay, FL | 3.0 | 2.0 | 1176 | $1,950 | $1.66 | 16d | 1 | 1.19mi |
| 2155 Robert J Conlan Blvd NE Palm Bay, FL | 1.0–3.0 | 1.0–2.0 | 1093 | $2,022 | $1.85 | 16d | 20 | 1.20mi |
| 2154 Henry St NE Palm Bay, FL | 4.0 | 1.5 | 1020 | $1,850 | $1.81 | 25d | 1 | 1.20mi |
| 2190 Forest Knoll Dr NE Unit 90-202 Palm Bay, FL | 2.0 | 2.0 | 1069 | $1,400 | $1.31 | 25d | 1 | 1.20mi |
| 2160 Forest Knoll Dr NE Unit 60-102 Palm Bay, FL | 2.0 | 2.0 | 1069 | $1,350 | $1.26 | 25d | 1 | 1.22mi |
| 3595 Misty Oak Dr Melbourne, FL | 1.0–2.0 | 1.0–2.0 | 747 | $1,550 | $2.07 | 15d | 6 | 1.26mi |
| 2130 Forest Knoll Dr NE #202 Palm Bay, FL | 2.0 | 2.0 | 1069 | $1,450 | $1.36 | 25d | 1 | 1.27mi |
| 1701 Forest Knoll Dr NE Palm Bay, FL | 2.0–3.0 | 2.0 | 1200 | $2,050 | $1.71 | 16d | 5 | 1.27mi |
| 1123 Tree Ridge Ln NE Palm Bay, FL | 2.0 | 1.0 | 870 | $1,350 | $1.55 | 25d | 1 | 1.27mi |
| 2100 Forest Knoll Dr NE #202 Palm Bay, FL | 2.0 | 2.0 | 1069 | $1,600 | $1.50 | 16d | 1 | 1.28mi |
| 310 Fitness Cir Melbourne, FL | 1.0–3.0 | 1.0–2.0 | 843 | $1,750 | $2.08 | 15d | 12 | 1.30mi |
| 1501 Harvard Cir Melbourne, FL | 1.0–3.0 | 1.0–2.0 | 1075 | $2,000 | $1.86 | 25d | 3 | 1.30mi |
| 1625 Sunny Brook Ln NE Unit G103 Palm Bay, FL | 3.0 | 2.0 | 914 | $1,700 | $1.86 | 25d | 1 | 1.32mi |
| 1641 Sunny Brook Ln NE Palm Bay, FL | 2.0 | 2.0 | 862 | $1,500 | $1.74 | 16d | 3 | 1.32mi |
| 1649 Sunny Brook Ln NE Palm Bay, FL | 1.0–2.0 | 1.0–2.0 | 760 | $1,950 | $2.57 | 16d | 2 | 1.32mi |
| 1601 Sunny Brook Ln NE Unit D101 Palm Bay, FL | 2.0 | 2.0 | 846 | $1,550 | $1.83 | 25d | 1 | 1.32mi |
| 1051 Clearmont St NE Unit 202 Palm Bay, FL | 2.0 | 2.0 | 993 | $1,480 | $1.49 | 21d | 1 | 1.35mi |
| 3814 Tree Ridge Ln NE Palm Bay, FL | 2.0 | 2.5 | 1170 | $1,500 | $1.28 | 25d | 1 | 1.36mi |
| 890 Luminary Cir #103 Melbourne, FL | 3.0 | 2.0 | 1277 | $1,800 | $1.41 | 16d | 1 | 1.36mi |
| 790 Luminary Cir #104 Melbourne, FL | 2.0 | 2.0 | 1008 | $1,850 | $1.84 | 25d | 1 | 1.39mi |
HOA detail
- Monthly dues
- $435 · $5,220/yr
- Likely covers
- watersewertrashinternetcableparking
Listing history 10 events
-
2026-06-22days on market $130,000 Active 9 DOM
-
2026-06-18days on market $130,000 Active 6 DOM
-
2026-06-17days on market $130,000 Active 5 DOM
-
2026-06-16days on market $130,000 Active 4 DOM
-
2026-06-15days on market $130,000 Active 3 DOM
-
2026-06-14statusdays on market $130,000 Active 1 DOM
-
2026-06-10days on market $130,000 Coming Soon 5 DOM
-
2026-06-08days on market $130,000 Coming Soon 3 DOM
-
2026-06-07remarks 699-char remark
-
2026-06-07$130,000 Coming Soon 2 DOM
ⓘ Source: listings_history table (triggers on properties + properties_extension) + one-shot
backfill from property_details.listing_events for pre-trigger history.
Tax reassessment forecast FL · Resets to sale price
- Current annual tax
- $1,952 · $163/mo
- Projected year-2 tax
- $1,952 · $163/mo
- Expected delta
- $0/yr ($0/mo · 0.0%)
ⓘ Screening estimate from a state-policy table — verify with the county assessor before closing.
Climate risk First Street
- Flood 1/10 Low FEMA zone X (unshaded) · 0% chance over 30 yrs
- Wildfire 1/10 Low
- Heat 10/10 Extreme 7 d/yr ≥105°F today · 22 d/yr by 30 yrs out
- Wind 10/10 Extreme 99% chance of damaging wind over 30 yrs
- Air quality 1/10 Low 0 unhealthy d/yr today · 0 by 30 yrs out
Nearby sold comps map
Loading sold comps map…
Walkable amenities ~0.75 mi
Loading nearby amenities…
Taxation est. · year 1
- Rental income
- $20,738
- − Mortgage interest
- −$7,282
- − Property taxes
- −$1,952
- − Insurance
- −$650
- − Repairs & maintenance
- −$1,659
- − Management
- −$1,659
- − HOA
- −$5,220
- − Depreciation
- −$3,782
- Taxable loss
- −$1,466
- Est. tax savings @ 24.0%
- +$352
- After-tax cash flow
- $732/yr
For passive investors: Depreciation is non-cash, so a rental often shows a tax loss while cash-flowing — sheltering income. Rental losses are passive: they offset passive income freely, and up to $25,000/yr can offset ordinary (W-2) income if you actively participate and your MAGI is under $100k (phasing out to $0 by $150k); unused losses carry forward. On sale, claimed depreciation is recaptured at up to 25%, and gains may owe capital-gains tax (a 1031 exchange can defer both). Figures are a year-1 estimate at your 24.0% rate — not tax advice; consult a CPA.
Schools (NCES district)
- District
- Brevard
- NCES district ID
- 1200150
- Math proficiency
- 53% ▼ -9.00%
- Reading proficiency
- 57% ▼ -4.00%
- Median HH income
- $49,426
- Composite
- 46.86/100
- National rank
- #2370
- State rank
- #19 of 73 in FL
Livability — Palm Bay
- Score
- 72/100
- State rank
- #366
- US rank
- #6458
Category grades
Schools grade is shown separately in the Schools card above.
Census & demographics
- Census place
- Palm Bay, FL
- County
- Brevard County · 602,871 people
- City population
- 132,211
- Metro
- Palm Bay-Melbourne-Titusville, FL
- Population (ZIP)
- 24,792
- Household income
- $56,411
- Rent vs Own
- Severe rent burden
- 1962.0
Population outlook (Brevard County) Hauer SSP2
- Today (2025)
- 623,254 people
- By 2030
- 648,420 · +4.0%
- By 2040
- 690,009 · +10.7%
- By 2050
- 715,669 · +14.8%
- By 2075
- 775,744 · +24.5%
- By 2100
- 776,687 · +24.6%
Race, ethnicity, and origin ACS 2023
- Neighborhood character
- Diverse neighborhood (Simpson 0.57)
- Race & ethnicity
- White 61% Hispanic / Latino 16% Black 16% Two or more races 11% Asian 2%
- Hispanic origin (detail)
- Mexican 1% Puerto Rican 4% Cuban 4%
- Common ancestry
- Romanian 2% Hispanic 2% Slovak 2%
- Foreign-born
- 13% · Canada, Jamaica
- Languages at home
- 83% English-only · Spanish 12% French/Haitian/Cajun 2% Other Indo-European 2%
Political lean MEDSL · Brevard
- 2024 margin
- Strong R (+20.8) · D 39.1% · R 59.9% · Other 1.0%
- 2008→2024 swing
- -10.4pp toward R · 2008: -10.4pp · 2024: -20.8pp
- All cycles
- 2024: R+20.8 2020: R+16.4 2016: R+19.8 2012: R+12.7 2008: R+10.4
Not yet ingested
- Civics
- —
Market trends
- HPI YoY
- ▼ -5.59%
- Current HPI
- 309.8748
- Rent YoY
- ▼ -0.52%
- Metro
- Palm Bay-Melbourne-Titusville, FL
- State GDP YoY
- ▲ 3.28%
- F500 in state
- 36
Industry mix (Fortune 500 HQ in FL)
| Industry | F500 HQs | Revenue |
|---|---|---|
| Industrial Technology | 2 | $29B |
|
||
| Insurance | 2 | $17B |
|
||
| Retail | 1 | $60B |
|
||
| Technology Distribution | 1 | $58B |
|
||
| Homebuilding | 1 | $35B |
|
||
| Technology Manufacturing | 1 | $35B |
|
||
Price history
+219.4% since first listed20 events — show timeline
- 2026-06-05 Coming Soon $130,000 SCMLS
- 2023-11-15 Sold (Public Records) $95,000 Public Records
- 2021-08-16 Sold (MLS) $157,000 Beaches MLS
- 2021-08-16 Sold (MLS) $157,000 Stellar MLS as Distributed by MLS Grid
- 2021-07-13 Pending — Stellar MLS as Distributed by MLS Grid
- 2021-07-08 Listed $159,900 Beaches MLS
- 2021-07-08 Listed $159,900 Stellar MLS as Distributed by MLS Grid
- 2021-06-29 Listing Removed — SCMLS
- 2021-06-24 Contingent — SCMLS
- 2021-06-21 Relisted — SCMLS
- 2021-06-12 Contingent — SCMLS
- 2021-06-04 Listed $159,000 SCMLS
- 2021-01-25 Sold (MLS) $115,000 SCMLS
- 2021-01-02 Contingent — SCMLS
- 2020-11-07 Listed $127,000 SCMLS
- 2016-12-19 Sold (MLS) $60,200 SCMLS
- 2016-06-17 Listed $62,900 SCMLS
- 1997-05-02 Sold (Public Records) $45,400 Public Records
- 1987-11-01 Sold (Public Records) $44,000 Public Records
- 1980-04-01 Sold (Public Records) $40,700 Public Records
Property tax history
+8.2%/yrLatest (2025): $1,952 · +2.8% YoY. Source: county tax records.
Cash-flow waterfall
monthlySold comps — $/sqft
last 12 mo · ≤1 miLoading sold comps…