 Duplex
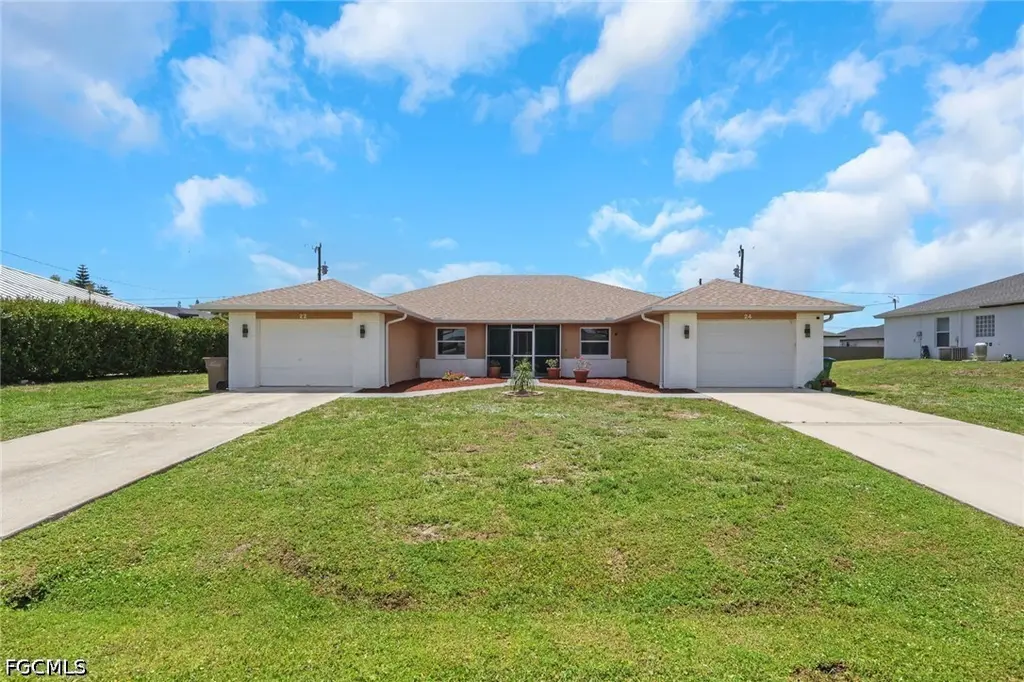
22/ 24 NW 15th Pl · Cape Coral, FL
Flood risk 6/10 · Moderate
- FEMA flood zone
- X (unshaded)
- Chance of flooding over 30 yrs
- 0.55%
- Est. flood insurance / yr
- $507 – $1,088
Fire risk 1/10 · Minimal
- Est. fire insurance / yr
- $947 – $1,759
Heat risk 10/10 · Severe
- Hot days now (above 107°F)
- 7 days/yr
- Hot days in 30 yrs
- 29 days/yr
Wind risk 10/10 · Severe
- Chance of severe wind over 30 yrs
- 99.0%
Air-quality risk 2/10 · Minimal
- Unhealthy air days now
- 1 days/yr
- Unhealthy air days in 30 yrs
- 1 days/yr
Risk factors via First Street. Map © Google.
Why this score? — see what drove the F grade
The composite is a weighted blend of 9 inputs, each scored 0–100. Each bar is that input's sub-score; the figure is the points it added to the 100-point composite (weight × sub-score).
- Cash flow +13.1/30.0
- 1% rule +4.5/10.0
- Schools +4.1/10.0
- DSCR +3.9/10.0
- Livability +3.9/5.0
- Condition / age +2.5/5.0
- Rent growth +1.1/5.0
- ARV discount +0.0/15.0
- Appreciation +0.0/10.0
$420,000
🖨 Deal sheet 📄 Offer letter ✓ Due diligence
Multi-family units
County records classify this as Multi-Family (2-4 Unit). Listing-text estimate: 2 units. confirmed
Listing remarks MLS
FABULOUS INVESTMENT OPPORTUNITY FOR THIS DUPLEX LOCATED ON OVERSIZED LOT (1/3 ACRE). EACH SIDE OFFERS 2 BEDROOMS, 2 BATHS, WITH 1,060 SQUARE FEET OF LIVING AREA AND ONE CAR GARAGES. UNITS ARE COMPLETELY TILED AND SCREENED LANAI'S AS WELL. .. NEWLY CONNECTED TO WATER AND SEWER. SELLER TO PAY ASSESSMENTS IN FULL AT CLOSING.
Key facts
- Remodeled kitchen
- New appliances
- Non-flood zone
Tags
Property features AI
Finance
- Financial info: Pets allowed
- HOA & community: No association fee; Non-gated community
Exterior
- Parking: Each unit includes an attached garage (1 garage space per unit)
- Utilities: Cable available; Sewer assessment paid; Water assessment paid
- Home design: Single-story property; Two attached-garage spaces (one garage per unit)
- Construction: Built with brick, block, concrete and stucco; Shingle roof; Resale condition
- Exterior features: Patio; Oversized lot; Public maintained road
Interior
- Kitchen: Dishwasher; Microwave; Range; Refrigerator
- Bedrooms: Each unit has 2 bedrooms (both units are two-bedroom layouts)
- Flooring: Tile; Vinyl
- Bathrooms: Four full bathrooms total (each unit has 2 full bathrooms)
- Heating & cooling: Central heating (electric); Central air; Ceiling fans; Electric cooling
- Interior features: Impact glass windows; Screened lanai/porch; Ceiling fans; Cable available; Smoke detectors
- Laundry & utility: Washer/dryer hookup in units; Laundry in garage (one unit)
Neighborhood map
What this means for you Summary
Snapshot
- This is a 2 × 2-bed/2.0-bath units multifamily listed at $420k.
Deal economics
- At list price, monthly cash flow is $-17 ($-210/yr) — negative. Per door: $-9/mo.
- To cash-flow at today's rent, offer at most $417k (0.7% below list).
- To meet the 1% rule (rent ≥ 1% of price), the offer needs to be $400k (4.7% below list).
- Recommended offer: $400k (4.7% below list) — sets the bar for 1% rule.
- Cap rate 6.2% vs local median 3.1% in Cape Coral — top-decile yield for the area; either an underpriced asset or a hidden risk that comps aren't pricing in. Stress-test before assuming the spread holds.
Location & tenants
- Location reads 77/100 on livability (#208 in FL, #3,098 nationally) — a middle-class / working-renter tenant base. Strengths: housing A+, health & safety A+, amenities B+; Watch: commute F.
- Lee (suburban): math 47% / reading 50% proficiency, ranked #42 of 73 in FL (top 58%) — families likely to look elsewhere, expect single-tenant / working-renter base with shorter leases.
- Market conditions: Rents falling (-5.5%/yr); 2652 active listings in the ZIP; 40 comparable units currently listed for rent nearby; rentals at typical pace (median 16d on market — plan ~3-4 weeks tenant-placement turnaround); solid renter incomes; 15,411 units permitted in Lee County in 2024 (4,686 in 5+ unit buildings).
- At $4,003/mo this rent would consume 53% of the median local household income ($91k/yr) (locally 286% of renters already pay >50% of income on rent) — very limited rent-growth headroom before tenants either downsize or default.
Forward outlook
- Local home prices are declining (-3.0%/yr); year-one equity from $3k of loan paydown is wiped out by about $13k of value loss. Plan a longer hold.
- Lee County population projected at +44% by 2050 — long-run rental-demand tailwind backs the buy-and-hold thesis.
Negotiation context
- Only 9 days on market — expect competitive offers; lowballing is unlikely to land.
- 3 sale attempts since 5y ago with the ask held roughly flat each time — persistent listings suggest the price (not the market) is what's stuck; bring a comps-based counter.
- Current owner paid $290k; 45% above their basis — modest negotiation headroom, anchor on the comps not their cost.
Risks & watch-outs
- Climate carrying-cost: major flood risk; severe wind risk, 99% chance of damaging wind over 30y; extreme-heat days projected 7→29/yr by 2055 (HVAC capex compounding) — expect insurance premiums to compound above CPI over the hold.
Questions for the listing agent
- What do current leases actually rent for vs. the listed asking? Can we see a recent rent roll and the last 12 months of T-12 income?
- Can we see the unit-by-unit rent roll, current vacancy, and any below-market leases? What's the average tenancy length?
- What capital expenditures (roof, boiler, parking lot, exteriors) have been made in the last 5 years, and what's planned in the next 2?
- Is there a deadline driving the sale (1031 exchange, divorce, estate, relocation)? That informs how much negotiation room exists.
- Schools are B-rated — typically a magnet for longer-tenancy family renters. What's the average tenant stay here, and is there a school-zone premium baked into asking?
- The area grade is low — what's the realistic commute time and amenity access for the typical tenant pool here? Any planned neighborhood developments (good or bad) we should know about?
- What's the average days-on-market for RENTAL listings here right now (not sales)? A rising rental-DOM trend means longer vacancies and softer asking-rent achievability than the comps imply.
- What's the recent tenant-quality profile in this submarket — average credit score on applications, eviction rate, late-payment / NSF rate, and stable-employment percentage? A property-management company in the area should have these aggregated.
- How much new apartment / multifamily construction is in the pipeline within 1–3 miles? Heavy new supply (>2% of stock underway) typically softens rents 12–24 months out; light construction supports rent growth.
Investment metrics
- 1% rule
- 0.95% ✗
- Cap rate
- 6.24%
- Cash-on-cash
- -0.18%
- DSCR
- 0.99
- GRM
- 8.7
CMA / ARV
- ARV (on-the-fly)
- $351,920
- Comps found
- 1
Show comp detail 1 sale within ~0.75 mi
| Address | Dist | Beds/Ba | Sqft | Sold | Price | $/sf | Match |
|---|---|---|---|---|---|---|---|
| 323/321 NW 16th Pl | 0.39mi | 4/4.0 | 2,100 (-1%) | 18mo | $347,900 | $166 | 65 |
Match score weights: distance 35% · size 25% · config 20% · recency 20%. Top-matched comps best support the ARV.
Projected returns pro-forma
-3.0% appreciation · 0.0% rent growth · sell at horizon
- IRR
- -20.3%
- Equity multiple
- 0.31×
- Total profit
- $-80,672
- Equity at exit
- $62,623
- IRR
- -23.0%
- Equity multiple
- 0.01×
- Total profit
- $-116,081
- Equity at exit
- $36,314
Cash invested: $117,600 (down + closing). Projections, not guarantees.
Landlord ↔ Tenant lean methodology
- Overall (STATE)
- 87 Strongly Landlord-Friendly
- State Florida
- 87 Strongly Landlord-Friendly · R+3
- County
- — inherits STATE
- City
- — inherits STATE
ZIP-level market 33993
- Home prices YoY
- -14.1%
- Rents YoY
- -5.5%
- Active inventory
- 2652
- Price-to-rent
- 17.5×
Monthly cashflow live
- Estimated rent
- $4,003 high interval (Pro) →
- Mortgage (P&I)
- −$2,203
- Tax from tax record
- −$802 /mo · $9,628/yr
- Insurance
- −$175
- HOA
- −$0
- Vacancy / Maint / Mgmt
- −$841
- Net cashflow
- $-17
Break-even live
2-unit breakdown (identical units grouped — click to expand)
| Units | Beds | Baths | Est. rent |
|---|---|---|---|
| 2× units | 2 | 2 | $4,004 |
| #1 | 2 | 2 | $2,002 |
| #2 | 2 | 2 | $2,002 |
| Total (2 units) | $4,003 | ||
UW: 25.0% down · 7.5% · 30yr · 1.5% tax · 5.0% vac · 8.0% maint · 8.0% mgmt
Financing live
Cash to close
- Down payment
- $105,000
- Closing costs
- $12,600
- Reserves months
- —
- Total cash needed
- —
Loan-product check · same deal, 3 products live
Conventional
25% down · 7.5% · 30yr
- Down + closing
- —
- Monthly P&I
- —
- Monthly cashflow
- —
- DSCR
- —
- Eligible?
- —
Personal DTI + credit; lowest rate.
DSCR
20% down · 8.5% · 30yr
- Down + closing
- —
- Monthly P&I
- —
- Monthly cashflow
- —
- DSCR
- —
- Eligible?
- —
No personal income docs; deal must DSCR.
Hard money
10% down · 12.0% · 12mo
- Down + closing
- —
- Monthly P&I
- —
- Monthly cashflow
- —
- DSCR
- —
- Eligible?
- —
Short-term bridge; refi at stabilization.
Rent comps 40 comps
| Address | Beds | Baths | Sqft | Rent | $/sqft | DOM | Units | Dist |
|---|---|---|---|---|---|---|---|---|
| 114 NW 13th Ave Cape Coral, FL | 3.0 | 2.0 | 1422 | $2,000 | $1.41 | 14d | 1 | 0.35mi |
| 305 NW 16th Pl Cape Coral, FL | 3.0 | 2.5 | 1446 | $2,095 | $1.45 | 3d | 1 | 0.36mi |
| 1400 SW 1st Ter Cape Coral, FL | 3.0 | 2.0 | 1619 | $1,995 | $1.23 | 23d | 1 | 0.36mi |
| 1214 SW Embers Ter Cape Coral, FL | 4.0 | 2.0 | 1828 | $1,900 | $1.04 | 23d | 1 | 0.39mi |
| 1827 Embers Pkwy W Cape Coral, FL | 4.0 | 3.0 | 1807 | $2,300 | $1.27 | 3d | 1 | 0.42mi |
| 1827 Embers Pkwy W Cape Coral, FL | 4.0 | 3.0 | 1807 | $2,500 | $1.38 | 14d | 1 | 0.42mi |
| 1501 NW 4th St Cape Coral, FL | 4.0 | 2.0 | 1809 | $3,800 | $2.10 | 3d | 1 | 0.45mi |
| 1900 NW Embers Ter Cape Coral, FL | 4.0 | 3.0 | 2009 | $2,900 | $1.44 | 23d | 1 | 0.46mi |
| 376 Penley Lake Cir Cape Coral, FL | 1.0–3.0 | 1.0–2.0 | 1195 | $2,874 | $2.40 | 1d | 87 | 0.47mi |
| 2023 NW 3rd Ter Cape Coral, FL | 3.0 | 2.0 | 1408 | $2,150 | $1.53 | 23d | 1 | 0.73mi |
| 2045 NW 3rd St Cape Coral, FL | 3.0 | 2.0 | 1656 | $2,095 | $1.27 | 10d | 1 | 0.77mi |
| 532 NW 18th Ave Cape Coral, FL | 3.0 | 2.0 | 1765 | $2,000 | $1.13 | 23d | 1 | 0.80mi |
| 2032 NW 5th St Cape Coral, FL | 3.0 | 2.0 | 1946 | $2,200 | $1.13 | 23d | 1 | 0.86mi |
| 233 NW 22nd Pl Cape Coral, FL | 4.0 | 3.0 | 1665 | $2,200 | $1.32 | 23d | 1 | 0.87mi |
| 1909 NW 6th Ter Cape Coral, FL | 4.0 | 2.0 | 1828 | $1,895 | $1.04 | 2d | 1 | 0.90mi |
| 1909 NW 6th Ter Cape Coral, FL | 3.0 | 2.0 | 1828 | $1,895 | $1.04 | 3d | 1 | 0.90mi |
| 223 SW 22nd Ct Cape Coral, FL | 3.0 | 3.0 | 1910 | $3,500 | $1.83 | 23d | 1 | 0.90mi |
| 417 Coral Reef Pl Cape Coral, FL | 4.0 | 2.0 | 2032 | $2,200 | $1.08 | 14d | 1 | 0.99mi |
| 421 Coral Reef Pl Cape Coral, FL | 4.0 | 3.0 | 2794 | $3,000 | $1.07 | 14d | 1 | 0.99mi |
| 623 Parkshore Lake Ave Cape Coral, FL | 4.0 | 2.0 | 2000 | $2,250 | $1.12 | 3d | 1 | 1.03mi |
| 623 Parkshore Lake Ave Cape Coral, FL | 4.0 | 2.0 | 2000 | $2,250 | $1.12 | 14d | 1 | 1.03mi |
| 2239 SW 2nd Ln Cape Coral, FL | 3.0 | 2.5 | 2362 | $2,200 | $0.93 | 23d | 1 | 1.04mi |
| 2043 NW 6th Ter Cape Coral, FL | 4.0 | 2.0 | 1712 | $2,999 | $1.75 | 23d | 1 | 1.06mi |
| 17 El Dorado Blvd N Cape Coral, FL | 3.0 | 2.0 | 1779 | $2,200 | $1.24 | 23d | 1 | 1.06mi |
| 503 SW 11th Ct Cape Coral, FL | 4.0 | 3.0 | 2211 | $2,800 | $1.27 | 23d | 1 | 1.07mi |
| 509 SW 11th Ave Cape Coral, FL | 4.0 | 2.0 | 1828 | $2,075 | $1.14 | 3d | 1 | 1.10mi |
| 749 SW 5th Ter Cape Coral, FL | 3.0 | 2.0 | 1404 | $2,065 | $1.47 | 3d | 1 | 1.10mi |
| 2251 SW 4th St Cape Coral, FL | 3.0 | 2.0 | 1806 | $1,595 | $0.88 | 10d | 1 | 1.10mi |
| 313 El Dorado Blvd N Cape Coral, FL | 3.0 | 2.0 | 1500 | $2,300 | $1.53 | 23d | 1 | 1.14mi |
| 916 NW 15th Ave Cape Coral, FL | 3.0 | 2.0 | 1458 | $1,890 | $1.30 | 3d | 1 | 1.19mi |
| 1621 NW 9th Ter Cape Coral, FL | 4.0 | 3.0 | 2020 | $2,500 | $1.24 | 23d | 1 | 1.20mi |
| 2447 SW Embers Ter Cape Coral, FL | 3.0 | 3.0 | 1870 | $2,100 | $1.12 | 16d | 1 | 1.22mi |
| 526 NW 1st Ln Cape Coral, FL | 4.0 | 2.0 | 1793 | $2,000 | $1.12 | 23d | 1 | 1.23mi |
| 2014 NW 9th St Cape Coral, FL | 4.0 | 2.0 | 1828 | $2,300 | $1.26 | 23d | 1 | 1.24mi |
| 2507 Embers Pkwy W Cape Coral, FL | 3.0 | 2.0 | 1777 | $2,450 | $1.38 | 23d | 1 | 1.25mi |
| 633 SW 9th Ave Cape Coral, FL | 3.0 | 2.0 | 1720 | $2,191 | $1.27 | 3d | 1 | 1.26mi |
| 221 SW 25th Ave Cape Coral, FL | 4.0 | 2.5 | 1871 | $2,600 | $1.39 | 2d | 1 | 1.26mi |
| 910 NW 8th Ter Cape Coral, FL | 3.0 | 2.0 | 1619 | $2,100 | $1.30 | 16d | 1 | 1.28mi |
| 713 SW 4th Ter Cape Coral, FL | 3.0 | 2.0 | 1756 | $2,085 | $1.19 | 2d | 1 | 1.28mi |
| 1012 NW 15th Ave Cape Coral, FL | 3.0 | 2.0 | 1805 | $1,985 | $1.10 | 23d | 1 | 1.28mi |
Listing history 7 events
-
2026-06-18days on market $420,000 Active 9 DOM
-
2026-06-17days on market $420,000 Active 8 DOM
-
2026-06-16days on market $420,000 Active 7 DOM
-
2026-06-15days on market $420,000 Active 6 DOM
-
2026-06-13days on market $420,000 Active 4 DOM
-
2026-06-10remarks 699-char remark
-
2026-06-10$420,000 Active 1 DOM
ⓘ Source: listings_history table (triggers on properties + properties_extension) + one-shot
backfill from property_details.listing_events for pre-trigger history.
Tax reassessment forecast FL · Resets to sale price
- Current annual tax
- $9,628 · $802/mo
- Projected year-2 tax
- $9,628 · $802/mo
- Expected delta
- $0/yr ($0/mo · 0.0%)
ⓘ Screening estimate from a state-policy table — verify with the county assessor before closing.
Climate risk First Street
- Flood 6/10 Major FEMA zone X (unshaded) · 55% chance over 30 yrs
- Wildfire 1/10 Low
- Heat 10/10 Extreme 7 d/yr ≥107°F today · 29 d/yr by 30 yrs out
- Wind 10/10 Extreme 99% chance of damaging wind over 30 yrs
- Air quality 2/10 Low 1 unhealthy d/yr today · 1 by 30 yrs out
Nearby sold comps map
Loading sold comps map…
Walkable amenities ~0.75 mi
Loading nearby amenities…
Taxation est. · year 1
- Rental income
- $48,036
- − Mortgage interest
- −$23,527
- − Property taxes
- −$9,628
- − Insurance
- −$2,100
- − Repairs & maintenance
- −$3,843
- − Management
- −$3,843
- − Depreciation
- −$12,218
- Taxable loss
- −$7,122
- Est. tax savings @ 24.0%
- +$1,709
- After-tax cash flow
- $1,500/yr
For passive investors: Depreciation is non-cash, so a rental often shows a tax loss while cash-flowing — sheltering income. Rental losses are passive: they offset passive income freely, and up to $25,000/yr can offset ordinary (W-2) income if you actively participate and your MAGI is under $100k (phasing out to $0 by $150k); unused losses carry forward. On sale, claimed depreciation is recaptured at up to 25%, and gains may owe capital-gains tax (a 1031 exchange can defer both). Figures are a year-1 estimate at your 24.0% rate — not tax advice; consult a CPA.
Schools (NCES district)
- District
- Lee
- NCES district ID
- 1201080
- Math proficiency
- 47% ▼ -11.00%
- Reading proficiency
- 50% ▼ -4.00%
- Median HH income
- $49,518
- Composite
- 41.49/100
- National rank
- #3458
- State rank
- #42 of 73 in FL
Livability — Cape Coral
- Score
- 77/100
- State rank
- #208
- US rank
- #3098
Category grades
Schools grade is shown separately in the Schools card above.
Census & demographics
- Census place
- Cape Coral, FL
- County
- Lee County · 788,662 people
- City population
- 217,388
- Metro
- Cape Coral-Fort Myers, FL
- Population (ZIP)
- 35,580
- Household income
- $90,577
- Rent vs Own
- Severe rent burden
- 286.0
Population outlook (Lee County) Hauer SSP2
- Today (2025)
- 871,946 people
- By 2030
- 955,468 · +9.6%
- By 2040
- 1,113,587 · +27.7%
- By 2050
- 1,256,891 · +44.1%
- By 2075
- 1,560,270 · +78.9%
- By 2100
- 1,726,848 · +98.0%
Race, ethnicity, and origin ACS 2023
- Neighborhood character
- Diverse neighborhood (Simpson 0.58)
- Race & ethnicity
- White 57% Hispanic / Latino 30% Two or more races 21% Black 7% Asian 2%
- Hispanic origin (detail)
- Mexican 2% Puerto Rican 6% Cuban 17% Dominican 1%
- Common ancestry
- Romanian 2% Hispanic 2% Lithuanian 2%
- Foreign-born
- 21% · Canada, Jamaica, China
- Languages at home
- 73% English-only · Spanish 24% French/Haitian/Cajun 1% Russian/Polish/Slavic 1%
Political lean MEDSL · Lee
- 2024 margin
- Strong R (+28.4) · D 35.5% · R 63.9%
- 2008→2024 swing
- -18.0pp toward R · 2008: -10.4pp · 2024: -28.4pp
- All cycles
- 2024: R+28.4 2020: R+19.2 2016: R+20.4 2012: R+16.6 2008: R+10.4
Not yet ingested
- Civics
- —
Market trends
- HPI YoY
- ▼ -55.34%
- Current HPI
- 337.0575
- Rent YoY
- ▼ -5.51%
- Metro
- Cape Coral-Fort Myers, FL
- State GDP YoY
- ▲ 3.28%
- F500 in state
- 36
Industry mix (Fortune 500 HQ in FL)
| Industry | F500 HQs | Revenue |
|---|---|---|
| Industrial Technology | 2 | $29B |
|
||
| Insurance | 2 | $17B |
|
||
| Retail | 1 | $60B |
|
||
| Technology Distribution | 1 | $58B |
|
||
| Homebuilding | 1 | $35B |
|
||
| Technology Manufacturing | 1 | $35B |
|
||
Price history
+106.9% since first listed10 events — show timeline
- 2026-06-09 Listed $420,000 FORTMLS
- 2021-04-15 Sold (Public Records) $289,900 Public Records
- 2021-04-13 Sold (MLS) $289,900 FORTMLS
- 2021-02-23 Pending — FORTMLS
- 2021-02-23 Price Changed $293,500 FORTMLS
- 2021-02-22 Relisted — FORTMLS
- 2021-02-18 Pending — FORTMLS
- 2021-02-18 Price Changed $289,900 FORTMLS
- 2021-02-15 Listed $274,500 FORTMLS
- 2006-06-23 Sold (Public Records) $203,000 Public Records
Property tax history
+12.2%/yrLatest (2025): $9,628 · +8.5% YoY. Source: county tax records.
Cash-flow waterfall
monthlySold comps — $/sqft
last 12 mo · ≤1 miLoading sold comps…