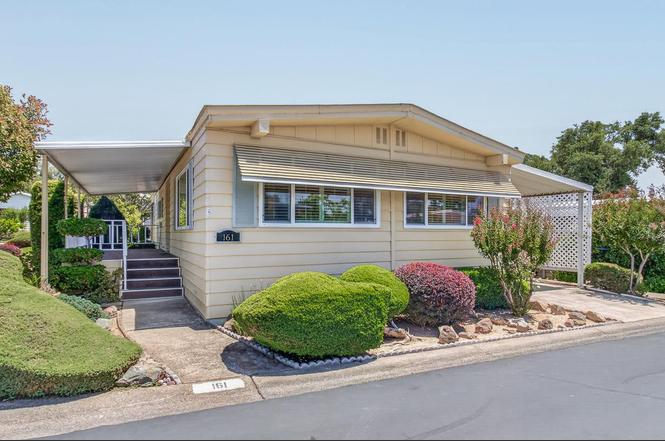
161 Overbrook Dr · Folsom, CA
Flood risk 3/10 · Minor
- FEMA flood zone
- X (unshaded)
- Chance of flooding over 30 yrs
- 0.12%
- Est. flood insurance / yr
- $507 – $1,088
Fire risk 3/10 · Minor
- Est. fire insurance / yr
- $659 – $1,223
Heat risk 7/10 · Major
- Hot days now (above 103°F)
- 7 days/yr
- Hot days in 30 yrs
- 15 days/yr
Wind risk 1/10 · Minimal
- Chance of severe wind over 30 yrs
- —
Air-quality risk 10/10 · Severe
- Unhealthy air days now
- 30 days/yr
- Unhealthy air days in 30 yrs
- 38 days/yr
Risk factors via First Street. Map © Google.
Why this score? — see what drove the C grade
The composite is a weighted blend of 9 inputs, each scored 0–100. Each bar is that input's sub-score; the figure is the points it added to the 100-point composite (weight × sub-score).
- Cash flow +27.8/30.0
- DSCR +9.8/10.0
- 1% rule +7.6/10.0
- Livability +3.6/5.0
- Rent growth +2.9/5.0
- Condition / age +2.5/5.0
- Schools +2.4/10.0
- ARV discount +0.0/15.0
- Appreciation +0.0/10.0
$229,900
🖨 Deal sheet (PDF) 📄 Offer letter ✓ Due diligence
Listing remarks
Come and check out this beauty in Pinebrook Village, the only 5 start park around. This incredible community has it all; 2 miles of treed walking trails on 75 acres with water features, a community garden, a car wash and even storage for your RV. That's just the park! From the pristine landscaping to the fully remodeled kitchen with granite counters this corner lot home is located close to the clubhouse and swimming pool, has 3 bedrooms, perfect for an office or craft room. Both bathrooms have been updated and it has a separate vanity in the Master in addition to double sinks. In case you're thinking it's all cosmetic, the infrastructure has had significant work or replacement done as well,
Key facts
- Storage for your rv
- Car wash
- Community garden
Tags
Property features AI
Finance
- Other: Directions: Enter Pinebrook Village off Auburn-Folsom Road. Turn left at the clubhouse. Home is on your left at corner of Overbrook and Rockglen.
- HOA & community: No association; Located in a senior community; Land lease required ($975)
Exterior
- Parking: Attached covered parking
- Utilities: Public water; Public sewer; Cable available; Internet available; 220V outlet in laundry
- Home design: Manufactured home (double wide) located in a park; Silvercrest make; Built in 1972; Updated/remodeled
- Construction: Aluminum skirting; Foam roof
- Exterior features: Carport awning and porch awning; Corner lot, landscaped front yard; Auto sprinkler front and rear; Close to clubhouse; Storage shed(s)
Interior
- Kitchen: Free standing gas range and oven; Gas cooktop with hood over; Refrigerator; Dishwasher; Microwave; Disposal; Pantry cabinet and pantry closet; Stone countertops
- Bedrooms: Three bedrooms
- Flooring: Vinyl flooring
- Bathrooms: Two full bathrooms; Double sinks, low-flow showers and toilets, tub with shower over, and shower stall(s)
- Heating & cooling: Central heating; Central cooling; Ceiling fans
- Interior features: Updated/remodeled interior; Dual-pane partial windows with coverings and screens; Carpeted porch steps and railed porch; Storage areas inside
- Laundry & utility: Washer and dryer included; Laundry in inside area with electric hookup; Insulated water heater
Neighborhood map
What this means for you Summary
Snapshot
- This is a 3-bed/2.0-bath manufactured listed at $230k.
Deal economics
- At list price, monthly cash flow is $701 ($8k/yr) — positive.
- The deal already cash-flows at list — no discount required.
- Meets the 1% rule at list price ($3k rent vs $230k).
- Cap rate 10.0% vs local median 2.5% in Folsom — top-decile yield for the area; either an underpriced asset or a hidden risk that comps aren't pricing in. Stress-test before assuming the spread holds.
Location & tenants
- Location reads 72/100 on livability (#190 in CA) — a middle-class / working-renter tenant base. Strengths: employment A+, housing A+, crime B+; Watch: amenities D, commute F, cost of living F.
- Folsom-Cordova Unified (urban): math 25% / reading 25% proficiency, ranked #365 of 517 in CA (top 71%) — low school quality limits family demand, transient renter base, plan for 1-2y turnover.
- Zoned schools: Carl H. Sundahl Elementary (332 students, 10% FRL); Sutter Middle (1,552 students, 15% FRL); Folsom High (2,718 students, 12% FRL) — zoned schools average 12% FRL vs 29% district-wide (17 pts lower); this property's tenant base skews higher-income than the district average.
- Market conditions: Rents rising (+1.7%/yr); 431 active listings in the ZIP; 4 comparable units currently listed for rent nearby; rentals leasing fast (median 9d on market — plan ~1-2 weeks tenant-placement turnaround); high-income renter base; 6,825 units permitted in Sacramento County in 2024 (1,752 in 5+ unit buildings).
Forward outlook
- Local home prices are declining (-3.0%/yr); year-one equity from $2k of loan paydown is wiped out by about $7k of value loss. Plan a longer hold.
- Sacramento County population projected at +17% by 2050 — long-run rental-demand tailwind backs the buy-and-hold thesis.
Negotiation context
- Only 11 days on market — expect competitive offers; lowballing is unlikely to land.
Risks & watch-outs
- Climate carrying-cost: extreme-heat days projected 7→15/yr by 2055 (HVAC capex compounding) — expect insurance premiums to compound above CPI over the hold.
Questions for the listing agent
- Built in 1972 — when were the roof, HVAC, electrical panel, plumbing, and water heater last replaced?
- Is there a deadline driving the sale (1031 exchange, divorce, estate, relocation)? That informs how much negotiation room exists.
- Schools are A-rated — typically a magnet for longer-tenancy family renters. What's the average tenant stay here, and is there a school-zone premium baked into asking?
- What's the average days-on-market for RENTAL listings here right now (not sales)? A rising rental-DOM trend means longer vacancies and softer asking-rent achievability than the comps imply.
- What's the recent tenant-quality profile in this submarket — average credit score on applications, eviction rate, late-payment / NSF rate, and stable-employment percentage? A property-management company in the area should have these aggregated.
- How much new for-sale + rental construction is in the pipeline within 1–3 miles? Heavy new supply typically softens prices + rents 12–24 months out; constrained supply supports both.
Investment metrics
- 1% rule
- 1.26% ✓
- Cap rate
- 9.95%
- Cash-on-cash
- 13.07%
- DSCR
- 1.58
- GRM
- 6.6
CMA / ARV
- ARV (on-the-fly)
- $192,960
- Comps found
- 12
Show comp detail 12 sales within ~0.75 mi
| Address | Dist | Beds/Ba | Sqft | Sold | Price | $/sf | Match |
|---|---|---|---|---|---|---|---|
| 95 Shadowbrook Ct | 0.11mi | 2/2.0 (-1) | 1,440 (0%) | 4mo | $170,000 | $118 | 87 |
| 320 Stonebrook Dr | 0.16mi | 2/2.0 (-1) | 1,440 (0%) | 5mo | $165,950 | $115 | 83 |
| 330 Stonebrook Dr | 0.16mi | 2/2.0 (-1) | 1,440 (0%) | 7mo | $206,450 | $143 | 81 |
| 230 Northlake Dr | 0.13mi | 2/1.5 (-1) | 1,440 (0%) | 7mo | $299,500 | $208 | 81 |
| 276 Meadowrock Way | 0.17mi | 2/2.0 (-1) | 1,344 (-7%) | 1mo | $180,000 | $134 | 75 |
| 342 Danielle Way | 0.38mi | 2/2.0 (-1) | 1,440 (0%) | 5mo | $155,000 | $108 | 73 |
| 340 Stonebrook Dr | 0.16mi | 2/2.0 (-1) | 1,536 (+7%) | 7mo | $170,000 | $111 | 71 |
| 155 Leafwood Way | 0.07mi | 2/2.0 (-1) | 1,248 (-13%) | 1mo | $185,000 | $148 | 68 |
| 587 Southwood | 0.28mi | 2/2.0 (-1) | 1,536 (+7%) | 3mo | $330,000 | $215 | 68 |
| 240 Stonebrook Dr | 0.16mi | 2/2.0 (-1) | 1,640 (+14%) | 2mo | $299,950 | $183 | 63 |
| 347 Danielle Way | 0.37mi | 2/2.0 (-1) | 1,248 (-13%) | 2mo | $138,000 | $111 | 54 |
| 257 Bluebird Ln | 0.54mi | 2/2.0 (-1) | 1,620 (+12%) | 0mo | $189,000 | $117 | 49 |
Match score weights: distance 35% · size 25% · config 20% · recency 20%. Top-matched comps best support the ARV.
Projected returns pro-forma
-3.0% appreciation · 1.72% rent growth · sell at horizon
- IRR
- 1.5%
- Equity multiple
- 1.06×
- Total profit
- $3,764
- Equity at exit
- $34,279
- IRR
- 9.9%
- Equity multiple
- 1.72×
- Total profit
- $46,221
- Equity at exit
- $19,878
Cash invested: $64,372 (down + closing). Projections, not guarantees.
Landlord ↔ Tenant lean methodology
- Overall (STATE)
- 18 Strongly Tenant-Friendly
- State California
- 18 Strongly Tenant-Friendly · D+13
- County
- — inherits STATE
- City
- — inherits STATE
ZIP-level market 95630
- Rents YoY
- 1.7%
- Active inventory
- 431
- Price-to-rent
- 6.6×
Monthly cashflow live
- Estimated rent
- $2,899 medium interval (Pro) →
- Mortgage (P&I)
- −$1,206
- Tax est. 1.5%
- −$287 /mo · $3,448/yr
- Insurance
- −$96
- HOA
- −$0
- Vacancy / Maint / Mgmt
- −$609
- Net cashflow
- $701
Break-even live
Sensitivity live
| Price | -10% $860 | -5% $781 | +0% $701 | +5% $622 | +10% $542 |
|---|---|---|---|---|---|
| Rent | -10% $472 | -5% $587 | +0% $701 | +5% $816 | +10% $930 |
| Rate | -1.0pp $817 | -0.5pp $760 | base $701 | +0.5pp $642 | +1.0pp $581 |
UW: 25.0% down · 7.5% · 30yr · 1.5% tax · 5.0% vac · 8.0% maint · 8.0% mgmt
Financing live
Cash to close
- Down payment
- $57,475
- Closing costs
- $6,897
- Reserves months
- —
- Total cash needed
- —
Loan-product check · same deal, 3 products live
Conventional
25% down · 7.5% · 30yr
- Down + closing
- —
- Monthly P&I
- —
- Monthly cashflow
- —
- DSCR
- —
- Eligible?
- —
Personal DTI + credit; lowest rate.
DSCR
20% down · 8.5% · 30yr
- Down + closing
- —
- Monthly P&I
- —
- Monthly cashflow
- —
- DSCR
- —
- Eligible?
- —
No personal income docs; deal must DSCR.
Hard money
10% down · 12.0% · 12mo
- Down + closing
- —
- Monthly P&I
- —
- Monthly cashflow
- —
- DSCR
- —
- Eligible?
- —
Short-term bridge; refi at stabilization.
Rent comps 4 comps
| Address | Beds | Baths | Sqft | Rent | $/sqft | DOM | Units | Dist |
|---|---|---|---|---|---|---|---|---|
| 104 Lost Lake Ct Folsom, CA | 3.0 | 3.0 | 1867 | $2,995 | $1.60 | 0d | 1 | 1.10mi |
| 340 Caples Dr Folsom, CA | 3.0 | 2.5 | 1423 | $2,795 | $1.96 | 9d | 1 | 1.13mi |
| 288 Marsalla Dr Folsom, CA | 3.0 | 2.0 | 1130 | $2,495 | $2.21 | 45d | 1 | 1.22mi |
| 1600 Canyon Terrace Ln Folsom, CA | 1.0–2.0 | 1.0–2.0 | 838 | $2,660 | $3.17 | 0d | 16 | 1.42mi |
Listing history 8 events
-
2026-06-21days on market $229,900 Active 11 DOM
-
2026-06-18days on market $229,900 Active 8 DOM
-
2026-06-17days on market $229,900 Active 7 DOM
-
2026-06-16days on market $229,900 Active 6 DOM
-
2026-06-15days on market $229,900 Active 5 DOM
-
2026-06-13days on market $229,900 Active 3 DOM
-
2026-06-13remarks 699-char remark
-
2026-06-13$229,900 Active 2 DOM
ⓘ Source: listings_history table (triggers on properties + properties_extension) + one-shot
backfill from property_details.listing_events for pre-trigger history.
Climate risk First Street
- Flood 3/10 Moderate FEMA zone X (unshaded) · 12% chance over 30 yrs
- Wildfire 3/10 Moderate
- Heat 7/10 Severe 7 d/yr ≥103°F today · 15 d/yr by 30 yrs out
- Wind 1/10 Low
- Air quality 10/10 Extreme 30 unhealthy d/yr today · 38 by 30 yrs out
Nearby sold comps map
Loading sold comps map…
Walkable amenities ~0.75 mi
Loading nearby amenities…
Taxation est. · year 1
- Rental income
- $34,785
- − Mortgage interest
- −$12,878
- − Property taxes
- −$3,448
- − Insurance
- −$1,150
- − Repairs & maintenance
- −$2,783
- − Management
- −$2,783
- − Depreciation
- −$6,688
- Taxable income
- $5,055
- Est. tax owed @ 24.0%
- −$1,213
- After-tax cash flow
- $7,201/yr
For passive investors: Depreciation is non-cash, so a rental often shows a tax loss while cash-flowing — sheltering income. Rental losses are passive: they offset passive income freely, and up to $25,000/yr can offset ordinary (W-2) income if you actively participate and your MAGI is under $100k (phasing out to $0 by $150k); unused losses carry forward. On sale, claimed depreciation is recaptured at up to 25%, and gains may owe capital-gains tax (a 1031 exchange can defer both). Figures are a year-1 estimate at your 24.0% rate — not tax advice; consult a CPA.
Schools (NCES district)
- District
- Folsom-Cordova Unified
- NCES district ID
- 0613890
- Math proficiency
- 25% ▼ -27.00%
- Reading proficiency
- 25% ▼ -38.00%
- Median HH income
- $75,408
- Composite
- 24.49/100
- National rank
- #7656
- State rank
- #365 of 517 in CA
Livability — Folsom
- Score
- 72/100
- State rank
- #190
- US rank
- #6125
Category grades
Schools grade is shown separately in the Schools card above.
Census & demographics
- Census place
- Folsom, CA
- County
- Sacramento County · 1,539,646 people
- City population
- 79,484
- Metro
- Sacramento-Roseville-Folsom, CA
- Population (ZIP)
- 79,484
- Household income
- $139,642
- Rent vs Own
- Severe rent burden
- 1651.0
Population outlook (Sacramento County) Hauer SSP2
- Today (2025)
- 1,660,763 people
- By 2030
- 1,732,990 · +4.3%
- By 2040
- 1,855,755 · +11.7%
- By 2050
- 1,941,335 · +16.9%
- By 2075
- 2,046,162 · +23.2%
- By 2100
- 1,961,444 · +18.1%
Race, ethnicity, and origin ACS 2023
- Neighborhood character
- Diverse neighborhood (Simpson 0.61)
- Race & ethnicity
- White 58% Asian 20% Hispanic / Latino 13% Two or more races 11% Black 3%
- Hispanic origin (detail)
- Mexican 9% Puerto Rican 1%
- Common ancestry
- Italian 4% Slovak 2% Portuguese 2%
- Foreign-born
- 20% · Canada, China, Vietnam
- Languages at home
- 75% English-only · Other Indo-European 7% Spanish 5% Other Asian/Pacific 5%
Political lean MEDSL · Sacramento
- 2024 margin
- D (+19.7) · D 58.1% · R 38.4% · Other 3.5%
- 2008→2024 swing
- +0.7pp no change · 2008: 19.0pp · 2024: 19.7pp
- All cycles
- 2024: D+19.7 2020: D+25.3 2016: D+23.7 2012: D+16.3 2008: D+19.0
Not yet ingested
- Civics
- —
Market trends
- HPI YoY
- ▼ -240.39%
- Current HPI
- 286.0579
- Rent YoY
- ▲ 1.72%
- Metro
- Sacramento-Roseville-Folsom, CA
- State GDP YoY
- ▲ 3.21%
- F500 in state
- 116
Industry mix (Fortune 500 HQ in CA)
| Industry | F500 HQs | Revenue |
|---|---|---|
| Technology | 27 | $1,492B |
|
||
| Financial Services | 3 | $174B |
|
||
| Retail | 3 | $44B |
|
||
| Insurance | 3 | $26B |
|
||
| Media / Entertainment | 2 | $115B |
|
||
| Pharmaceuticals / Biotech | 2 | $62B |
|
||
Cash-flow waterfall
monthlySold comps — $/sqft
last 12 mo · ≤1 miLoading sold comps…