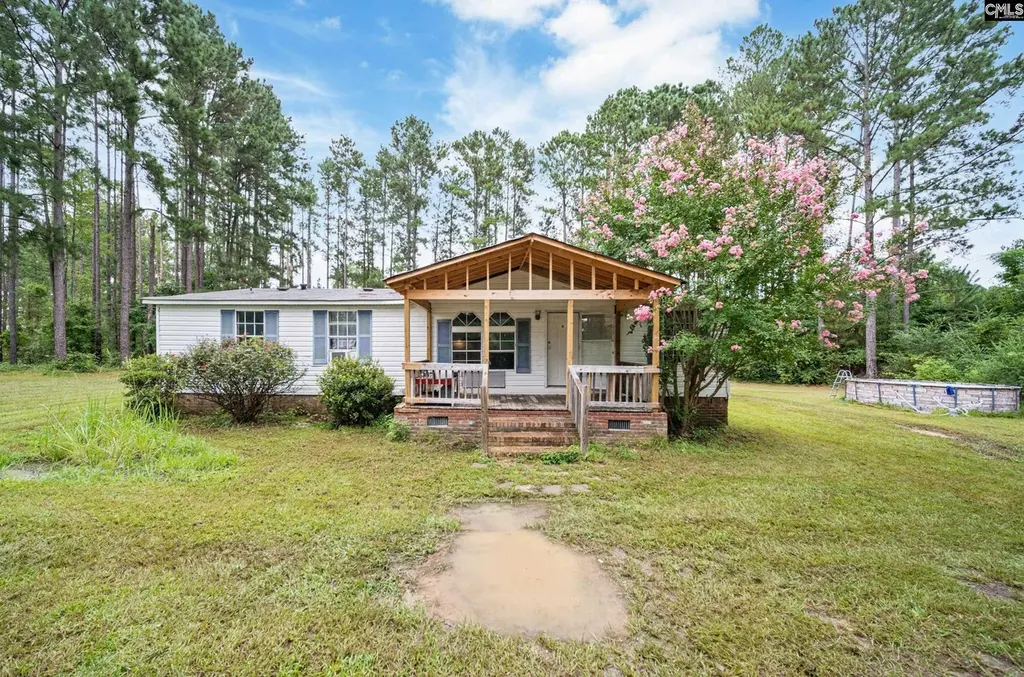
64 Favor Rd · Camden, SC
Flood risk 1/10 · Minimal
- FEMA flood zone
- X (unshaded)
- Chance of flooding over 30 yrs
- 0.0%
- Est. flood insurance / yr
- $507 – $1,088
Fire risk 5/10 · Moderate
- Est. fire insurance / yr
- $783 – $1,453
Heat risk 6/10 · Moderate
- Hot days now (above 106°F)
- 7 days/yr
- Hot days in 30 yrs
- 16 days/yr
Wind risk 6/10 · Moderate
- Chance of severe wind over 30 yrs
- 74.0%
Air-quality risk 2/10 · Minimal
- Unhealthy air days now
- 1 days/yr
- Unhealthy air days in 30 yrs
- 2 days/yr
Risk factors via First Street. Map © Google.
Why this score? — see what drove the C grade
The composite is a weighted blend of 9 inputs, each scored 0–100. Each bar is that input's sub-score; the figure is the points it added to the 100-point composite (weight × sub-score).
- Cash flow +23.7/30.0
- DSCR +7.6/10.0
- ARV discount +7.5/15.0
- 1% rule +5.0/10.0
- Schools +3.8/10.0
- Livability +3.1/5.0
- Rent growth +2.5/5.0
- Condition / age +2.5/5.0
- Appreciation +0.0/10.0
$170,000
🖨 Deal sheet 📄 Offer letter ✓ Due diligence
Listing remarks
Looking for space, value, and the freedom to make a home your own? This one delivers. Welcome to this spacious 4-bedroom, 2-bath home nestled on 1.70 peaceful acres in Camden! With plenty of room to spread out both inside and out, this property offers the perfect blend of comfort, privacy, and opportunity. Several major updates have already been completed, including a brand new HVAC system installed in 2026, roof replaced in 2023, and new kitchen cabinets—giving you a strong head start and peace of mind on big-ticket items. Inside, you’ll find a generous layout ideal for everyday living, while outside features covered front and back patios, perfect for relaxing and enjoying the
Key facts
- New kitchen cabinets
- Roof replaced
- New hvac system
Tags
Property features AI
Exterior
- Utilities: Public water; Septic sewer
- Home design: Single-family home (1,380 heated square feet)
- Construction: Crawlspace foundation
- Exterior features: Vinyl exterior finish; Paved road access
Interior
- Kitchen: Formica countertops; Painted cabinets; Laminate flooring in the kitchen
- Bedrooms: Master bedroom on the main level with double vanity, private bath and private closet; All other bedrooms located on the main level
- Flooring: Laminate floor in the kitchen
- Bathrooms: Two full bathrooms (including two main full baths)
- Heating & cooling: Central cooling; Electric heating
- Interior features: Formal living room on the main level; Dining room on the main level
- Laundry & utility: Main-level laundry in a heated space; Electric hookup for washer/dryer
Neighborhood map
What this means for you Summary
Snapshot
- This is a 4-bed/2.0-bath other listed at $170k.
Deal economics
- At list price, monthly cash flow is $322 ($4k/yr) — positive.
- The deal already cash-flows at list — no discount required.
- Meets the 1% rule at list price ($2k rent vs $170k).
- Recommended offer: $165k (3.0% below list) — sets the bar for market timing.
- Cap rate 8.6% vs local median 3.8% in Camden — top-decile yield for the area; either an underpriced asset or a hidden risk that comps aren't pricing in. Stress-test before assuming the spread holds.
Location & tenants
- Location reads 61/100 on livability (#218 in SC) — a middle-class / working-renter tenant base. Strengths: cost of living A+, housing A+; Watch: employment D, crime F, amenities F.
- Kershaw 01 (rural): math 38% / reading 51% proficiency, ranked #25 of 80 in SC (top 31%) — families likely to look elsewhere, expect single-tenant / working-renter base with shorter leases.
- Zoned schools: Pine Tree Hill Elementary (math 40% / reading 51%, grade D-, #221 of 597 statewide, top 37%, 501 students, 73% FRL); Camden High (math 37% / reading 77%, grade C, #120 of 196 statewide, top 64%, 1,124 students, 71% FRL) — zoned schools average 72% FRL vs 49% district-wide (23 pts higher); higher-poverty schools than district average — tighter screening recommended.
- Market conditions: 231 active listings in the ZIP; 491 units permitted in Kershaw County in 2024 (0 in 5+ unit buildings).
Forward outlook
- Local home prices are declining (-3.0%/yr); year-one equity from $1k of loan paydown is wiped out by about $5k of value loss. Plan a longer hold.
- Kershaw County population projected at +8% by 2050 — modest demand growth; plan on rents tracking national, not racing it.
Negotiation context
- It's been on market 47 days — a 3% lower offer ($165k) is reasonable based on typical stale-listing flexibility.
- 2 sale attempts with the ask held roughly flat each time — persistent listings suggest the price (not the market) is what's stuck; bring a comps-based counter.
- Current owner paid $63k; list at $170k implies a 170% gain — meaningful room to come down on a strong offer.
Risks & watch-outs
- Climate carrying-cost: major wind risk, 74% chance of damaging wind over 30y; moderate wildfire risk; extreme-heat days projected 7→16/yr by 2055 (HVAC capex compounding) — expect insurance premiums to compound above CPI over the hold.
Questions for the listing agent
- It's been on market 47 days. Have you received any prior offers? Is the seller open to a 3% concession, seller financing, or rate buy-down credit?
- Is there a deadline driving the sale (1031 exchange, divorce, estate, relocation)? That informs how much negotiation room exists.
- Schools are D-rated, which usually means shorter tenancies and higher turnover. Who's the typical renter profile here, and what's been the actual vacancy rate?
- Crime grade is F in this area — have there been break-ins, vandalism, or insurance claims at this property in the last 3 years? What carrier currently insures it and at what premium?
- What's the average days-on-market for RENTAL listings here right now (not sales)? A rising rental-DOM trend means longer vacancies and softer asking-rent achievability than the comps imply.
- What's the recent tenant-quality profile in this submarket — average credit score on applications, eviction rate, late-payment / NSF rate, and stable-employment percentage? A property-management company in the area should have these aggregated.
- How much new for-sale + rental construction is in the pipeline within 1–3 miles? Heavy new supply typically softens prices + rents 12–24 months out; constrained supply supports both.
Investment metrics
- 1% rule
- 1.00% ✓
- Cap rate
- 8.57%
- Cash-on-cash
- 8.12%
- DSCR
- 1.36
- GRM
- 8.3
CMA / ARV
No comps found within radius.
Projected returns pro-forma
-3.0% appreciation · 3.0% rent growth · sell at horizon
- IRR
- -4.0%
- Equity multiple
- 0.85×
- Total profit
- $-7,100
- Equity at exit
- $25,348
- IRR
- 5.7%
- Equity multiple
- 1.42×
- Total profit
- $19,964
- Equity at exit
- $14,698
Cash invested: $47,600 (down + closing). Projections, not guarantees.
Landlord ↔ Tenant lean methodology
- Overall (STATE)
- 90 Strongly Landlord-Friendly
- State South Carolina
- 90 Strongly Landlord-Friendly · R+6
- County
- — inherits STATE
- City
- — inherits STATE
ZIP-level market 29020
- Home prices YoY
- -29.7%
- Active inventory
- 231
- Price-to-rent
- 8.3×
Monthly cashflow live
- Estimated rent
- $1,706 medium interval (Pro) →
- Mortgage (P&I)
- −$891
- Tax from tax record
- −$63 /mo · $756/yr
- Insurance
- −$71
- HOA
- −$0
- Vacancy / Maint / Mgmt
- −$358
- Net cashflow
- $322
Break-even live
UW: 25.0% down · 7.5% · 30yr · 1.5% tax · 5.0% vac · 8.0% maint · 8.0% mgmt
Financing live
Cash to close
- Down payment
- $42,500
- Closing costs
- $5,100
- Reserves months
- —
- Total cash needed
- —
Loan-product check · same deal, 3 products live
Conventional
25% down · 7.5% · 30yr
- Down + closing
- —
- Monthly P&I
- —
- Monthly cashflow
- —
- DSCR
- —
- Eligible?
- —
Personal DTI + credit; lowest rate.
DSCR
20% down · 8.5% · 30yr
- Down + closing
- —
- Monthly P&I
- —
- Monthly cashflow
- —
- DSCR
- —
- Eligible?
- —
No personal income docs; deal must DSCR.
Hard money
10% down · 12.0% · 12mo
- Down + closing
- —
- Monthly P&I
- —
- Monthly cashflow
- —
- DSCR
- —
- Eligible?
- —
Short-term bridge; refi at stabilization.
Listing history 18 events
-
2026-06-18days on market $170,000 Active 47 DOM
-
2026-06-17days on market $170,000 Active 46 DOM
-
2026-06-16days on market $170,000 Active 45 DOM
-
2026-06-15days on market $170,000 Active 44 DOM
-
2026-06-14days on market $170,000 Active 42 DOM
-
2026-06-10days on market $170,000 Active 39 DOM
-
2026-06-09days on market $170,000 Active 38 DOM
-
2026-06-08days on market $170,000 Active 37 DOM
-
2026-06-07days on market $170,000 Active 36 DOM
-
2026-06-05days on market $170,000 Active 33 DOM
-
2026-06-03days on market $170,000 Active 32 DOM
-
2026-06-03days on market $170,000 Active 31 DOM
-
2026-06-02days on market $170,000 Active 30 DOM
-
2026-05-31days on market $170,000 Active 29 DOM
-
2026-05-02$170,000 Active
-
2025-08-18$120,000 Active
-
2004-05-20soldstatus $63,000
-
2002-07-19soldstatus $59,900
ⓘ Source: listings_history table (triggers on properties + properties_extension) + one-shot
backfill from property_details.listing_events for pre-trigger history.
Tax reassessment forecast SC · Resets to sale price
- Current annual tax
- $756 · $63/mo
- Projected year-2 tax
- $969 · $81/mo
- Expected delta
- +$213/yr (+$18/mo · 28.2%)
ⓘ Screening estimate from a state-policy table — verify with the county assessor before closing.
Climate risk First Street
- Flood 1/10 Low FEMA zone X (unshaded) · 0% chance over 30 yrs
- Wildfire 5/10 Major
- Heat 6/10 Major 7 d/yr ≥106°F today · 16 d/yr by 30 yrs out
- Wind 6/10 Major 74% chance of damaging wind over 30 yrs
- Air quality 2/10 Low 1 unhealthy d/yr today · 2 by 30 yrs out
Nearby sold comps map
Loading sold comps map…
Walkable amenities ~0.75 mi
Loading nearby amenities…
Taxation est. · year 1
- Rental income
- $20,467
- − Mortgage interest
- −$9,523
- − Property taxes
- −$756
- − Insurance
- −$850
- − Repairs & maintenance
- −$1,637
- − Management
- −$1,637
- − Depreciation
- −$4,945
- Taxable income
- $1,118
- Est. tax owed @ 24.0%
- −$268
- After-tax cash flow
- $3,597/yr
For passive investors: Depreciation is non-cash, so a rental often shows a tax loss while cash-flowing — sheltering income. Rental losses are passive: they offset passive income freely, and up to $25,000/yr can offset ordinary (W-2) income if you actively participate and your MAGI is under $100k (phasing out to $0 by $150k); unused losses carry forward. On sale, claimed depreciation is recaptured at up to 25%, and gains may owe capital-gains tax (a 1031 exchange can defer both). Figures are a year-1 estimate at your 24.0% rate — not tax advice; consult a CPA.
Schools (NCES district)
- District
- Kershaw 01
- NCES district ID
- 4502550
- Math proficiency
- 38% ▼ -7.00%
- Reading proficiency
- 51% ▲ 6.00%
- Median HH income
- $44,585
- Composite
- 37.66/100
- National rank
- #4371
- State rank
- #25 of 80 in SC
Livability — Camden
- Score
- 61/100
- State rank
- #218
- US rank
- #18355
Category grades
Schools grade is shown separately in the Schools card above.
Census & demographics
- Population (ZIP)
- 22,868
Population outlook (Kershaw County) Hauer SSP2
- Today (2025)
- 67,683 people
- By 2030
- 69,374 · +2.5%
- By 2040
- 71,936 · +6.3%
- By 2050
- 73,292 · +8.3%
- By 2075
- 75,762 · +11.9%
- By 2100
- 72,620 · +7.3%
Race, ethnicity, and origin ACS 2023
- Neighborhood character
- Majority White (62%)
- Race & ethnicity
- White 62% Black 28% Hispanic / Latino 6% Two or more races 3%
- Hispanic origin (detail)
- Mexican 5%
- Common ancestry
- Serbian 2% Slovak 2% Italian 1%
- Foreign-born
- 4% · Canada
- Languages at home
- 93% English-only · Spanish 6%
Political lean MEDSL · Kershaw
- 2024 margin
- Strong R (+28.2) · D 35.3% · R 63.5% · Other 1.2%
- 2008→2024 swing
- -9.5pp toward R · 2008: -18.7pp · 2024: -28.2pp
- All cycles
- 2024: R+28.2 2020: R+23.1 2016: R+24.8 2012: R+18.6 2008: R+18.7
Not yet ingested
- Civics
- —
Market trends
- HPI YoY
- ▼ -95.81%
- Current HPI
- 227.0389
- Rent YoY
- —
- Metro
- —
- State GDP YoY
- ▲ 4.51%
- F500 in state
- 2
Industry mix (Fortune 500 HQ in SC)
| Industry | F500 HQs | Revenue |
|---|---|---|
| Packaging | 1 | $7B |
|
||
Price history
+183.8% since first listed4 events — show timeline
- 2026-05-02 Listed $170,000 Consolidated MLS
- 2025-08-18 Listed $120,000 Consolidated MLS
- 2004-05-20 Sold (Public Records) $63,000 Public Records
- 2002-07-19 Sold (Public Records) $59,900 Public Records
Property tax history
+24.8%/yrLatest (2025): $756 · +7.4% YoY. Source: county tax records.
Cash-flow waterfall
monthlySold comps — $/sqft
last 12 mo · ≤1 miLoading sold comps…