 5-Plex
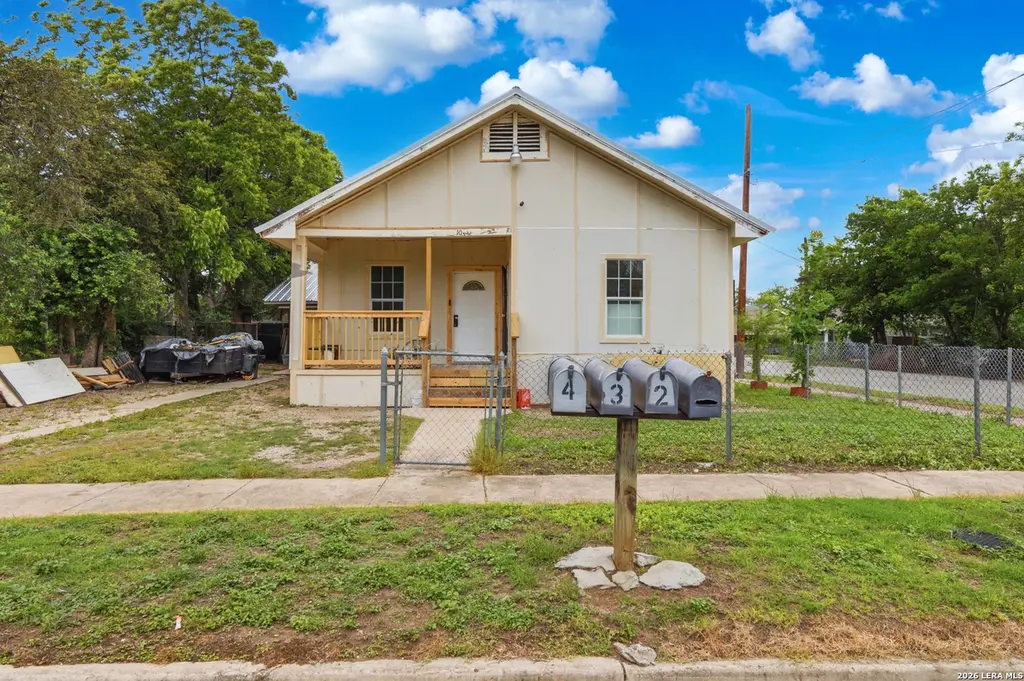
1021 Center St · San Antonio, TX
Flood risk 1/10 · Minimal
- FEMA flood zone
- X (unshaded)
- Chance of flooding over 30 yrs
- 0.0%
- Est. flood insurance / yr
- $507 – $1,088
Fire risk 1/10 · Minimal
- Est. fire insurance / yr
- $1,222 – $2,270
Heat risk 8/10 · Major
- Hot days now (above 108°F)
- 6 days/yr
- Hot days in 30 yrs
- 19 days/yr
Wind risk 8/10 · Major
- Chance of severe wind over 30 yrs
- 80.0%
Air-quality risk 2/10 · Minimal
- Unhealthy air days now
- 1 days/yr
- Unhealthy air days in 30 yrs
- 2 days/yr
Risk factors via First Street. Map © Google.
Why this score? — see what drove the B+ grade
The composite is a weighted blend of 9 inputs, each scored 0–100. Each bar is that input's sub-score; the figure is the points it added to the 100-point composite (weight × sub-score).
- Cash flow +30.0/30.0
- 1% rule +10.0/10.0
- DSCR +10.0/10.0
- Appreciation +10.0/10.0
- ARV discount +4.5/15.0
- Rent growth +4.5/5.0
- Livability +4.0/5.0
- Condition / age +2.2/5.0
- Schools +1.4/10.0
$395,000
🖨 Deal sheet 📄 Offer letter ✓ Due diligence
Multi-family units
County records classify this as Multi-Family (2-4 Unit). Listing-text estimate: 5 units. estimate disagrees with records
Listing remarks MLS
ncome producing five unit multifamily opportunity just minutes from downtown San Antonio. This property offers a mix of updated interiors, functional layouts, and strong long term investment potential in one of the city's growing east side corridors. Several units feature refreshed finishes including updated flooring, textured walls, and modern touches throughout, while offering flexibility for investors or owner occupants alike. The property includes a variety of living spaces with practical kitchen layouts, laundry connections in select units, and off street parking options. With multiple income producing units and additional rental potential, this property is well suited for buyers looking to expand their portfolio, generate cash flow, or take advantage of house hacking opportunities. Conveniently located near The Pearl, Frost Bank Center, St. Philip's College, downtown San Antonio, and major highways including I 35 and I 10, residents enjoy quick access to restaurants, entertainment, shopping, and major employers throughout the city. Whether you are seeking immediate rental income or long term upside in an area seeing continued growth and redevelopment, this multifamily property offers versatility and opportunity.
Key facts
- Open living spaces
- Private bedrooms
- Updated interiors
Tags
Neighborhood map
What this means for you Summary
Snapshot
- This is a 5 × 6-bed/6.0-bath units multifamily listed at $395k. Condition is rated fair.
Deal economics
- At list price, monthly cash flow is $3k ($40k/yr) — positive. Per door: $668/mo.
- The deal already cash-flows at list — no discount required.
- Meets the 1% rule at list price ($8k rent vs $395k).
- Recommended offer: $383k (3.0% below list) — sets the bar for market timing.
- Cap rate 16.4% vs local median 3.8% in San Antonio — top-decile yield for the area; either an underpriced asset or a hidden risk that comps aren't pricing in. Stress-test before assuming the spread holds.
Location & tenants
- Location reads 80/100 on livability (#31 in TX, #1,616 nationally) — a professional / high-income tenant draw. Strengths: amenities A+, commute A+, cost of living A+; Watch: schools C-, crime F.
- San Antonio ISD (urban): math 12% / reading 22% proficiency, ranked #805 of 826 in TX (top 98%) — low school quality limits family demand, transient renter base, plan for 1-2y turnover; 80% free/reduced lunch — lower-income household profile, screen leases tightly.
- Market conditions: Rents rising fast (+8.2%/yr); 196 active listings in the ZIP; 8,308 units permitted in Bexar County in 2024 (2,506 in 5+ unit buildings).
- At $7,682/mo this rent would consume 194% of the median local household income ($47k/yr) (locally 543% of renters already pay >50% of income on rent) — very limited rent-growth headroom before tenants either downsize or default.
Forward outlook
- In year one you build about $42k of equity ($3k loan paydown + $40k appreciation (10.0% local appreciation)).
- Bexar County population projected at +50% by 2050 — long-run rental-demand tailwind backs the buy-and-hold thesis.
- At projected returns (10.0% appreciation + 8.0% rent growth), your $111k cash investment doubles in ~2 years — after that, you're playing with house money.
- By year 2, paydown + projected appreciation supports a ~$68k cash-out refi (75% LTV) — recoverable capital for the next deal without selling this one.
Negotiation context
- It's been on market 41 days — a 3% lower offer ($383k) is reasonable based on typical stale-listing flexibility.
- 4 sale attempts since 7y ago with the ask held roughly flat each time — persistent listings suggest the price (not the market) is what's stuck; bring a comps-based counter.
Risks & watch-outs
- Watch-outs: built in 1949 — expect roof / HVAC / electrical / plumbing capex.
- Climate carrying-cost: severe wind risk, 80% chance of damaging wind over 30y; extreme-heat days projected 6→19/yr by 2055 (HVAC capex compounding) — expect insurance premiums to compound above CPI over the hold.
Questions for the listing agent
- It's been on market 41 days. Have you received any prior offers? Is the seller open to a 3% concession, seller financing, or rate buy-down credit?
- Can we see the unit-by-unit rent roll, current vacancy, and any below-market leases? What's the average tenancy length?
- What capital expenditures (roof, boiler, parking lot, exteriors) have been made in the last 5 years, and what's planned in the next 2?
- Have any recent inspections been done? Can we get a copy of the seller's disclosures and any deferred-maintenance estimates?
- Built in 1949 — when were the roof, HVAC, electrical panel, plumbing, and water heater last replaced?
- Is there a deadline driving the sale (1031 exchange, divorce, estate, relocation)? That informs how much negotiation room exists.
- Crime grade is F in this area — have there been break-ins, vandalism, or insurance claims at this property in the last 3 years? What carrier currently insures it and at what premium?
- What's the average days-on-market for RENTAL listings here right now (not sales)? A rising rental-DOM trend means longer vacancies and softer asking-rent achievability than the comps imply.
- What's the recent tenant-quality profile in this submarket — average credit score on applications, eviction rate, late-payment / NSF rate, and stable-employment percentage? A property-management company in the area should have these aggregated.
- How much new apartment / multifamily construction is in the pipeline within 1–3 miles? Heavy new supply (>2% of stock underway) typically softens rents 12–24 months out; light construction supports rent growth.
Investment metrics
- 1% rule
- 1.94% ✓
- Cap rate
- 16.44%
- Cash-on-cash
- 36.23%
- DSCR
- 2.61
- GRM
- 4.3
CMA / ARV
- ARV (median comp)
- $370,490
- List price
- $395,000
- Delta
- 6.62%
- Verdict
- FAIR
- Comps
- 19 within 1.0 mi
Projected returns pro-forma
10.0% appreciation · 8.0% rent growth · sell at horizon
- IRR
- 55.5%
- Equity multiple
- 5.24×
- Total profit
- $468,505
- Equity at exit
- $355,847
- IRR
- 51.1%
- Equity multiple
- 12.87×
- Total profit
- $1,313,238
- Equity at exit
- $767,398
Cash invested: $110,600 (down + closing). Projections, not guarantees.
Landlord ↔ Tenant lean methodology
- Overall (STATE)
- 87 Strongly Landlord-Friendly
- State Texas
- 87 Strongly Landlord-Friendly · R+5
- County
- — inherits STATE
- City
- — inherits STATE
ZIP-level market 78202
- Home prices YoY
- 27.0%
- Rents YoY
- 8.2%
- Active inventory
- 196
- Price-to-rent
- 21.4×
Monthly cashflow live
- Estimated rent
- $7,682 medium interval (Pro) →
- Mortgage (P&I)
- −$2,071
- Tax est. 1.5%
- −$494 /mo · $5,925/yr
- Insurance
- −$165
- HOA
- −$0
- Vacancy / Maint / Mgmt
- −$1,613
- Net cashflow
- $3,339
Break-even live
5-unit breakdown (identical units grouped — click to expand)
| Units | Beds | Baths | Est. rent |
|---|---|---|---|
| 5× units | 6 | 6 | $7,680 |
| #1 | 6 | 6 | $1,536 |
| #2 | 6 | 6 | $1,536 |
| #3 | 6 | 6 | $1,536 |
| #4 | 6 | 6 | $1,536 |
| #5 | 6 | 6 | $1,536 |
| Total (5 units) | $7,682 | ||
UW: 25.0% down · 7.5% · 30yr · 1.5% tax · 5.0% vac · 8.0% maint · 8.0% mgmt
Financing live
Cash to close
- Down payment
- $98,750
- Closing costs
- $11,850
- Reserves months
- —
- Total cash needed
- —
Loan-product check · same deal, 3 products live
Conventional
25% down · 7.5% · 30yr
- Down + closing
- —
- Monthly P&I
- —
- Monthly cashflow
- —
- DSCR
- —
- Eligible?
- —
Personal DTI + credit; lowest rate.
DSCR
20% down · 8.5% · 30yr
- Down + closing
- —
- Monthly P&I
- —
- Monthly cashflow
- —
- DSCR
- —
- Eligible?
- —
No personal income docs; deal must DSCR.
Hard money
10% down · 12.0% · 12mo
- Down + closing
- —
- Monthly P&I
- —
- Monthly cashflow
- —
- DSCR
- —
- Eligible?
- —
Short-term bridge; refi at stabilization.
Listing history 24 events
-
2026-06-18days on market $395,000 Active 41 DOM
-
2026-06-17days on market $395,000 Active 40 DOM
-
2026-06-16days on market $395,000 Active 39 DOM
-
2026-06-15days on market $395,000 Active 38 DOM
-
2026-06-13days on market $395,000 Active 36 DOM
-
2026-06-09days on market $395,000 Active 32 DOM
-
2026-06-08days on market $395,000 Active 31 DOM
-
2026-06-07days on market $395,000 Active 30 DOM
-
2026-06-04days on market $395,000 Active 27 DOM
-
2026-06-03days on market $395,000 Active 26 DOM
-
2026-06-02days on market $395,000 Active 25 DOM
-
2026-06-01days on market $395,000 Active 24 DOM
-
2026-05-31days on market $395,000 Active 23 DOM
-
2026-05-08$395,000 New 1239-char remark
Show marketing remark (1239 chars)
ncome producing five unit multifamily opportunity just minutes from downtown San Antonio. This property offers a mix of updated interiors, functional layouts, and strong long term investment potential in one of the city's growing east side corridors. Several units feature refreshed finishes including updated flooring, textured walls, and modern touches throughout, while offering flexibility for investors or owner occupants alike. The property includes a variety of living spaces with practical kitchen layouts, laundry connections in select units, and off street parking options. With multiple income producing units and additional rental potential, this property is well suited for buyers looking to expand their portfolio, generate cash flow, or take advantage of house hacking opportunities. Conveniently located near The Pearl, Frost Bank Center, St. Philip's College, downtown San Antonio, and major highways including I 35 and I 10, residents enjoy quick access to restaurants, entertainment, shopping, and major employers throughout the city. Whether you are seeking immediate rental income or long term upside in an area seeing continued growth and redevelopment, this multifamily property offers versatility and opportunity.
-
2023-12-17historical
-
2023-09-20price $245,000
-
2023-05-25price $250,000
-
2023-04-25$270,000 New
-
2021-01-22historical
-
2020-05-14$274,900 New
-
2019-11-28historical
-
2019-09-09price $269,000
-
2019-07-14price $275,000
-
2019-05-22$299,900 New
ⓘ Source: listings_history table (triggers on properties + properties_extension) + one-shot
backfill from property_details.listing_events for pre-trigger history.
Climate risk First Street
- Flood 1/10 Low FEMA zone X (unshaded) · 0% chance over 30 yrs
- Wildfire 1/10 Low
- Heat 8/10 Severe 6 d/yr ≥108°F today · 19 d/yr by 30 yrs out
- Wind 8/10 Severe 80% chance of damaging wind over 30 yrs
- Air quality 2/10 Low 1 unhealthy d/yr today · 2 by 30 yrs out
Nearby sold comps map
Loading sold comps map…
Walkable amenities ~0.75 mi
Loading nearby amenities…
Taxation est. · year 1
- Rental income
- $92,184
- − Mortgage interest
- −$22,126
- − Property taxes
- −$5,925
- − Insurance
- −$1,975
- − Repairs & maintenance
- −$7,375
- − Management
- −$7,375
- − Depreciation
- −$11,491
- Taxable income
- $35,918
- Est. tax owed @ 24.0%
- −$8,620
- After-tax cash flow
- $31,448/yr
For passive investors: Depreciation is non-cash, so a rental often shows a tax loss while cash-flowing — sheltering income. Rental losses are passive: they offset passive income freely, and up to $25,000/yr can offset ordinary (W-2) income if you actively participate and your MAGI is under $100k (phasing out to $0 by $150k); unused losses carry forward. On sale, claimed depreciation is recaptured at up to 25%, and gains may owe capital-gains tax (a 1031 exchange can defer both). Figures are a year-1 estimate at your 24.0% rate — not tax advice; consult a CPA.
Condition & rehab AI · 12 photos
This property requires moderate renovations to update the kitchen and bathrooms, paint the exterior, and improve the landscaping. These updates will significantly enhance its resale and rental value.
Repairs flagged
- Moderate kitchen cabinets — dated and in need of replacement
- Moderate bathroom fixtures — dated and in need of replacement
- Moderate exterior paint — needs repainting
- Moderate landscaping — needs trimming and planting
Value-add opportunities
- Resale new kitchen cabinets and countertops — modernizes the kitchen and improves aesthetics
- Resale new bathroom fixtures — modernizes the bathrooms and improves aesthetics
- Both exterior paint — enhances curb appeal and property value
- Both landscaping — enhances curb appeal and property value
Renovation cost estimate screening
| Repair item | Severity | Est. cost |
|---|---|---|
| kitchen cabinets · dated and in need of replacement | Moderate | $3,000–15,000 |
| bathroom fixtures · dated and in need of replacement | Moderate | $3,000–15,000 |
| exterior paint · needs repainting | Moderate | $3,000–15,000 |
| landscaping · needs trimming and planting | Moderate | $3,000–15,000 |
| Total estimated repair cost · 4 items | $12,000–60,000 |
Value-add ROI direction
- Resale new kitchen cabinets and countertops — modernizes the kitchen and improves aesthetics ↑
- Resale new bathroom fixtures — modernizes the bathrooms and improves aesthetics ↑
- Both exterior paint — enhances curb appeal and property value ↑
- Both landscaping — enhances curb appeal and property value ↑
ⓘ Cost ranges are severity-bucket heuristics (US national rule-of-thumb). Get contractor quotes + a written scope before underwriting a rehab budget.
Schools (NCES district)
- District
- San Antonio ISD
- NCES district ID
- 4838730
- Math proficiency
- 12% ▼ -21.00%
- Reading proficiency
- 22% ▼ -7.00%
- Median HH income
- $30,952
- Composite
- 13.57/100
- National rank
- #9512
- State rank
- #805 of 826 in TX
Livability — San Antonio
- Score
- 80/100
- State rank
- #31
- US rank
- #1616
Category grades
Schools grade is shown separately in the Schools card above.
Census & demographics
- Census place
- San Antonio, TX
- County
- Bexar County · 1,990,555 people
- City population
- 1,806,925
- Metro
- San Antonio-New Braunfels, TX
- Population (ZIP)
- 10,224
- Household income
- $47,478
- Rent vs Own
- Severe rent burden
- 543.0
Population outlook (Bexar County) Hauer SSP2
- Today (2025)
- 2,336,851 people
- By 2030
- 2,560,728 · +9.6%
- By 2040
- 3,020,569 · +29.3%
- By 2050
- 3,493,522 · +49.5%
- By 2075
- 4,668,459 · +99.8%
- By 2100
- 5,533,242 · +136.8%
Race, ethnicity, and origin ACS 2023
- Neighborhood character
- Predominantly Hispanic (66%)
- Race & ethnicity
- Hispanic / Latino 66% Two or more races 28% White 17% Black 16% Native American 1%
- Hispanic origin (detail)
- Mexican 57% Puerto Rican 1% Cuban 1%
- Common ancestry
- Italian 2% Slovak 1%
- Foreign-born
- 14% · Canada
- Languages at home
- 59% English-only · Spanish 41%
Political lean MEDSL · Bexar
- 2024 margin
- Lean D (+9.8) · D 54.3% · R 44.6% · Other 1.1%
- 2008→2024 swing
- +4.2pp toward D · 2008: 5.6pp · 2024: 9.8pp
- All cycles
- 2024: D+9.8 2020: D+18.2 2016: D+13.5 2012: D+4.6 2008: D+5.6
Not yet ingested
- Civics
- —
Market trends
- HPI YoY
- ▲ 53.82%
- Current HPI
- 253.3196
- Rent YoY
- ▲ 8.20%
- Metro
- San Antonio-New Braunfels, TX
- State GDP YoY
- ▲ 3.95%
- F500 in state
- 110
Industry mix (Fortune 500 HQ in TX)
| Industry | F500 HQs | Revenue |
|---|---|---|
| Energy | 16 | $1,198B |
|
||
| Technology | 5 | $198B |
|
||
| Engineering / Construction | 4 | $72B |
|
||
| Energy Services | 3 | $60B |
|
||
| Utilities | 3 | $41B |
|
||
| Healthcare | 2 | $330B |
|
||
Price history
+31.7% since first listed11 events — show timeline
- 2026-05-08 Listed $395,000 LERA
- 2023-12-17 Listing Removed — LERA
- 2023-09-20 Price Changed $245,000 LERA
- 2023-05-25 Price Changed $250,000 LERA
- 2023-04-25 Listed $270,000 LERA
- 2021-01-22 Listing Removed — LERA
- 2020-05-14 Listed $274,900 LERA
- 2019-11-28 Listing Removed — LERA
- 2019-09-09 Price Changed $269,000 LERA
- 2019-07-14 Price Changed $275,000 LERA
- 2019-05-22 Listed $299,900 LERA
Cash-flow waterfall
monthlySold comps — $/sqft
last 12 mo · ≤1 miLoading sold comps…