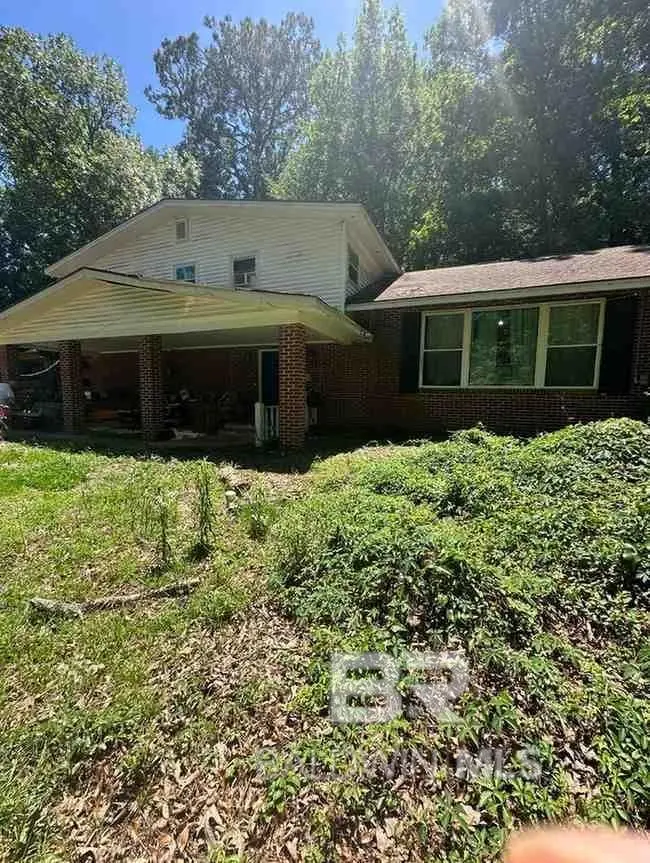
118 Spanish Main · Spanish Fort, AL
Flood risk 1/10 · Minimal
- FEMA flood zone
- X (unshaded)
- Chance of flooding over 30 yrs
- 0.0%
- Est. flood insurance / yr
- $507 – $1,088
Fire risk 3/10 · Minor
- Est. fire insurance / yr
- $916 – $1,700
Heat risk 9/10 · Severe
- Hot days now (above 107°F)
- 7 days/yr
- Hot days in 30 yrs
- 21 days/yr
Wind risk 9/10 · Severe
- Chance of severe wind over 30 yrs
- 99.0%
Air-quality risk 3/10 · Minor
- Unhealthy air days now
- 3 days/yr
- Unhealthy air days in 30 yrs
- 4 days/yr
Risk factors via First Street. Map © Google.
Why this score? — see what drove the C- grade
The composite is a weighted blend of 9 inputs, each scored 0–100. Each bar is that input's sub-score; the figure is the points it added to the 100-point composite (weight × sub-score).
- Cash flow +19.2/30.0
- ARV discount +7.5/15.0
- DSCR +6.1/10.0
- 1% rule +4.3/10.0
- Rent growth +4.1/5.0
- Schools +3.9/10.0
- Livability +3.7/5.0
- Condition / age +2.5/5.0
- Appreciation +0.0/10.0
$212,000
🖨 Deal sheet 📄 Offer letter ✓ Due diligence
Listing remarks MLS
Welcome to 118 Spanish Main in the sought after Spanish fort area. This large Home offers over 2600 square feet with 3 beds and 2 1/2 baths. The Home is a tri level plan with plenty of space for a growing family. The master bedroom has recently been updated and a very nice master suite bathroom added. The master bath has double sinks, separate tile shower, and large tub. The Home sits on a very spacious lot with gorgeous oak trees and even has a pool with pool house. The pool house needs renovation but couple be the ultimate man cover, inlaws suite or store building. Call today to come view.
Key facts
- Countertop space
- Large kitchen
- Eat-at bar
Tags
Property features AI
Finance
- Other: Tax annual amount available
- HOA & community: No transfer fees; Community features listed as 'Other'
Exterior
- Parking: Double carport (2 covered/carport spaces)
- Utilities: Utilities: see remarks
- Home design: Two levels; Resale property
- Construction: Brick and other construction materials; Foundation: Other; Roof: see remarks; Building area: 2724 (source: assessor)
- Exterior features: Lot features: see remarks; No waterfront; Whole/full ownership
Interior
- Flooring: Other flooring (see remarks)
- Bathrooms: 2 full bathrooms
- Heating & cooling: Heating present (type listed as Other); Utilities: see remarks
- Interior features: No fireplace; Appliances listed as 'Other'; Other flooring (see remarks)
Neighborhood map
What this means for you Summary
Snapshot
- This is a 3-bed/2.0-bath single-family listed at $212k.
Deal economics
- At list price, monthly cash flow is $228 ($3k/yr) — positive.
- The deal already cash-flows at list — no discount required.
- To meet the 1% rule (rent ≥ 1% of price), the offer needs to be $198k (6.7% below list).
- Recommended offer: $198k (6.7% below list) — sets the bar for 1% rule.
- Cap rate 7.6% vs local median 3.5% in Spanish Fort — top-decile yield for the area; either an underpriced asset or a hidden risk that comps aren't pricing in. Stress-test before assuming the spread holds.
Location & tenants
- Location reads 73/100 on livability (#26 in AL) — a middle-class / working-renter tenant base. Strengths: employment A+, housing A+, crime A; Watch: amenities F, commute F, health & safety D-.
- Baldwin County (rural): math 33% / reading 57% proficiency, ranked #18 of 129 in AL (top 14%) — families likely to look elsewhere, expect single-tenant / working-renter base with shorter leases.
- Zoned schools: Spanish Fort Elementary School (math 61% / reading 79%, grade A-, #26 of 627 statewide, top 4%, 763 students, 31% FRL); Spanish Fort Middle School (math 38% / reading 70%, grade B-, #20 of 257 statewide, top 8%, 622 students, 28% FRL); Spanish Fort High School (math 44% / reading 44%, grade F, #25 of 305 statewide, top 8%, 1,188 students, 24% FRL).
- Market conditions: Rents rising fast (+6.5%/yr); 331 active listings in the ZIP; high-income renter base; 3,883 units permitted in Baldwin County in 2024 (481 in 5+ unit buildings).
Forward outlook
- Local home prices are declining (-3.0%/yr); year-one equity from $1k of loan paydown is wiped out by about $6k of value loss. Plan a longer hold.
- Baldwin County population projected at +42% by 2050 — long-run rental-demand tailwind backs the buy-and-hold thesis.
Negotiation context
- Only 9 days on market — expect competitive offers; lowballing is unlikely to land.
- 4 sale attempts since 9y ago; this cycle's ask is 6% above the opening price — seller raised mid-cycle; expect resistance to lowballs.
Risks & watch-outs
- Watch-outs: built in 1959 — expect roof / HVAC / electrical / plumbing capex.
- Climate carrying-cost: severe wind risk, 99% chance of damaging wind over 30y; extreme-heat days projected 7→21/yr by 2055 (HVAC capex compounding) — expect insurance premiums to compound above CPI over the hold.
Questions for the listing agent
- Built in 1959 — when were the roof, HVAC, electrical panel, plumbing, and water heater last replaced?
- Is there a deadline driving the sale (1031 exchange, divorce, estate, relocation)? That informs how much negotiation room exists.
- Schools are A-rated — typically a magnet for longer-tenancy family renters. What's the average tenant stay here, and is there a school-zone premium baked into asking?
- What's the average days-on-market for RENTAL listings here right now (not sales)? A rising rental-DOM trend means longer vacancies and softer asking-rent achievability than the comps imply.
- What's the recent tenant-quality profile in this submarket — average credit score on applications, eviction rate, late-payment / NSF rate, and stable-employment percentage? A property-management company in the area should have these aggregated.
- How much new for-sale + rental construction is in the pipeline within 1–3 miles? Heavy new supply typically softens prices + rents 12–24 months out; constrained supply supports both.
Investment metrics
- 1% rule
- 0.93% ✗
- Cap rate
- 7.58%
- Cash-on-cash
- 4.61%
- DSCR
- 1.21
- GRM
- 8.9
CMA / ARV
- ARV (on-the-fly)
- $441,496
- Comps found
- 8
Show comp detail 8 sales within ~0.75 mi
| Address | Dist | Beds/Ba | Sqft | Sold | Price | $/sf | Match |
|---|---|---|---|---|---|---|---|
| 10 Caisson Trce | 0.26mi | 3/2.5 | 2,690 (+5%) | 4mo | $365,000 | $136 | 74 |
| 201 Confederate Dr | 0.16mi | 3/2.0 | 2,185 (-14%) | 5mo | $377,000 | $173 | 64 |
| 18 Lee Cir | 0.20mi | 3/2.0 | 2,169 (-15%) | 3mo | $265,500 | $122 | 63 |
| 30982 Parapet Ct | 0.63mi | 4/2.5 (+1) | 2,477 (-3%) | 2mo | $665,000 | $268 | 56 |
| 204 Patrician Dr | 0.47mi | 3/2.0 | 2,464 (-3%) | 23mo | $375,000 | $152 | 53 |
| 312 Patrician Dr | 0.69mi | 3/2.5 | 2,665 (+4%) | 17mo | $937,500 | $352 | 44 |
| 40 Caisson Trce | 0.47mi | 3/2.0 | 2,200 (-14%) | 21mo | $350,000 | $159 | 37 |
| 29 Signal Hill Rd | 0.56mi | 4/3.0 (+1) | 2,305 (-10%) | 20mo | $524,900 | $228 | 32 |
Match score weights: distance 35% · size 25% · config 20% · recency 20%. Top-matched comps best support the ARV.
Projected returns pro-forma
-3.0% appreciation · 6.52% rent growth · sell at horizon
- IRR
- -5.5%
- Equity multiple
- 0.79×
- Total profit
- $-12,625
- Equity at exit
- $31,610
- IRR
- 7.7%
- Equity multiple
- 1.67×
- Total profit
- $39,511
- Equity at exit
- $18,330
Cash invested: $59,360 (down + closing). Projections, not guarantees.
Landlord ↔ Tenant lean methodology
- Overall (STATE)
- 90 Strongly Landlord-Friendly
- State Alabama
- 90 Strongly Landlord-Friendly · R+15
- County
- — inherits STATE
- City
- — inherits STATE
ZIP-level market 36527
- Home prices YoY
- -14.4%
- Rents YoY
- 6.5%
- Active inventory
- 331
- Price-to-rent
- 8.9×
Monthly cashflow live
- Estimated rent
- $1,978 medium interval (Pro) →
- Mortgage (P&I)
- −$1,112
- Tax from tax record
- −$135 /mo · $1,618/yr
- Insurance
- −$88
- HOA
- −$0
- Vacancy / Maint / Mgmt
- −$415
- Net cashflow
- $228
Break-even live
UW: 25.0% down · 7.5% · 30yr · 1.5% tax · 5.0% vac · 8.0% maint · 8.0% mgmt
Financing live
Cash to close
- Down payment
- $53,000
- Closing costs
- $6,360
- Reserves months
- —
- Total cash needed
- —
Loan-product check · same deal, 3 products live
Conventional
25% down · 7.5% · 30yr
- Down + closing
- —
- Monthly P&I
- —
- Monthly cashflow
- —
- DSCR
- —
- Eligible?
- —
Personal DTI + credit; lowest rate.
DSCR
20% down · 8.5% · 30yr
- Down + closing
- —
- Monthly P&I
- —
- Monthly cashflow
- —
- DSCR
- —
- Eligible?
- —
No personal income docs; deal must DSCR.
Hard money
10% down · 12.0% · 12mo
- Down + closing
- —
- Monthly P&I
- —
- Monthly cashflow
- —
- DSCR
- —
- Eligible?
- —
Short-term bridge; refi at stabilization.
Listing history 8 events
-
2026-06-14statusdays on market $212,000 Pending 9 DOM
-
2026-06-13days on market $212,000 Active 8 DOM
-
2026-06-10days on market $212,000 Active 6 DOM
-
2026-06-09days on market $212,000 Active 5 DOM
-
2026-06-08days on market $212,000 Active 4 DOM
-
2026-06-07pricedays on market $212,000 Active 3 DOM
-
2026-06-05remarks 681-char remark
-
2026-06-05$199,900 Active 1 DOM
ⓘ Source: listings_history table (triggers on properties + properties_extension) + one-shot
backfill from property_details.listing_events for pre-trigger history.
Tax reassessment forecast AL · Resets to sale price
- Current annual tax
- $1,618 · $135/mo
- Projected year-2 tax
- $1,618 · $135/mo
- Expected delta
- $0/yr ($0/mo · 0.0%)
ⓘ Screening estimate from a state-policy table — verify with the county assessor before closing.
Climate risk First Street
- Flood 1/10 Low FEMA zone X (unshaded) · 0% chance over 30 yrs
- Wildfire 3/10 Moderate
- Heat 9/10 Extreme 7 d/yr ≥107°F today · 21 d/yr by 30 yrs out
- Wind 9/10 Extreme 99% chance of damaging wind over 30 yrs
- Air quality 3/10 Moderate 3 unhealthy d/yr today · 4 by 30 yrs out
Nearby sold comps map
Loading sold comps map…
Walkable amenities ~0.75 mi
Loading nearby amenities…
Taxation est. · year 1
- Rental income
- $23,741
- − Mortgage interest
- −$11,875
- − Property taxes
- −$1,618
- − Insurance
- −$1,060
- − Repairs & maintenance
- −$1,899
- − Management
- −$1,899
- − Depreciation
- −$6,167
- Taxable loss
- −$778
- Est. tax savings @ 24.0%
- +$187
- After-tax cash flow
- $2,923/yr
For passive investors: Depreciation is non-cash, so a rental often shows a tax loss while cash-flowing — sheltering income. Rental losses are passive: they offset passive income freely, and up to $25,000/yr can offset ordinary (W-2) income if you actively participate and your MAGI is under $100k (phasing out to $0 by $150k); unused losses carry forward. On sale, claimed depreciation is recaptured at up to 25%, and gains may owe capital-gains tax (a 1031 exchange can defer both). Figures are a year-1 estimate at your 24.0% rate — not tax advice; consult a CPA.
Schools (NCES district)
- District
- Baldwin County
- NCES district ID
- 0100270
- Math proficiency
- 33% ▼ -26.00%
- Reading proficiency
- 57% ▲ 1.00%
- Median HH income
- $50,677
- Composite
- 38.61/100
- National rank
- #4157
- State rank
- #18 of 129 in AL
Livability — Spanish Fort
- Score
- 73/100
- State rank
- #26
- US rank
- #5408
Category grades
Schools grade is shown separately in the Schools card above.
Census & demographics
- Census place
- Spanish Fort, AL
- County
- Baldwin County · 181,514 people
- City population
- 21,765
- Metro
- Daphne-Fairhope-Foley, AL
- Population (ZIP)
- 21,765
- Household income
- $120,189
- Rent vs Own
- Severe rent burden
- 378.0
Population outlook (Baldwin County) Hauer SSP2
- Today (2025)
- 248,264 people
- By 2030
- 270,315 · +8.9%
- By 2040
- 312,967 · +26.1%
- By 2050
- 352,262 · +41.9%
- By 2075
- 438,841 · +76.8%
- By 2100
- 487,736 · +96.5%
Race, ethnicity, and origin ACS 2023
- Neighborhood character
- Predominantly White (80%)
- Race & ethnicity
- White 80% Two or more races 8% Black 6% Hispanic / Latino 5% Asian 2%
- Hispanic origin (detail)
- Mexican 2%
- Common ancestry
- Lithuanian 4% Slovak 2% Serbian 2%
- Foreign-born
- 6% · Canada, Jamaica, South Korea
- Languages at home
- 95% English-only · Spanish 3%
Political lean MEDSL · Baldwin
- 2024 margin
- Solid R (+58.2) · D 20.5% · R 78.7%
- 2008→2024 swing
- -6.7pp toward R · 2008: -51.5pp · 2024: -58.2pp
- All cycles
- 2024: R+58.2 2020: R+53.8 2016: R+57.8 2012: R+55.8 2008: R+51.5
Not yet ingested
- Civics
- —
Market trends
- HPI YoY
- ▼ -39.56%
- Current HPI
- 234.5113
- Rent YoY
- ▲ 6.52%
- Metro
- Daphne-Fairhope-Foley, AL
- State GDP YoY
- ▲ 2.94%
- F500 in state
- 4
Industry mix (Fortune 500 HQ in AL)
| Industry | F500 HQs | Revenue |
|---|---|---|
| Financial Services | 1 | $8B |
|
||
| Healthcare | 1 | $5B |
|
||
Price history
+19.5% since first listed6 events — show timeline
- 2026-06-04 Listed $199,900 BCAR
- 2020-11-11 Listed $250,000 BCAR
- 2017-11-06 Sold (MLS) $194,000 BCAR
- 2017-09-13 Listed $199,900 BCAR
- 2017-01-14 Listed $199,900 BCAR
- 2009-10-26 Sold (Public Records) $167,278 Public Records
Property tax history
+11.1%/yrLatest (2025): $1,618 · +20.0% YoY. Source: county tax records.
Cash-flow waterfall
monthlySold comps — $/sqft
last 12 mo · ≤1 miLoading sold comps…