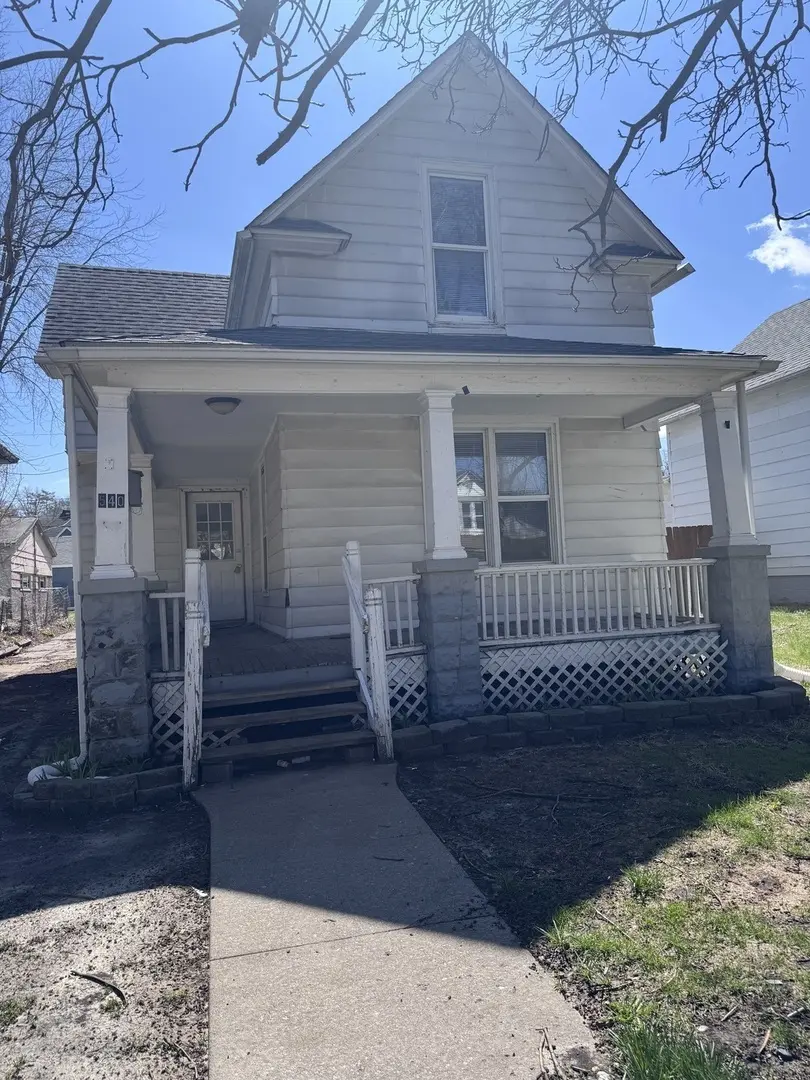
540 16th Ave · East Moline, IL
Flood risk 3/10 · Minor
- FEMA flood zone
- X (unshaded)
- Chance of flooding over 30 yrs
- 0.2%
- Est. flood insurance / yr
- $507 – $1,088
Fire risk 1/10 · Minimal
- Est. fire insurance / yr
- $804 – $1,492
Heat risk 3/10 · Minor
- Hot days now (above 104°F)
- 7 days/yr
- Hot days in 30 yrs
- 17 days/yr
Wind risk 2/10 · Minimal
- Chance of severe wind over 30 yrs
- —
Air-quality risk 3/10 · Minor
- Unhealthy air days now
- 2 days/yr
- Unhealthy air days in 30 yrs
- 3 days/yr
Risk factors via First Street. Map © Google.
Why this score? — see what drove the C grade
The composite is a weighted blend of 9 inputs, each scored 0–100. Each bar is that input's sub-score; the figure is the points it added to the 100-point composite (weight × sub-score).
- Cash flow +23.1/30.0
- 1% rule +8.7/10.0
- ARV discount +7.5/15.0
- DSCR +7.4/10.0
- Livability +3.1/5.0
- Rent growth +2.5/5.0
- Condition / age +2.5/5.0
- Schools +1.2/10.0
- Appreciation +0.0/10.0
$84,900
🖨 Deal sheet 📄 Offer letter ✓ Due diligence
Listing remarks
Charming 1.5-story home offering comfort, space, and great potential! This 3-bedroom property features the convenience of main-level lbathroom and laundry. The spacious kitchen provides ample room for cooking, gathering, and storage-perfect for everyday living or entertaining. Upstairs, you'll find additional living space with 3 bedrooms, 2nd bathroom. Front porch needs a little TLC and then it would be ready to enjoy relaxing mornings on the inviting front porch, and take advantage of the long driveway with plenty of off-street parking. The alley access provides an excellent opportunity to add a future garage. Recent updates include brand new carpet and flooring throughout, giving the hom
Key facts
- Alley access
- Main-level bathroom
- Spacious kitchen
Tags
Property features AI
Finance
- Other: Property not currently leased; Possession at closing
- HOA & community: No master association fee required
Exterior
- Parking: 6 parking spaces; Alley access; Owned parking
- Utilities: Public water; Public sewer
- Home design: Detached single-family home; 1.5-story design; Fee simple ownership; Built over 100 years ago; Listed as built before 1978
- Construction: Frame construction with aluminum siding
- Exterior features: Front porch; Level lot; Lot dimensions approximately 40 x 120; Lot size less than 0.25 acre
Interior
- Kitchen: Range; Refrigerator; Eating area / table space
- Bedrooms: Master bedroom (second level); Bedroom 2 (second level); Bedroom 3 (second level)
- Flooring: Carpet in living areas and bedrooms; Laminate in kitchen and laundry
- Bathrooms: 2 full bathrooms
- Heating & cooling: Forced air heating; Natural gas
- Interior features: 6 total rooms; Separate dining room; Unfinished full basement; School bus service
- Laundry & utility: Laundry located in bathroom
Neighborhood map
What this means for you Summary
Snapshot
- This is a 3-bed/2.0-bath other listed at $85k.
Deal economics
- At list price, monthly cash flow is $153 ($2k/yr) — positive.
- The deal already cash-flows at list — no discount required.
- Meets the 1% rule at list price ($1k rent vs $85k).
- Recommended offer: $82k (3.0% below list) — sets the bar for market timing.
- Cap rate 8.4% vs local median 3.5% in East Moline — top-decile yield for the area; either an underpriced asset or a hidden risk that comps aren't pricing in. Stress-test before assuming the spread holds.
Location & tenants
- Location reads 62/100 on livability (#870 in IL) — a middle-class / working-renter tenant base. Strengths: cost of living A+, housing A+; Watch: crime C-, employment C-, schools F.
- United Twp Hsd 30 (suburban): math 12% / reading 15% proficiency, ranked #536 of 620 in IL (top 86%) — low school quality limits family demand, transient renter base, plan for 1-2y turnover.
- Market conditions: 124 active listings in the ZIP; 8 comparable units currently listed for rent nearby; rentals at typical pace (median 21d on market — plan ~3-4 weeks tenant-placement turnaround); 116 units permitted in Rock Island County in 2024 (50 in 5+ unit buildings).
Forward outlook
- Local home prices are declining (-3.0%/yr); year-one equity from $587 of loan paydown is wiped out by about $3k of value loss. Plan a longer hold.
- Rock Island County population projected at -12% by 2050 — secular population decline; favor cash flow + early exit over multi-decade hold.
Negotiation context
- It's been on market 46 days — a 3% lower offer ($82k) is reasonable based on typical stale-listing flexibility.
- 10 sale attempts since 23y ago; this cycle's ask has dropped $5k (6%) from the opening price — seller is motivated, your offer sets the floor, not the list.
Risks & watch-outs
- Watch-outs: property tax is 4.0% of price; built in 1918 — expect roof / HVAC / electrical / plumbing capex.
Questions for the listing agent
- It's been on market 46 days. Have you received any prior offers? Is the seller open to a 3% concession, seller financing, or rate buy-down credit?
- Built in 1918 — when were the roof, HVAC, electrical panel, plumbing, and water heater last replaced?
- Property tax is high relative to price — has the assessment been appealed recently, and will the sale trigger a re-assessment?
- Is there a deadline driving the sale (1031 exchange, divorce, estate, relocation)? That informs how much negotiation room exists.
- Schools are F-rated, which usually means shorter tenancies and higher turnover. Who's the typical renter profile here, and what's been the actual vacancy rate?
- What's the average days-on-market for RENTAL listings here right now (not sales)? A rising rental-DOM trend means longer vacancies and softer asking-rent achievability than the comps imply.
- What's the recent tenant-quality profile in this submarket — average credit score on applications, eviction rate, late-payment / NSF rate, and stable-employment percentage? A property-management company in the area should have these aggregated.
- How much new for-sale + rental construction is in the pipeline within 1–3 miles? Heavy new supply typically softens prices + rents 12–24 months out; constrained supply supports both.
Investment metrics
- 1% rule
- 1.37% ✓
- Cap rate
- 8.45%
- Cash-on-cash
- 7.70%
- DSCR
- 1.34
- GRM
- 6.1
CMA / ARV
No comps found within radius.
Projected returns pro-forma
-3.0% appreciation · 3.0% rent growth · sell at horizon
- IRR
- -4.4%
- Equity multiple
- 0.84×
- Total profit
- $-3,917
- Equity at exit
- $12,659
- IRR
- 5.4%
- Equity multiple
- 1.40×
- Total profit
- $9,611
- Equity at exit
- $7,341
Cash invested: $23,772 (down + closing). Projections, not guarantees.
Landlord ↔ Tenant lean methodology
- Overall (STATE)
- 43 Moderately Tenant-Leaning
- State Illinois
- 43 Moderately Tenant-Leaning · D+7
- County
- — inherits STATE
- City
- — inherits STATE
ZIP-level market 61244
- Active inventory
- 124
- Price-to-rent
- 6.1×
Monthly cashflow live
- Estimated rent
- $1,159 high interval (Pro) →
- Mortgage (P&I)
- −$445
- Tax from tax record
- −$283 /mo · $3,394/yr
- Insurance
- −$35
- HOA
- −$0
- Vacancy / Maint / Mgmt
- −$243
- Net cashflow
- $153
Break-even live
UW: 25.0% down · 7.5% · 30yr · 1.5% tax · 5.0% vac · 8.0% maint · 8.0% mgmt
Financing live
Cash to close
- Down payment
- $21,225
- Closing costs
- $2,547
- Reserves months
- —
- Total cash needed
- —
Loan-product check · same deal, 3 products live
Conventional
25% down · 7.5% · 30yr
- Down + closing
- —
- Monthly P&I
- —
- Monthly cashflow
- —
- DSCR
- —
- Eligible?
- —
Personal DTI + credit; lowest rate.
DSCR
20% down · 8.5% · 30yr
- Down + closing
- —
- Monthly P&I
- —
- Monthly cashflow
- —
- DSCR
- —
- Eligible?
- —
No personal income docs; deal must DSCR.
Hard money
10% down · 12.0% · 12mo
- Down + closing
- —
- Monthly P&I
- —
- Monthly cashflow
- —
- DSCR
- —
- Eligible?
- —
Short-term bridge; refi at stabilization.
Rent comps 8 comps
| Address | Beds | Baths | Sqft | Rent | $/sqft | DOM | Units | Dist |
|---|---|---|---|---|---|---|---|---|
| 427 17th Ave East Moline, IL | 2.0 | 1.0 | 1186 | $1,100 | $0.93 | 13d | 1 | 0.17mi |
| 777 20th Ave Unit 1 East Moline, IL | 2.0 | 1.0 | 1030 | $1,090 | $1.06 | 21d | 1 | 0.33mi |
| 625 25th Ave Unit 625 East Moline, IL | 2.0 | 1.0 | 888 | $900 | $1.01 | 21d | 1 | 0.52mi |
| 171 15th Ave East Moline, IL | 3.0 | 1.0 | 1400 | $1,395 | $1.00 | 21d | 1 | 0.53mi |
| 801 Bend Blvd East Moline, IL | 2.0 | 1.0 | 600 | $1,599 | $2.67 | 13d | 1 | 0.66mi |
| 3341 5th St Unit 1 East Moline, IL | 2.0 | 1.0 | 850 | $1,300 | $1.53 | 21d | 1 | 1.12mi |
| 123 3rd St Unit House Silvis, IL | 2.0 | 1.0 | 1017 | $1,150 | $1.13 | 21d | 1 | 1.30mi |
| 1842 28th Ave East Moline, IL | 2.0 | 1.0 | 914 | $1,100 | $1.20 | 13d | 1 | 1.36mi |
Listing history 26 events
-
2026-05-30status $84,900 Pending 46 DOM
-
2026-05-24status Active
-
2026-05-23status Active
-
2026-05-08price $84,900
-
2026-04-13$89,900 Active
-
2026-01-21historical
-
2026-01-21historical
-
2026-01-08status Active
-
2026-01-06historical
-
2026-01-05historical
-
2025-08-29Active
-
2024-01-29historical $1,000
-
2024-01-18$1,000
-
2021-08-06historical
-
2021-08-06historical
-
2017-04-18soldstatus $92,600
-
2010-10-04soldstatus $53,500
-
2010-05-12soldstatus $25,500
-
2010-05-12soldstatus $25,500
-
2010-02-04$32,900
-
2010-02-04$32,900
-
2004-12-30soldstatus $64,500
-
2004-12-29soldstatus $64,425
-
2004-12-06$63,900
-
2004-04-15soldstatus $32,000
-
2003-12-16$42,500
ⓘ Source: listings_history table (triggers on properties + properties_extension) + one-shot
backfill from property_details.listing_events for pre-trigger history.
Tax reassessment forecast IL · Partial reset (capped growth)
- Current annual tax
- $3,394 · $283/mo
- Projected year-2 tax
- $3,394 · $283/mo
- Expected delta
- $0/yr ($0/mo · 0.0%)
ⓘ Screening estimate from a state-policy table — verify with the county assessor before closing.
Climate risk First Street
- Flood 3/10 Moderate FEMA zone X (unshaded) · 20% chance over 30 yrs
- Wildfire 1/10 Low
- Heat 3/10 Moderate 7 d/yr ≥104°F today · 17 d/yr by 30 yrs out
- Wind 2/10 Low
- Air quality 3/10 Moderate 2 unhealthy d/yr today · 3 by 30 yrs out
Nearby sold comps map
Loading sold comps map…
Walkable amenities ~0.75 mi
Loading nearby amenities…
Taxation est. · year 1
- Rental income
- $13,914
- − Mortgage interest
- −$4,756
- − Property taxes
- −$3,394
- − Insurance
- −$424
- − Repairs & maintenance
- −$1,113
- − Management
- −$1,113
- − Depreciation
- −$2,470
- Taxable income
- $643
- Est. tax owed @ 24.0%
- −$154
- After-tax cash flow
- $1,676/yr
For passive investors: Depreciation is non-cash, so a rental often shows a tax loss while cash-flowing — sheltering income. Rental losses are passive: they offset passive income freely, and up to $25,000/yr can offset ordinary (W-2) income if you actively participate and your MAGI is under $100k (phasing out to $0 by $150k); unused losses carry forward. On sale, claimed depreciation is recaptured at up to 25%, and gains may owe capital-gains tax (a 1031 exchange can defer both). Figures are a year-1 estimate at your 24.0% rate — not tax advice; consult a CPA.
Schools (NCES district)
- District
- United Twp Hsd 30
- NCES district ID
- 1739870
- Math proficiency
- 12% ▼ -5.00%
- Reading proficiency
- 15% ▼ -6.00%
- Median HH income
- $43,647
- Composite
- 11.91/100
- National rank
- #9670
- State rank
- #536 of 620 in IL
Livability — East Moline
- Score
- 62/100
- State rank
- #870
- US rank
- #16964
Category grades
Schools grade is shown separately in the Schools card above.
Census & demographics
- Census place
- East Moline, IL
- County
- Rock Island County · 103,822 people
- City population
- 23,308
- Metro
- Davenport-Moline-Rock Island, IA-IL
- Population (ZIP)
- 23,308
- Household income
- $63,819
- Rent vs Own
- Severe rent burden
- 746.0
Population outlook (Rock Island County) Hauer SSP2
- Today (2025)
- 140,982 people
- By 2030
- 137,705 · -2.3%
- By 2040
- 130,512 · -7.4%
- By 2050
- 123,841 · -12.2%
- By 2075
- 109,851 · -22.1%
- By 2100
- 90,922 · -35.5%
Race, ethnicity, and origin ACS 2023
- Neighborhood character
- Diverse neighborhood (Simpson 0.62)
- Race & ethnicity
- White 55% Hispanic / Latino 19% Black 18% Two or more races 9% Asian 3%
- Hispanic origin (detail)
- Mexican 17%
- Common ancestry
- English 3% Lithuanian 2% Romanian 2%
- Foreign-born
- 13% · Canada, United Kingdom, Philippines
- Languages at home
- 78% English-only · Spanish 12% French/Haitian/Cajun 3% Other Asian/Pacific 2%
Political lean MEDSL · Rock Island
- 2024 margin
- Lean D (+9.6) · D 53.9% · R 44.4% · Other 1.7%
- 2008→2024 swing
- -15.0pp toward R · 2008: 24.6pp · 2024: 9.6pp
- All cycles
- 2024: D+9.6 2020: D+12.1 2016: D+8.4 2012: D+21.9 2008: D+24.6
Not yet ingested
- Civics
- —
Market trends
- HPI YoY
- ▼ -108.05%
- Current HPI
- 154.4012
- Rent YoY
- —
- Metro
- Davenport-Moline-Rock Island, IA-IL
- State GDP YoY
- ▲ 1.59%
- F500 in state
- 60
Industry mix (Fortune 500 HQ in IL)
| Industry | F500 HQs | Revenue |
|---|---|---|
| Insurance | 4 | $201B |
|
||
| Consumer Goods | 4 | $87B |
|
||
| Industrial Machinery | 3 | $64B |
|
||
| Healthcare | 2 | $55B |
|
||
| Retail / Pharmacy | 1 | $148B |
|
||
| Agriculture / Food | 1 | $86B |
|
||
Price history
+99.8% since first listed25 events — show timeline
- 2026-05-24 Relisted — MRED as Distributed by MLS Grid
- 2026-05-23 Relisted — MRED as Distributed by MLS Grid
- 2026-05-08 Price Changed $84,900 MRED as Distributed by MLS Grid
- 2026-04-13 Listed $89,900 MRED as Distributed by MLS Grid
- 2026-01-21 Listing Removed — MRED as Distributed by MLS Grid
- 2026-01-21 Listing Removed — MRED as Distributed by MLS Grid
- 2026-01-08 Relisted — MRED as Distributed by MLS Grid
- 2026-01-06 Listing Removed — RMLSA as Distributed by MLS Grid
- 2026-01-05 Listing Removed — MRED as Distributed by MLS Grid
- 2025-08-29 Listed — RMLSA as Distributed by MLS Grid
- 2024-01-29 Rental Removed $1,000 APPFOLIO
- 2024-01-18 Listed for Rent $1,000 APPFOLIO
- 2021-08-06 Listing Removed — RMLSA as Distributed by MLS Grid
- 2021-08-06 Listing Removed — RMLSA as Distributed by MLS Grid
- 2017-04-18 Sold (Public Records) $92,600 Public Records
- 2010-10-04 Sold (Public Records) $53,500 Public Records
- 2010-05-12 Sold (MLS) $25,500 MRED as Distributed by MLS Grid
- 2010-05-12 Sold (MLS) $25,500 RMLSA as Distributed by MLS Grid
- 2010-02-04 Listed $32,900 MRED as Distributed by MLS Grid
- 2010-02-04 Listed $32,900 RMLSA as Distributed by MLS Grid
- 2004-12-30 Sold (Public Records) $64,500 Public Records
- 2004-12-29 Sold (MLS) $64,425 RMLSA as Distributed by MLS Grid
- 2004-12-06 Listed $63,900 RMLSA as Distributed by MLS Grid
- 2004-04-15 Sold (MLS) $32,000 RMLSA as Distributed by MLS Grid
- 2003-12-16 Listed $42,500 RMLSA as Distributed by MLS Grid
Property tax history
+3.4%/yrLatest (2024): $3,394 · +5.9% YoY. Source: county tax records.
Cash-flow waterfall
monthlySold comps — $/sqft
last 12 mo · ≤1 miLoading sold comps…