 Multi-family
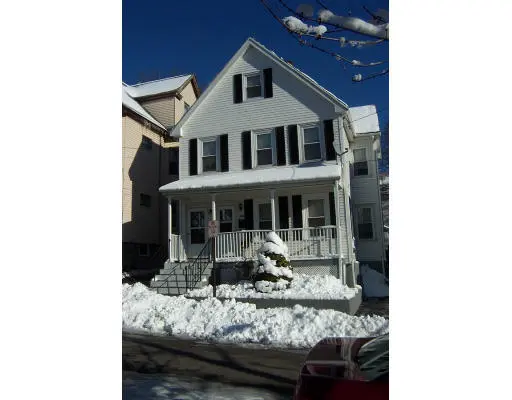
159 Jefferson Ave · Everett, MA
Flood risk 1/10 · Minimal
- FEMA flood zone
- X (unshaded)
- Chance of flooding over 30 yrs
- 0.0%
- Est. flood insurance / yr
- $473 – $860
Fire risk 1/10 · Minimal
- Est. fire insurance / yr
- $915 – $1,699
Heat risk 6/10 · Moderate
- Hot days now (above 97°F)
- 7 days/yr
- Hot days in 30 yrs
- 15 days/yr
Wind risk 6/10 · Moderate
- Chance of severe wind over 30 yrs
- 67.0%
Air-quality risk 3/10 · Minor
- Unhealthy air days now
- 3 days/yr
- Unhealthy air days in 30 yrs
- 3 days/yr
Risk factors via First Street. Map © Google.
Why this score? — see what drove the C grade
The composite is a weighted blend of 9 inputs, each scored 0–100. Each bar is that input's sub-score; the figure is the points it added to the 100-point composite (weight × sub-score).
- Cash flow +24.0/30.0
- ARV discount +10.6/15.0
- DSCR +7.7/10.0
- 1% rule +5.6/10.0
- Livability +4.0/5.0
- Rent growth +3.0/5.0
- Condition / age +2.5/5.0
- Schools +1.8/10.0
- Appreciation +0.0/10.0
$829,000
🖨 Deal sheet 📄 Offer letter ✓ Due diligence
Multi-family units
County records classify this as Multi-Family (2-4 Unit). Listing-text estimate: 1 unit. estimate disagrees with records
Listing remarks MLS
Well maintained two family with nice fenced yard and garage. Perfect for owner occupant.
Key facts
- Spacious kitchens
- Two car garage
- 3,376 sq ft lot
Tags
Neighborhood map
What this means for you Summary
Snapshot
- This is a 5-bed/2.0-bath multifamily listed at $829k.
Deal economics
- At list price, monthly cash flow is $2k ($19k/yr) — positive.
- The deal already cash-flows at list — no discount required.
- Meets the 1% rule at list price ($9k rent vs $829k).
- Recommended offer: $804k (3.0% below list) — sets the bar for market timing.
- Cap rate 8.6% vs local median 3.8% in Everett — top-decile yield for the area; either an underpriced asset or a hidden risk that comps aren't pricing in. Stress-test before assuming the spread holds.
Location & tenants
- Location reads 80/100 on livability (#35 in MA, #1,665 nationally) — a professional / high-income tenant draw. Strengths: amenities A+, commute A+, health & safety A+; Watch: cost of living F.
- Everett (suburban): math 15% / reading 26% proficiency, ranked #289 of 302 in MA (top 96%) — low school quality limits family demand, transient renter base, plan for 1-2y turnover; 69% free/reduced lunch — lower-income household profile, screen leases tightly.
- Market conditions: Rents rising (+2.0%/yr); 45 active listings in the ZIP; 21 comparable units currently listed for rent nearby; rentals at typical pace (median 24d on market — plan ~3-4 weeks tenant-placement turnaround); solid renter incomes; 3,670 units permitted in Middlesex County in 2024 (2,611 in 5+ unit buildings).
- At $8,821/mo this rent would consume 124% of the median local household income ($85k/yr) (locally 2888% of renters already pay >50% of income on rent) — very limited rent-growth headroom before tenants either downsize or default.
Forward outlook
- Local home prices are declining (-3.0%/yr); year-one equity from $6k of loan paydown is wiped out by about $25k of value loss. Plan a longer hold.
- Middlesex County population projected at +20% by 2050 — long-run rental-demand tailwind backs the buy-and-hold thesis.
Negotiation context
- It's been on market 49 days — a 3% lower offer ($804k) is reasonable based on typical stale-listing flexibility.
- 2 sale attempts since 28y ago; this cycle's ask is 196% above the opening price — seller raised mid-cycle; expect resistance to lowballs.
- Current owner paid $275k; list at $829k implies a 201% gain — meaningful room to come down on a strong offer.
Risks & watch-outs
- Watch-outs: built in 1900 — expect roof / HVAC / electrical / plumbing capex.
- Climate carrying-cost: major wind risk, 67% chance of damaging wind over 30y; extreme-heat days projected 7→15/yr by 2055 (HVAC capex compounding) — expect insurance premiums to compound above CPI over the hold.
Questions for the listing agent
- It's been on market 49 days. Have you received any prior offers? Is the seller open to a 3% concession, seller financing, or rate buy-down credit?
- Built in 1900 — when were the roof, HVAC, electrical panel, plumbing, and water heater last replaced?
- Is there a deadline driving the sale (1031 exchange, divorce, estate, relocation)? That informs how much negotiation room exists.
- What's the average days-on-market for RENTAL listings here right now (not sales)? A rising rental-DOM trend means longer vacancies and softer asking-rent achievability than the comps imply.
- What's the recent tenant-quality profile in this submarket — average credit score on applications, eviction rate, late-payment / NSF rate, and stable-employment percentage? A property-management company in the area should have these aggregated.
- How much new apartment / multifamily construction is in the pipeline within 1–3 miles? Heavy new supply (>2% of stock underway) typically softens rents 12–24 months out; light construction supports rent growth.
Investment metrics
- 1% rule
- 1.06% ✓
- Cap rate
- 8.64%
- Cash-on-cash
- 8.38%
- DSCR
- 1.37
- GRM
- 7.8
CMA / ARV
- ARV (median comp)
- $889,533
- List price
- $829,000
- Delta
- -6.81%
- Verdict
- FAIR
- Comps
- 20 within 1.0 mi
Show comp detail 12 sales within ~0.75 mi
| Address | Dist | Beds/Ba | Sqft | Sold | Price | $/sf | Match |
|---|---|---|---|---|---|---|---|
| 26 Clay Ave | 0.11mi | 5/2.0 | 2,367 (+9%) | 6mo | $850,000 | $359 | 76 |
| 16 Woodside Ave | 0.34mi | 5/2.0 | 2,100 (-3%) | 8mo | $735,000 | $350 | 72 |
| 14 Russell St | 0.25mi | 5/2.0 | 1,974 (-9%) | 6mo | $780,000 | $395 | 68 |
| 98 Walnut St | 0.56mi | 5/2.0 | 2,221 (+2%) | 6mo | $900,000 | $405 | 65 |
| 35-37 Harvard St | 0.38mi | 6/4.0 (+1) | 2,200 (+1%) | 5mo | $919,000 | $418 | 63 |
| 20 Fairmount St | 0.46mi | 5/2.0 | 2,341 (+8%) | 3mo | $940,000 | $402 | 63 |
| 40 Wilbur St | 0.30mi | 5/3.0 | 2,372 (+9%) | 5mo | $730,000 | $308 | 62 |
| 92 Irving St | 0.60mi | 4/2.0 (-1) | 2,265 (+4%) | 1mo | $900,000 | $397 | 59 |
| 39-41 Luke Rd | 0.71mi | 5/3.0 | 2,184 (+0%) | 5mo | $1,000,000 | $458 | 58 |
| 109 Arnold St | 0.66mi | 4/2.0 (-1) | 2,208 (+2%) | 5mo | $700,000 | $317 | 58 |
| 38 Oakwood Ave | 0.67mi | 5/2.5 | 2,230 (+2%) | 7mo | $880,000 | $395 | 57 |
| 58 Walnut St | 0.63mi | 5/3.0 | 2,036 (-6%) | 6mo | $890,000 | $437 | 51 |
Match score weights: distance 35% · size 25% · config 20% · recency 20%. Top-matched comps best support the ARV.
Projected returns pro-forma
-3.0% appreciation · 2.03% rent growth · sell at horizon
- IRR
- -4.6%
- Equity multiple
- 0.83×
- Total profit
- $-39,753
- Equity at exit
- $123,607
- IRR
- 3.9%
- Equity multiple
- 1.27×
- Total profit
- $63,558
- Equity at exit
- $71,677
Cash invested: $232,120 (down + closing). Projections, not guarantees.
Landlord ↔ Tenant lean methodology
- Overall (STATE)
- 20 Strongly Tenant-Friendly
- State Massachusetts
- 20 Strongly Tenant-Friendly · D+15
- County
- — inherits STATE
- City
- — inherits STATE
ZIP-level market 02149
- Home prices YoY
- -24.2%
- Rents YoY
- 2.0%
- Active inventory
- 45
- Price-to-rent
- 27.6×
Monthly cashflow live
- Estimated rent
- $8,821 high interval (Pro) →
- Mortgage (P&I)
- −$4,347
- Tax from tax record
- −$655 /mo · $7,864/yr
- Insurance
- −$345
- HOA
- −$0
- Vacancy / Maint / Mgmt
- −$1,852
- Net cashflow
- $1,620
Break-even live
3-unit breakdown (identical units grouped — click to expand)
| Units | Beds | Baths | Est. rent |
|---|---|---|---|
| 1× unit | 2 | 1 | $2,504 |
| 2× units | 3 | 1 | $6,318 |
| #2 | 3 | 1 | $3,159 |
| #3 | 3 | 1 | $3,159 |
| Total (3 units) | $8,821 | ||
UW: 25.0% down · 7.5% · 30yr · 1.5% tax · 5.0% vac · 8.0% maint · 8.0% mgmt
Financing live
Cash to close
- Down payment
- $207,250
- Closing costs
- $24,870
- Reserves months
- —
- Total cash needed
- —
Loan-product check · same deal, 3 products live
Conventional
25% down · 7.5% · 30yr
- Down + closing
- —
- Monthly P&I
- —
- Monthly cashflow
- —
- DSCR
- —
- Eligible?
- —
Personal DTI + credit; lowest rate.
DSCR
20% down · 8.5% · 30yr
- Down + closing
- —
- Monthly P&I
- —
- Monthly cashflow
- —
- DSCR
- —
- Eligible?
- —
No personal income docs; deal must DSCR.
Hard money
10% down · 12.0% · 12mo
- Down + closing
- —
- Monthly P&I
- —
- Monthly cashflow
- —
- DSCR
- —
- Eligible?
- —
Short-term bridge; refi at stabilization.
Rent comps 21 comps
| Address | Beds | Baths | Sqft | Rent | $/sqft | DOM | Units | Dist |
|---|---|---|---|---|---|---|---|---|
| 54 Hillside Ave Unit 2 Everett, MA | 4.0 | 1.0 | 2444 | $3,200 | $1.31 | 4d | 1 | 0.44mi |
| 20 Fairmount St Unit 2 Everett, MA | 5.0 | 1.0 | 1400 | $3,500 | $2.50 | 43d | 1 | 0.48mi |
| 26 Arlington St #2 Everett, MA | 4.0 | 2.0 | 2500 | $3,700 | $1.48 | 23d | 1 | 0.54mi |
| 95 Waverly Ave Unit 2 Everett, MA | 5.0 | 2.0 | 1800 | $4,199 | $2.33 | 43d | 1 | 0.57mi |
| 9 Rock Valley Ave Everett, MA | 4.0 | 3.0 | 1586 | $3,895 | $2.46 | 17d | 1 | 0.61mi |
| 9 Rock Valley Ave Everett, MA | 4.0 | 3.0 | 1586 | $3,995 | $2.52 | 43d | 1 | 0.61mi |
| 33 George St Unit 2 Everett, MA | 4.0 | 1.0 | 1560 | $3,400 | $2.18 | 43d | 1 | 0.65mi |
| 32 Irving St Unit 1 Everett, MA | 4.0 | 2.0 | 1500 | $4,500 | $3.00 | 24d | 1 | 0.74mi |
| 47 Pleasant St Everett, MA | 6.0 | 1.5 | 1814 | $4,500 | $2.48 | 43d | 1 | 0.80mi |
| 91 Waverly St Unit 2 Everett, MA | 5.0 | 1.5 | 1650 | $4,200 | $2.55 | 17d | 1 | 0.83mi |
| 216 Vane St Unit 1 Revere, MA | 4.0 | 2.5 | 2300 | $4,050 | $1.76 | 17d | 1 | 0.93mi |
| 109 Walnut St Unit 109 Malden, MA | 4.0 | 1.5 | 2338 | $4,200 | $1.80 | 10d | 1 | 1.10mi |
| 10 Forsyth St Chelsea, MA | 1.0–4.0 | 1.0–2.0 | 1176 | $2,878 | $2.45 | 4d | 3 | 1.14mi |
| 19 Bellingham Ave Unit 19 Everett, MA | 4.0 | 2.0 | 1400 | $4,300 | $3.07 | 1d | 1 | 1.18mi |
| 10 Pearl St Unit 2 Everett, MA | 4.0 | 2.0 | 1685 | $4,200 | $2.49 | 24d | 1 | 1.22mi |
| 243 Malden St Unit 2 Revere, MA | 4.0 | 3.0 | 2200 | $4,250 | $1.93 | 17d | 1 | 1.36mi |
| 8 Parsonage Rd Malden, MA | 4.0 | 2.0 | 2400 | $3,700 | $1.54 | 17d | 1 | 1.36mi |
| 21 Converse Ave Unit 1 Malden, MA | 4.0 | 1.5 | 2000 | $3,500 | $1.75 | 17d | 1 | 1.38mi |
| 34 Hooper St Unit 2 Chelsea, MA | 4.0 | 1.0 | 1400 | $4,200 | $3.00 | 43d | 1 | 1.45mi |
| 188 Main St Unit 2 Malden, MA | 4.0 | 2.0 | 1500 | $3,200 | $2.13 | 24d | 1 | 1.49mi |
| 39 Baker St Unit 41 Malden, MA | 4.0 | 1.0 | 1800 | $3,100 | $1.72 | 43d | 1 | 1.49mi |
Listing history 22 events
-
2026-06-18days on market $829,000 Active 49 DOM
-
2026-06-17days on market $829,000 Active 48 DOM
-
2026-06-16days on market $829,000 Active 47 DOM
-
2026-06-15days on market $829,000 Active 46 DOM
-
2026-06-13days on market $829,000 Active 44 DOM
-
2026-06-13days on market $829,000 Active 43 DOM
-
2026-06-09days on market $829,000 Active 40 DOM
-
2026-06-08days on market $829,000 Active 39 DOM
-
2026-06-07days on market $829,000 Active 38 DOM
-
2026-06-04days on market $829,000 Active 35 DOM
-
2026-06-03days on market $829,000 Active 34 DOM
-
2026-06-02days on market $829,000 Active 33 DOM
-
2026-06-01days on market $829,000 Active 32 DOM
-
2026-05-31days on market $829,000 Active 31 DOM
-
2008-06-03soldstatus $275,000 89-char remark
Show marketing remark (89 chars)
Well maintained two family with nice fenced yard and garage. Perfect for owner occupant.
-
2008-03-31historical 89-char remark
Show marketing remark (89 chars)
Well maintained two family with nice fenced yard and garage. Perfect for owner occupant.
-
2008-03-11$279,900 89-char remark
Show marketing remark (89 chars)
Well maintained two family with nice fenced yard and garage. Perfect for owner occupant.
-
1998-12-15soldstatus $190,000
-
1998-11-30soldstatus $190,000 153-char remark
Show marketing remark (153 chars)
DELEADED 2 1/2 FAMILY. LARGE 6 ROOM OWNERS UNIT, VINYL SIDED, ALL SEPERATE UTILITIES, READY FOR IMMEADIATE OCCUPANCY. GOOD LOCATION IN THE WOODLAWN AREA
-
1998-10-26historical 153-char remark
Show marketing remark (153 chars)
DELEADED 2 1/2 FAMILY. LARGE 6 ROOM OWNERS UNIT, VINYL SIDED, ALL SEPERATE UTILITIES, READY FOR IMMEADIATE OCCUPANCY. GOOD LOCATION IN THE WOODLAWN AREA
-
1998-10-02$192,500 153-char remark
Show marketing remark (153 chars)
DELEADED 2 1/2 FAMILY. LARGE 6 ROOM OWNERS UNIT, VINYL SIDED, ALL SEPERATE UTILITIES, READY FOR IMMEADIATE OCCUPANCY. GOOD LOCATION IN THE WOODLAWN AREA
-
1988-02-17soldstatus $186,500
ⓘ Source: listings_history table (triggers on properties + properties_extension) + one-shot
backfill from property_details.listing_events for pre-trigger history.
Tax reassessment forecast MA · Partial reset (capped growth)
- Current annual tax
- $7,864 · $655/mo
- Projected year-2 tax
- $9,030 · $753/mo
- Expected delta
- +$1,166/yr (+$97/mo · 14.8%)
ⓘ Screening estimate from a state-policy table — verify with the county assessor before closing.
Climate risk First Street
- Flood 1/10 Low FEMA zone X (unshaded) · 0% chance over 30 yrs
- Wildfire 1/10 Low
- Heat 6/10 Major 7 d/yr ≥97°F today · 15 d/yr by 30 yrs out
- Wind 6/10 Major 67% chance of damaging wind over 30 yrs
- Air quality 3/10 Moderate 3 unhealthy d/yr today · 3 by 30 yrs out
Nearby sold comps map
Loading sold comps map…
Walkable amenities ~0.75 mi
Loading nearby amenities…
Taxation est. · year 1
- Rental income
- $105,852
- − Mortgage interest
- −$46,437
- − Property taxes
- −$7,864
- − Insurance
- −$4,145
- − Repairs & maintenance
- −$8,468
- − Management
- −$8,468
- − Depreciation
- −$24,116
- Taxable income
- $6,353
- Est. tax owed @ 24.0%
- −$1,525
- After-tax cash flow
- $17,921/yr
For passive investors: Depreciation is non-cash, so a rental often shows a tax loss while cash-flowing — sheltering income. Rental losses are passive: they offset passive income freely, and up to $25,000/yr can offset ordinary (W-2) income if you actively participate and your MAGI is under $100k (phasing out to $0 by $150k); unused losses carry forward. On sale, claimed depreciation is recaptured at up to 25%, and gains may owe capital-gains tax (a 1031 exchange can defer both). Figures are a year-1 estimate at your 24.0% rate — not tax advice; consult a CPA.
Schools (NCES district)
- District
- Everett
- NCES district ID
- 2504770
- Math proficiency
- 15% ▼ -22.00%
- Reading proficiency
- 26% ▼ -12.00%
- Median HH income
- $51,780
- Composite
- 18.46/100
- National rank
- #8926
- State rank
- #289 of 302 in MA
Livability — Everett
- Score
- 80/100
- State rank
- #35
- US rank
- #1665
Category grades
Schools grade is shown separately in the Schools card above.
Census & demographics
- Census place
- Everett, MA
- County
- Middlesex County · 1,437,704 people
- City population
- 50,045
- Metro
- Boston-Cambridge-Newton, MA-NH
- Population (ZIP)
- 50,045
- Household income
- $85,218
- Rent vs Own
- Severe rent burden
- 2888.0
Population outlook (Middlesex County) Hauer SSP2
- Today (2025)
- 1,740,269 people
- By 2030
- 1,817,187 · +4.4%
- By 2040
- 1,963,195 · +12.8%
- By 2050
- 2,087,461 · +20.0%
- By 2075
- 2,344,036 · +34.7%
- By 2100
- 2,383,776 · +37.0%
Race, ethnicity, and origin ACS 2023
- Neighborhood character
- Highly diverse neighborhood (Simpson 0.74)
- Race & ethnicity
- White 38% Hispanic / Latino 31% Two or more races 23% Black 12% Asian 8%
- Hispanic origin (detail)
- Mexican 1% Puerto Rican 4%
- Common ancestry
- Estonian 10% Hispanic 5% Russian 3%
- Foreign-born
- 45% · Canada, Vietnam, China
- Languages at home
- 37% English-only · Spanish 26% Other Indo-European 22% French/Haitian/Cajun 8%
Political lean MEDSL · Middlesex
- 2024 margin
- Solid D (+39.5) · D 68.5% · R 29.0% · Other 2.5%
- 2008→2024 swing
- +9.3pp toward D · 2008: 30.1pp · 2024: 39.5pp
- All cycles
- 2024: D+39.5 2020: D+45.2 2016: D+38.1 2012: D+26.9 2008: D+30.1
Not yet ingested
- Civics
- —
Market trends
- HPI YoY
- ▼ -115.43%
- Current HPI
- 361.8972
- Rent YoY
- ▲ 2.03%
- Metro
- Boston-Cambridge-Newton, MA-NH
- State GDP YoY
- ▲ 2.28%
- F500 in state
- 38
Industry mix (Fortune 500 HQ in MA)
| Industry | F500 HQs | Revenue |
|---|---|---|
| Technology | 3 | $17B |
|
||
| Insurance | 2 | $84B |
|
||
| Retail | 2 | $76B |
|
||
| Life Sciences | 1 | $43B |
|
||
| Energy Technology | 1 | $31B |
|
||
| Aerospace / Defense | 1 | $18B |
|
||
Price history
+47.5% since first listed8 events — show timeline
- 2008-06-03 Sold (MLS) $275,000 MLS PIN
- 2008-03-31 Listing Removed — MLS PIN
- 2008-03-11 Listed $279,900 MLS PIN
- 1998-12-15 Sold (Public Records) $190,000 Public Records
- 1998-11-30 Sold (MLS) $190,000 MLS PIN
- 1998-10-26 Listing Removed — MLS PIN
- 1998-10-02 Listed $192,500 MLS PIN
- 1988-02-17 Sold (Public Records) $186,500 Public Records
Property tax history
+6.5%/yrLatest (2025): $7,864 · +8.3% YoY. Source: county tax records.
Cash-flow waterfall
monthlySold comps — $/sqft
last 12 mo · ≤1 miLoading sold comps…