2011 Harding Ave · Vandalia, OH
Flood risk 1/10 · Minimal
- FEMA flood zone
- X (unshaded)
- Chance of flooding over 30 yrs
- 0.0%
- Est. flood insurance / yr
- $507 – $1,088
Fire risk 1/10 · Minimal
- Est. fire insurance / yr
- $713 – $1,323
Heat risk 3/10 · Minor
- Hot days now (above 103°F)
- 7 days/yr
- Hot days in 30 yrs
- 18 days/yr
Wind risk 2/10 · Minimal
- Chance of severe wind over 30 yrs
- —
Air-quality risk 3/10 · Minor
- Unhealthy air days now
- 2 days/yr
- Unhealthy air days in 30 yrs
- 4 days/yr
Risk factors via First Street. Map © Google.
Why this score? — see what drove the B- grade
The composite is a weighted blend of 9 inputs, each scored 0–100. Each bar is that input's sub-score; the figure is the points it added to the 100-point composite (weight × sub-score).
- Cash flow +25.2/30.0
- ARV discount +12.6/15.0
- DSCR +8.3/10.0
- 1% rule +6.0/10.0
- Schools +5.0/10.0
- Rent growth +4.4/5.0
- Livability +3.5/5.0
- Condition / age +2.5/5.0
- Appreciation +0.0/10.0
$135,000
🖨 Deal sheet 📄 Offer letter ✓ Due diligence
Listing remarks
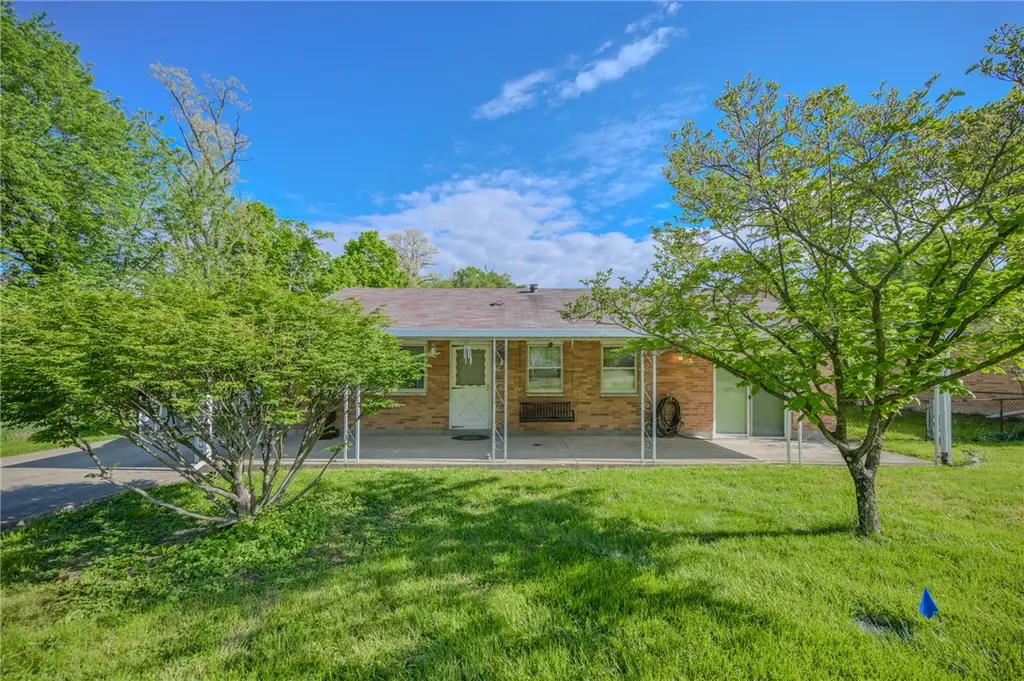
Welcome home to this beautifully refreshed brick ranch in Northridge offering easy one-level living with space to spread out inside and out! Situated on a large . 21-acre lot, this 3-bedroom home features over 1,100 square feet, fresh updates throughout, and a functional layout ready for its next owner. Inside, you’ll find updated flooring, fresh paint, an updated bathroom, and spacious living areas filled with natural light. The oversized kitchen offers plenty of cabinet and counter space with a unique pop of character, while the additional flex space/sunroom provides the perfect spot for a second living area, office, playroom, or hobby space. Outside, enjoy the covered front porch,
Key facts
- Large lot
- Updated flooring
- One level living
Tags
Property features AI
Finance
- Financial info: Offered for sale
Exterior
- Parking: Carport
- Home design: Single-story brick home
- Construction: Built on a slab foundation
- Exterior features: Residential lot approximately 0.21 acres (assessor); Lot dimensions about 111 x 83
Interior
- Bedrooms: Two main-level bedrooms (approx. 10 x 12 and 8 x 10)
- Bathrooms: One full bathroom on the main level
- Heating & cooling: Central air conditioning; Forced air heating (natural gas)
- Interior features: Total of 3 rooms
Neighborhood map
What this means for you Summary
Snapshot
- This is a 3-bed/1.0-bath single-family listed at $135k.
Deal economics
- At list price, monthly cash flow is $301 ($4k/yr) — positive.
- The deal already cash-flows at list — no discount required.
- Meets the 1% rule at list price ($1k rent vs $135k).
- Recommended offer: $133k (1.5% below list) — sets the bar for market timing.
- Cap rate 9.0% vs local median 2.9% in Vandalia — top-decile yield for the area; either an underpriced asset or a hidden risk that comps aren't pricing in. Stress-test before assuming the spread holds.
Location & tenants
- Location reads 70/100 on livability (#463 in OH) — a middle-class / working-renter tenant base. Strengths: cost of living A+, housing A+, schools B+; Watch: amenities F, commute F, health & safety F.
- Market conditions: Rents rising fast (+7.4%/yr); 51 active listings in the ZIP; 9 comparable units currently listed for rent nearby; rentals leasing fast (median 3d on market — plan ~1-2 weeks tenant-placement turnaround); 907 units permitted in Montgomery County in 2024 (416 in 5+ unit buildings).
- This rent runs 33% of the median local income ($54k/yr) — at the standard rent-burdened threshold; future hikes will face affordability resistance.
Forward outlook
- Local home prices are declining (-3.0%/yr); year-one equity from $933 of loan paydown is wiped out by about $4k of value loss. Plan a longer hold.
- Montgomery County population projected at -10% by 2050 — secular population decline; favor cash flow + early exit over multi-decade hold.
- At projected returns (-3.0% appreciation + 7.4% rent growth), your $38k cash investment doubles in ~8 years — after that, you're playing with house money.
Negotiation context
- It's been on market 27 days — a 2% lower offer ($133k) is reasonable based on typical stale-listing flexibility.
Questions for the listing agent
- Built in 1970 — when were the roof, HVAC, electrical panel, plumbing, and water heater last replaced?
- Is there a deadline driving the sale (1031 exchange, divorce, estate, relocation)? That informs how much negotiation room exists.
- Schools are B-rated — typically a magnet for longer-tenancy family renters. What's the average tenant stay here, and is there a school-zone premium baked into asking?
- What's the average days-on-market for RENTAL listings here right now (not sales)? A rising rental-DOM trend means longer vacancies and softer asking-rent achievability than the comps imply.
- What's the recent tenant-quality profile in this submarket — average credit score on applications, eviction rate, late-payment / NSF rate, and stable-employment percentage? A property-management company in the area should have these aggregated.
- How much new for-sale + rental construction is in the pipeline within 1–3 miles? Heavy new supply typically softens prices + rents 12–24 months out; constrained supply supports both.
Investment metrics
- 1% rule
- 1.10% ✓
- Cap rate
- 8.97%
- Cash-on-cash
- 9.56%
- DSCR
- 1.43
- GRM
- 7.6
CMA / ARV
- ARV (on-the-fly)
- $152,152
- Comps found
- 12
Show comp detail 12 sales within ~0.75 mi
| Address | Dist | Beds/Ba | Sqft | Sold | Price | $/sf | Match |
|---|---|---|---|---|---|---|---|
| 2159 Gipsy Dr | 0.42mi | 3/1.0 | 1,135 (-1%) | 6mo | $125,000 | $110 | 74 |
| 5741 Lily Ln | 0.20mi | 3/1.5 | 1,073 (-6%) | 6mo | $180,000 | $168 | 73 |
| 6865 Keats Dr | 0.38mi | 2/1.0 (-1) | 1,080 (-6%) | 4mo | $123,000 | $114 | 65 |
| 2108 Gipsy Dr | 0.42mi | 3/1.0 | 1,053 (-8%) | 4mo | $54,670 | $52 | 64 |
| 2006 High Knoll Dr | 0.63mi | 3/2.0 | 1,160 (+1%) | 3mo | $191,000 | $165 | 62 |
| 2211 Martin Ave | 0.34mi | 3/1.0 | 988 (-14%) | 2mo | $131,400 | $133 | 60 |
| 5421 Northcutt Pl | 0.57mi | 3/1.5 | 1,226 (+7%) | 0mo | $198,900 | $162 | 60 |
| 2203 Cardinal Ave | 0.48mi | 3/1.5 | 1,064 (-7%) | 6mo | $152,000 | $143 | 59 |
| 2213 Martin Ave | 0.34mi | 3/1.0 | 988 (-14%) | 3mo | $127,000 | $129 | 58 |
| 5718 Woodmore Dr | 0.44mi | 3/1.5 | 1,293 (+13%) | 0mo | $172,500 | $133 | 55 |
| 2416 Stop 8 Rd | 0.65mi | 3/1.5 | 1,296 (+13%) | 0mo | $190,000 | $147 | 45 |
| 2127 Marker Ave | 0.75mi | 2/1.0 (-1) | 989 (-14%) | 7mo | $100,000 | $101 | 32 |
Match score weights: distance 35% · size 25% · config 20% · recency 20%. Top-matched comps best support the ARV.
Projected returns pro-forma
-3.0% appreciation · 7.41% rent growth · sell at horizon
- IRR
- 2.7%
- Equity multiple
- 1.11×
- Total profit
- $4,176
- Equity at exit
- $20,129
- IRR
- 16.0%
- Equity multiple
- 2.57×
- Total profit
- $59,211
- Equity at exit
- $11,672
Cash invested: $37,800 (down + closing). Projections, not guarantees.
Landlord ↔ Tenant lean methodology
- Overall (STATE)
- 73 Landlord-Friendly
- State Ohio
- 73 Landlord-Friendly · R+6
- County
- — inherits STATE
- City
- — inherits STATE
ZIP-level market 45414
- Rents YoY
- 7.4%
- Active inventory
- 51
- Price-to-rent
- 7.6×
Monthly cashflow live
- Estimated rent
- $1,485 high interval (Pro) →
- Mortgage (P&I)
- −$708
- Tax from tax record
- −$108 /mo · $1,291/yr
- Insurance
- −$56
- HOA
- −$0
- Vacancy / Maint / Mgmt
- −$312
- Net cashflow
- $301
Break-even live
UW: 25.0% down · 7.5% · 30yr · 1.5% tax · 5.0% vac · 8.0% maint · 8.0% mgmt
Financing live
Cash to close
- Down payment
- $33,750
- Closing costs
- $4,050
- Reserves months
- —
- Total cash needed
- —
Loan-product check · same deal, 3 products live
Conventional
25% down · 7.5% · 30yr
- Down + closing
- —
- Monthly P&I
- —
- Monthly cashflow
- —
- DSCR
- —
- Eligible?
- —
Personal DTI + credit; lowest rate.
DSCR
20% down · 8.5% · 30yr
- Down + closing
- —
- Monthly P&I
- —
- Monthly cashflow
- —
- DSCR
- —
- Eligible?
- —
No personal income docs; deal must DSCR.
Hard money
10% down · 12.0% · 12mo
- Down + closing
- —
- Monthly P&I
- —
- Monthly cashflow
- —
- DSCR
- —
- Eligible?
- —
Short-term bridge; refi at stabilization.
Rent comps 9 comps
| Address | Beds | Baths | Sqft | Rent | $/sqft | DOM | Units | Dist |
|---|---|---|---|---|---|---|---|---|
| 2022 Arthur Ave Unit NA Dayton, OH | 3.0 | 1.0 | 1040 | $1,500 | $1.44 | 11d | 1 | 0.01mi |
| 2109 Harding Ave Dayton, OH | 2.0 | 1.0 | 750 | $950 | $1.27 | 2d | 1 | 0.01mi |
| 5900 Erica Ct Dayton, OH | 2.0 | 1.0 | 800 | $975 | $1.22 | 2d | 1 | 0.38mi |
| 3136 Silver Rock Ave Unit 3138 Dayton, OH | 2.0 | 1.5 | 1274 | $1,395 | $1.09 | 18d | 1 | 0.96mi |
| 2991 Benchwood Rd Unit 2993 Dayton, OH | 2.0 | 1.5 | 1063 | $1,295 | $1.22 | 2d | 1 | 0.96mi |
| 3006 Benchwood Rd Unit 1 Dayton, OH | 2.0 | 1.5 | 1250 | $1,275 | $1.02 | 23d | 1 | 0.96mi |
| 3155 Silver Rock Ave Unit 3157 Dayton, OH | 2.0 | 1.5 | 1200 | $1,500 | $1.25 | 2d | 1 | 0.96mi |
| 3097 Silver Rock Ave Unit 3103 Dayton, OH | 2.0 | 1.5 | 1035 | $1,295 | $1.25 | 14d | 1 | 1.03mi |
| 4911 Northcutt Pl Dayton, OH | 2.0 | 1.0 | 850 | $825 | $0.97 | 2d | 1 | 1.12mi |
Listing history 7 events
-
2026-06-07statusdays on market $135,000 Pending 27 DOM
-
2026-06-03days on market $135,000 Active 26 DOM
-
2026-06-02pricedays on market $135,000 Active 25 DOM
-
2026-06-01days on market $145,000 Active 24 DOM
-
2026-05-31days on market $145,000 Active 23 DOM
-
2026-05-22price $145,000
-
2026-05-08$150,000 Active
ⓘ Source: listings_history table (triggers on properties + properties_extension) + one-shot
backfill from property_details.listing_events for pre-trigger history.
Tax reassessment forecast OH · Partial reset (capped growth)
- Current annual tax
- $1,291 · $108/mo
- Projected year-2 tax
- $1,698 · $142/mo
- Expected delta
- +$408/yr (+$34/mo · 31.6%)
ⓘ Screening estimate from a state-policy table — verify with the county assessor before closing.
Climate risk First Street
- Flood 1/10 Low FEMA zone X (unshaded) · 0% chance over 30 yrs
- Wildfire 1/10 Low
- Heat 3/10 Moderate 7 d/yr ≥103°F today · 18 d/yr by 30 yrs out
- Wind 2/10 Low
- Air quality 3/10 Moderate 2 unhealthy d/yr today · 4 by 30 yrs out
Nearby sold comps map
Loading sold comps map…
Walkable amenities ~0.75 mi
Loading nearby amenities…
Taxation est. · year 1
- Rental income
- $17,818
- − Mortgage interest
- −$7,562
- − Property taxes
- −$1,291
- − Insurance
- −$675
- − Repairs & maintenance
- −$1,425
- − Management
- −$1,425
- − Depreciation
- −$3,927
- Taxable income
- $1,512
- Est. tax owed @ 24.0%
- −$363
- After-tax cash flow
- $3,252/yr
For passive investors: Depreciation is non-cash, so a rental often shows a tax loss while cash-flowing — sheltering income. Rental losses are passive: they offset passive income freely, and up to $25,000/yr can offset ordinary (W-2) income if you actively participate and your MAGI is under $100k (phasing out to $0 by $150k); unused losses carry forward. On sale, claimed depreciation is recaptured at up to 25%, and gains may owe capital-gains tax (a 1031 exchange can defer both). Figures are a year-1 estimate at your 24.0% rate — not tax advice; consult a CPA.
Schools (NCES district)
No district data.
Livability — Vandalia
- Score
- 70/100
- State rank
- #463
- US rank
- #7669
Category grades
Schools grade is shown separately in the Schools card above.
Census & demographics
- County
- Montgomery County · 459,541 people
- City population
- 14,888
- Metro
- Dayton-Kettering, OH
- Population (ZIP)
- 21,167
- Household income
- $54,485
- Rent vs Own
- Severe rent burden
- 801.0
Population outlook (Montgomery County) Hauer SSP2
- Today (2025)
- 523,241 people
- By 2030
- 514,948 · -1.6%
- By 2040
- 493,378 · -5.7%
- By 2050
- 469,639 · -10.2%
- By 2075
- 418,360 · -20.0%
- By 2100
- 353,315 · -32.5%
Race, ethnicity, and origin ACS 2023
- Neighborhood character
- Predominantly White (75%)
- Race & ethnicity
- White 75% Black 15% Two or more races 6% Hispanic / Latino 4% Asian 1%
- Common ancestry
- Slovak 2% Romanian 2% Italian 2%
- Foreign-born
- 4% · Canada
- Languages at home
- 94% English-only · Spanish 2% Arabic 1% Tagalog/Filipino 1%
Political lean MEDSL · Montgomery
- 2024 margin
- Toss-up / Even · D 49.8% · R 49.3%
- 2008→2024 swing
- -5.8pp toward R · 2008: 6.2pp · 2024: 0.5pp
- All cycles
- 2024: D+0.5 2020: D+2.2 2016: R+1.2 2012: D+3.1 2008: D+6.2
Not yet ingested
- Civics
- —
Market trends
- HPI YoY
- ▼ -142.46%
- Current HPI
- 183.1124
- Rent YoY
- ▲ 7.41%
- Metro
- Dayton-Kettering, OH
- State GDP YoY
- ▲ 1.98%
- F500 in state
- 48
Industry mix (Fortune 500 HQ in OH)
| Industry | F500 HQs | Revenue |
|---|---|---|
| Insurance | 3 | $145B |
|
||
| Industrial Machinery | 3 | $49B |
|
||
| Financial Services | 3 | $24B |
|
||
| Consumer Goods | 2 | $93B |
|
||
| Aerospace / Defense | 2 | $47B |
|
||
| Utilities | 2 | $33B |
|
||
Price history
-3.3% since first listed2 events — show timeline
- 2026-05-22 Price Changed $145,000 Dayton MLS
- 2026-05-08 Listed $150,000 Dayton MLS
Property tax history
+3.9%/yrLatest (2025): $1,291 · -4.5% YoY. Source: county tax records.
Cash-flow waterfall
monthlySold comps — $/sqft
last 12 mo · ≤1 miLoading sold comps…