1700 Dover Rd Unit 113-a · Delray Beach, FL
Flood risk 1/10 · Minimal
- FEMA flood zone
- X (unshaded)
- Chance of flooding over 30 yrs
- 0.0%
- Est. flood insurance / yr
- $507 – $1,088
Fire risk 1/10 · Minimal
- Est. fire insurance / yr
- $947 – $1,759
Heat risk 10/10 · Severe
- Hot days now (above 106°F)
- 7 days/yr
- Hot days in 30 yrs
- 27 days/yr
Wind risk 10/10 · Severe
- Chance of severe wind over 30 yrs
- 99.0%
Air-quality risk 3/10 · Minor
- Unhealthy air days now
- 2 days/yr
- Unhealthy air days in 30 yrs
- 3 days/yr
Risk factors via First Street. Map © Google.
Why this score? — see what drove the D grade
The composite is a weighted blend of 9 inputs, each scored 0–100. Each bar is that input's sub-score; the figure is the points it added to the 100-point composite (weight × sub-score).
- Cash flow +10.8/30.0
- ARV discount +7.5/15.0
- 1% rule +6.6/10.0
- Schools +4.3/10.0
- Livability +3.9/5.0
- DSCR +3.1/10.0
- Rent growth +3.0/5.0
- Condition / age +2.5/5.0
- Appreciation +0.0/10.0
$205,000
🖨 Deal sheet (PDF) 📄 Offer letter ✓ Due diligence
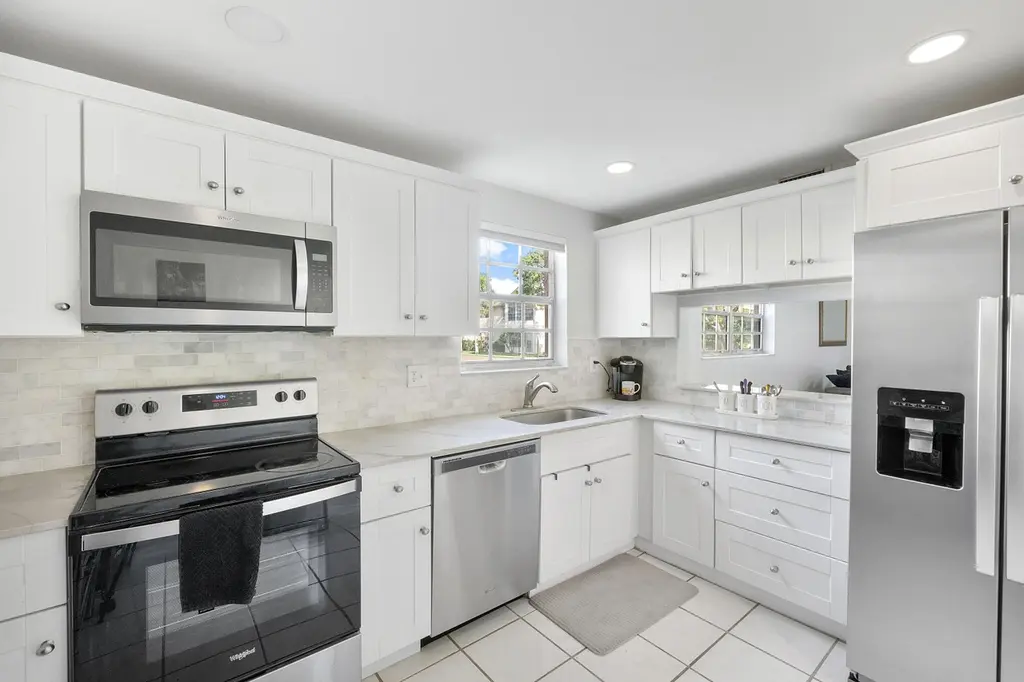
Listing remarks
NEW 2025 A/C HANDLER AND CONDENSER, 2022 W/ H, NEW PVC PLUMBING IN BATHROOMS. 2014 ROOF (per association) NO W/ D IN UNIT. Beautifully maintained 2BR/2BA corner condo in a peaceful all-age Delray Beach community. Bright, spacious layout with extra privacy and natural light. LOW HOA. Prime location just minutes to Delray Beach, Atlantic Ave dining and nightlife, Pineapple Grove Arts District, Delray Medical Center and a short drive to the Universities. Public golf course nearby and great walkability with a pleasant walking area within the community. Community amenities include an updated pool, basketball courts, and tennis court. Laundry is on-site (not in-unit). Ideal for full-time living,
Key facts
- $512 HOA
- Parking
- Community pool
Property features AI
Finance
- Other: Association fee covers cable TV, insurance, grounds maintenance, trash, and common real estate tax
- Financial info: Pets allowed (restrictions possible)
- HOA & community: Monthly association fee; Association amenities include pool, clubhouse, tennis courts, basketball court, golf course access, sauna, picnic area, community room, storage, parking, laundry, sidewalks
Exterior
- Parking: Assigned parking; Guest parking; Open parking; 1 parking space
- Security: Smoke detectors
- Utilities: Public water; Public sewer; Sewer available; Water available
- Home design: Condominium; Resale property; Entry-level living area; Faces south; 2 total stories
- Construction: Built with CBS construction; Flat roof; Mansard roof
- Exterior features: Covered patio; Screened patio; Patio; Glass-enclosed patio; Not waterfront
Interior
- Kitchen: Disposal; Dishwasher; Electric range; Microwave; Refrigerator
- Bedrooms: 2 bedrooms on the main level
- Flooring: Laminate flooring; Tile flooring
- Bathrooms: 2 full bathrooms on the main level
- Heating & cooling: Central heating; Central air conditioning; Ceiling fans
- Interior features: Walk-in closets; Stacked bedroom layout
- Laundry & utility: Common area laundry
Neighborhood map
What this means for you Summary
Snapshot
- This is a 2-bed/2.0-bath condo listed at $205k.
Deal economics
- At list price, monthly cash flow is $-95 ($-1k/yr) — negative.
- To cash-flow at today's rent, offer at most $188k (8.2% below list).
- Meets the 1% rule at list price ($2k rent vs $205k).
- Recommended offer: $188k (8.2% below list) — sets the bar for cash-flow.
- Cap rate 5.7% vs local median 4.3% in Delray Beach — top-decile yield for the area; either an underpriced asset or a hidden risk that comps aren't pricing in. Stress-test before assuming the spread holds.
Location & tenants
- Location reads 77/100 on livability (#202 in FL, #3,160 nationally) — a middle-class / working-renter tenant base. Strengths: housing A+, health & safety A+, commute A-; Watch: cost of living C-, crime D-, amenities F.
- Palm Beach (suburban): math 46% / reading 53% proficiency, ranked #34 of 73 in FL (top 47%) — families likely to look elsewhere, expect single-tenant / working-renter base with shorter leases.
- Zoned schools: Orchard View Elementary School (math 48% / reading 47%, grade D, #1,182 of 2,144 statewide, top 55%, 596 students, 76% FRL); Carver Middle School (math 22% / reading 34%, grade F, #486 of 571 statewide, top 86%, 732 students, 73% FRL); Atlantic High School (math 28% / reading 52%, grade F, #296 of 667 statewide, top 45%, 1,889 students, 59% FRL) — zoned schools average 69% FRL vs 52% district-wide (17 pts higher); higher-poverty schools than district average — tighter screening recommended.
- Market conditions: Rents rising (+1.8%/yr); 359 active listings in the ZIP; 40 comparable units currently listed for rent nearby; rentals at typical pace (median 26d on market — plan ~3-4 weeks tenant-placement turnaround); solid renter incomes; 3,974 units permitted in Palm Beach County in 2024 (1,012 in 5+ unit buildings).
- This rent runs 37% of the median local income ($78k/yr) — at the standard rent-burdened threshold; future hikes will face affordability resistance.
Forward outlook
- Local home prices are declining (-3.0%/yr); year-one equity from $1k of loan paydown is wiped out by about $6k of value loss. Plan a longer hold.
- Palm Beach County population projected at +30% by 2050 — long-run rental-demand tailwind backs the buy-and-hold thesis.
Negotiation context
- It's been on market 79 days — a 6% lower offer ($193k) is reasonable based on typical stale-listing flexibility.
- 8 sale attempts since 10y ago with the ask held roughly flat each time — persistent listings suggest the price (not the market) is what's stuck; bring a comps-based counter.
Risks & watch-outs
- Watch-outs: HOA is 22% of rent.
- Climate carrying-cost: severe wind risk, 99% chance of damaging wind over 30y; extreme-heat days projected 7→27/yr by 2055 (HVAC capex compounding) — expect insurance premiums to compound above CPI over the hold.
Questions for the listing agent
- What do current leases actually rent for vs. the listed asking? Can we see a recent rent roll and the last 12 months of T-12 income?
- It's been on market 79 days. Have you received any prior offers? Is the seller open to a 8% concession, seller financing, or rate buy-down credit?
- What does the HOA fee cover, when was the last increase, and are there any pending special assessments or reserve-fund shortfalls?
- Any open or pending special assessments — roof, HVAC, plumbing, elevator, façade? What's the per-unit balance and payoff schedule, and is the seller paying it off at close or rolling it to the buyer?
- Why hasn't it sold? Are there any deal-killer items the seller is aware of (foundation, flood, title, zoning, code violations)?
- Is there a deadline driving the sale (1031 exchange, divorce, estate, relocation)? That informs how much negotiation room exists.
- Schools are B-rated — typically a magnet for longer-tenancy family renters. What's the average tenant stay here, and is there a school-zone premium baked into asking?
- Crime grade is D in this area — have there been break-ins, vandalism, or insurance claims at this property in the last 3 years? What carrier currently insures it and at what premium?
- The area grade is low — what's the realistic commute time and amenity access for the typical tenant pool here? Any planned neighborhood developments (good or bad) we should know about?
- What's the average days-on-market for RENTAL listings here right now (not sales)? A rising rental-DOM trend means longer vacancies and softer asking-rent achievability than the comps imply.
- What's the recent tenant-quality profile in this submarket — average credit score on applications, eviction rate, late-payment / NSF rate, and stable-employment percentage? A property-management company in the area should have these aggregated.
- How much new apartment / multifamily construction is in the pipeline within 1–3 miles? Heavy new supply (>2% of stock underway) typically softens rents 12–24 months out; light construction supports rent growth.
Investment metrics
- 1% rule
- 1.16% ✓
- Cap rate
- 5.74%
- Cash-on-cash
- -1.99%
- DSCR
- 0.91
- GRM
- 7.2
CMA / ARV
No comps found within radius.
Projected returns pro-forma
-3.0% appreciation · 1.83% rent growth · sell at horizon
- IRR
- -21.2%
- Equity multiple
- 0.27×
- Total profit
- $-41,671
- Equity at exit
- $30,566
- IRR
- -18.5%
- Equity multiple
- 0.07×
- Total profit
- $-53,655
- Equity at exit
- $17,725
Cash invested: $57,400 (down + closing). Projections, not guarantees.
Landlord ↔ Tenant lean methodology
- Overall (STATE)
- 87 Strongly Landlord-Friendly
- State Florida
- 87 Strongly Landlord-Friendly · R+3
- County
- — inherits STATE
- City
- — inherits STATE
ZIP-level market 33445
- Rents YoY
- 1.8%
- Active inventory
- 359
- Price-to-rent
- 7.2×
Monthly cashflow live
- Estimated rent
- $2,381 high interval (Pro) →
- Mortgage (P&I)
- −$1,075
- Tax from tax record
- −$304 /mo · $3,647/yr
- Insurance
- −$85
- HOA
- −$512
- Vacancy / Maint / Mgmt
- −$500
- Net cashflow
- $-95
Break-even live
Sensitivity live
| Price | -10% $21 | -5% $-37 | +0% $-95 | +5% $-153 | +10% $-211 |
|---|---|---|---|---|---|
| Rent | -10% $-283 | -5% $-189 | +0% $-95 | +5% $-1 | +10% $93 |
| Rate | -1.0pp $8 | -0.5pp $-43 | base $-95 | +0.5pp $-148 | +1.0pp $-202 |
UW: 25.0% down · 7.5% · 30yr · 1.5% tax · 5.0% vac · 8.0% maint · 8.0% mgmt
Financing live
Cash to close
- Down payment
- $51,250
- Closing costs
- $6,150
- Reserves months
- —
- Total cash needed
- —
Loan-product check · same deal, 3 products live
Conventional
25% down · 7.5% · 30yr
- Down + closing
- —
- Monthly P&I
- —
- Monthly cashflow
- —
- DSCR
- —
- Eligible?
- —
Personal DTI + credit; lowest rate.
DSCR
20% down · 8.5% · 30yr
- Down + closing
- —
- Monthly P&I
- —
- Monthly cashflow
- —
- DSCR
- —
- Eligible?
- —
No personal income docs; deal must DSCR.
Hard money
10% down · 12.0% · 12mo
- Down + closing
- —
- Monthly P&I
- —
- Monthly cashflow
- —
- DSCR
- —
- Eligible?
- —
Short-term bridge; refi at stabilization.
Rent comps 40 comps
| Address | Beds | Baths | Sqft | Rent | $/sqft | DOM | Units | Dist |
|---|---|---|---|---|---|---|---|---|
| 3001 San Clara Dr Unit 4A Delray Beach, FL | 2.0 | 2.5 | 1500 | $2,250 | $1.50 | 16d | 1 | 0.09mi |
| 3118 Spanish Wells Dr Unit 15B Delray Beach, FL | 2.0 | 2.5 | 1230 | $2,650 | $2.15 | 26d | 1 | 0.14mi |
| 1825 Palm Cove Blvd Unit 7-105 Delray Beach, FL | 2.0 | 2.0 | 946 | $2,200 | $2.33 | 16d | 1 | 0.18mi |
| 3301 Spanish Wells Dr Unit D Delray Beach, FL | 2.0 | 2.5 | 1400 | $2,400 | $1.71 | 26d | 1 | 0.18mi |
| 1740 Palm Cove Blvd Apt 103 Delray Beach, FL | 3.0 | 2.0 | 1065 | $2,900 | $2.72 | 26d | 1 | 0.19mi |
| 1760 Palm Cove Blvd Unit 5-203 Delray Beach, FL | 2.0 | 2.0 | 992 | $2,200 | $2.22 | 26d | 1 | 0.19mi |
| 1760 Palm Cove Blvd Unit 5-203 Delray Beach, FL | 2.0 | 2.0 | 993 | $2,200 | $2.22 | 15d | 1 | 0.19mi |
| 1845 Palm Cove Blvd Unit 8-103 Delray Beach, FL | 3.0 | 2.0 | 1065 | $2,500 | $2.35 | 20d | 1 | 0.20mi |
| 3216 Spanish Wells Dr Unit 26D Delray Beach, FL | 2.0 | 2.5 | 1232 | $2,400 | $1.95 | 26d | 1 | 0.21mi |
| 1705 Palm Cove Blvd Apt 302 Delray Beach, FL | 1.0 | 1.0 | 934 | $2,000 | $2.14 | 26d | 1 | 0.23mi |
| 2730 SW 13th St #203 Delray Beach, FL | 2.0 | 2.0 | 1084 | $2,200 | $2.03 | 26d | 1 | 0.25mi |
| 1725 Palm Cove Blvd Unit 2-306 Delray Beach, FL | 1.0 | 1.0 | 934 | $2,100 | $2.25 | 22d | 1 | 0.26mi |
| 2835 SW 13th St #201 Delray Beach, FL | 2.0 | 2.0 | 1144 | $1,975 | $1.73 | 20d | 1 | 0.26mi |
| 1885 Palm Cove Blvd Unit 10-203 Delray Beach, FL | 2.0 | 2.0 | 992 | $2,300 | $2.32 | 6d | 1 | 0.27mi |
| 1850 Homewood Blvd #2070 Delray Beach, FL | 2.0 | 2.0 | 1090 | $2,550 | $2.34 | 26d | 1 | 0.29mi |
| 2070 Homewood Blvd #3150 Delray Beach, FL | 2.0 | 2.0 | 1090 | $2,350 | $2.16 | 16d | 1 | 0.30mi |
| 2070 Homewood Blvd #214 Delray Beach, FL | 2.0 | 2.0 | 1155 | $2,350 | $2.03 | 26d | 1 | 0.31mi |
| 2715 Ponce de Leon Blvd Delray Beach, FL | 2.0 | 1.0 | 1000 | $2,200 | $2.20 | 26d | 1 | 0.35mi |
| 1141 Calamondin Ter #203 Delray Beach, FL | 2.0 | 2.0 | 1167 | $1,700 | $1.46 | 26d | 1 | 0.36mi |
| 1121 Cactus Ter #202 Delray Beach, FL | 2.0 | 2.0 | 1167 | $2,100 | $1.80 | 26d | 1 | 0.37mi |
| 2731 Knight Ln Delray Beach, FL | 2.0 | 2.0 | 1050 | $2,650 | $2.52 | 26d | 1 | 0.38mi |
| 2520 Black Olive Blvd #203 Delray Beach, FL | 2.0 | 2.0 | 1167 | $1,799 | $1.54 | 26d | 1 | 0.39mi |
| 2520 Black Olive Blvd #203 Delray Beach, FL | 2.0 | 2.0 | 1167 | $1,799 | $1.54 | 6d | 1 | 0.39mi |
| 1101 Cactus Ter #203 Delray Beach, FL | 2.0 | 2.0 | 1167 | $2,100 | $1.80 | 19d | 1 | 0.39mi |
| 1130 Cactus Ter Unit 45C Delray Beach, FL | 2.0 | 1.5 | 982 | $2,000 | $2.04 | 26d | 1 | 0.42mi |
| 2756 Carnation Ct Delray Beach, FL | 2.0 | 2.0 | 1407 | $3,200 | $2.27 | 21d | 1 | 0.43mi |
| 1120 Homewood Blvd Unit G204 Delray Beach, FL | 2.0 | 2.0 | 1247 | $2,550 | $2.04 | 21d | 1 | 0.44mi |
| 2736 Carnation Ct Delray Beach, FL | 3.0 | 2.0 | 1496 | $3,400 | $2.27 | 7d | 1 | 0.45mi |
| 2736 Carnation Ct Delray Beach, FL | 3.0 | 2.0 | 1496 | $3,400 | $2.27 | 24d | 1 | 0.45mi |
| 2450 Black Olive Blvd Unit A Delray Beach, FL | 2.0 | 2.0 | 1167 | $1,950 | $1.67 | 16d | 1 | 0.46mi |
| 2450 Black Olive Blvd Unit A Delray Beach, FL | 2.0 | 2.0 | 1167 | $1,950 | $1.67 | 26d | 1 | 0.46mi |
| 1060 Homewood Blvd Unit J102 Delray Beach, FL | 2.0 | 2.0 | 1247 | $2,450 | $1.96 | 22d | 1 | 0.48mi |
| 2733 Zorno Way Delray Beach, FL | 2.0 | 2.0 | 1245 | $2,950 | $2.37 | 21d | 1 | 0.48mi |
| 1021 Flame Vine Ave Delray Beach, FL | 2.0 | 2.0 | 1167 | $1,750 | $1.50 | 26d | 1 | 0.49mi |
| 1100 Boxwood Dr #101 Delray Beach, FL | 2.0 | 2.0 | 1167 | $1,800 | $1.54 | 16d | 1 | 0.51mi |
| 2520 Pansy Ln Unit D Delray Beach, FL | 2.0 | 2.0 | 1167 | $2,150 | $1.84 | 26d | 1 | 0.51mi |
| 2480 Juniper Dr #203 Delray Beach, FL | 2.0 | 2.0 | 1167 | $1,900 | $1.63 | 26d | 1 | 0.52mi |
| 2480 Juniper Dr #204 Delray Beach, FL | 2.0 | 2.0 | 1167 | $1,750 | $1.50 | 26d | 1 | 0.52mi |
| 1001 Flame Vine Ave #202 Delray Beach, FL | 2.0 | 2.0 | 1167 | $2,800 | $2.40 | 26d | 1 | 0.52mi |
| 2521 Pansey Ln Unit 7A Delray Beach, FL | 2.0 | 2.0 | 1167 | $2,100 | $1.80 | 26d | 1 | 0.53mi |
HOA detail condo
- Monthly dues
- $512 · $6,144/yr
- Likely covers
- pool
- Assessments
- None detected in remarks — confirm with the listing agent.
Listing history 47 events
-
2026-06-21days on market $205,000 Active 79 DOM
-
2026-06-18days on market $205,000 Active 76 DOM
-
2026-06-17days on market $205,000 Active 75 DOM
-
2026-06-16days on market $205,000 Active 74 DOM
-
2026-06-15days on market $205,000 Active 73 DOM
-
2026-06-13days on market $205,000 Active 71 DOM
-
2026-06-09days on market $205,000 Active 67 DOM
-
2026-06-08days on market $205,000 Active 66 DOM
-
2026-06-07days on market $205,000 Active 65 DOM
-
2026-06-04days on market $205,000 Active 62 DOM
-
2026-06-03days on market $205,000 Active 61 DOM
-
2026-06-02days on market $205,000 Active 60 DOM
-
2026-06-01days on market $205,000 Active 59 DOM
-
2026-05-31days on market $205,000 Active 58 DOM
-
2026-05-13price $205,000
-
2026-04-01$210,000 Active
-
2026-03-31historical
-
2025-12-04price $215,000
-
2025-09-04$225,000 Active
-
2025-08-01historical
-
2025-04-30price $234,000
-
2025-02-01price $244,902
-
2025-01-08$249,900 Active
-
2025-01-01historical
-
2024-11-02price $249,900
-
2024-08-01$255,000 Active
-
2022-05-24soldstatus $230,000
-
2022-05-16soldstatus $230,000 Closed
-
2022-03-19historical Active Under Contract
-
2022-03-18$230,000 Active
-
2021-05-12soldstatus $149,000
-
2021-04-22soldstatus $149,000 Closed
-
2021-03-18status Pending
-
2021-03-04$155,000 Active
-
2021-03-04historical $155,000
-
2019-04-18soldstatus $112,000
-
2019-04-15soldstatus $112,000 Closed
-
2019-03-30status Pending
-
2019-03-28price $119,900
-
2019-03-13price $124,900
-
2019-01-14$129,900 Active
-
2016-11-09soldstatus $100,000
-
2016-10-28soldstatus $100,000 Closed
-
2016-09-27status Pending
-
2016-09-20price $108,900
-
2016-08-09$114,900 Active
-
1996-06-10soldstatus $42,000
ⓘ Source: listings_history table (triggers on properties + properties_extension) + one-shot
backfill from property_details.listing_events for pre-trigger history.
Tax reassessment forecast FL · Resets to sale price
- Current annual tax
- $3,647 · $304/mo
- Projected year-2 tax
- $3,647 · $304/mo
- Expected delta
- $0/yr ($0/mo · 0.0%)
ⓘ Screening estimate from a state-policy table — verify with the county assessor before closing.
Climate risk First Street
- Flood 1/10 Low FEMA zone X (unshaded) · 0% chance over 30 yrs
- Wildfire 1/10 Low
- Heat 10/10 Extreme 7 d/yr ≥106°F today · 27 d/yr by 30 yrs out
- Wind 10/10 Extreme 99% chance of damaging wind over 30 yrs
- Air quality 3/10 Moderate 2 unhealthy d/yr today · 3 by 30 yrs out
Nearby sold comps map
Loading sold comps map…
Walkable amenities ~0.75 mi
Loading nearby amenities…
Taxation est. · year 1
- Rental income
- $28,576
- − Mortgage interest
- −$11,483
- − Property taxes
- −$3,647
- − Insurance
- −$1,025
- − Repairs & maintenance
- −$2,286
- − Management
- −$2,286
- − HOA
- −$6,144
- − Depreciation
- −$5,964
- Taxable loss
- −$4,260
- Est. tax savings @ 24.0%
- +$1,022
- After-tax cash flow
- $-120/yr
For passive investors: Depreciation is non-cash, so a rental often shows a tax loss while cash-flowing — sheltering income. Rental losses are passive: they offset passive income freely, and up to $25,000/yr can offset ordinary (W-2) income if you actively participate and your MAGI is under $100k (phasing out to $0 by $150k); unused losses carry forward. On sale, claimed depreciation is recaptured at up to 25%, and gains may owe capital-gains tax (a 1031 exchange can defer both). Figures are a year-1 estimate at your 24.0% rate — not tax advice; consult a CPA.
Schools (NCES district)
- District
- Palm Beach
- NCES district ID
- 1201500
- Math proficiency
- 46% ▼ -16.00%
- Reading proficiency
- 53% ▼ -4.00%
- Median HH income
- $53,943
- Composite
- 42.72/100
- National rank
- #3160
- State rank
- #34 of 73 in FL
Livability — Delray Beach
- Score
- 77/100
- State rank
- #202
- US rank
- #3160
Category grades
Schools grade is shown separately in the Schools card above.
Census & demographics
- Census place
- Delray Beach, FL
- County
- Palm Beach County · 1,438,312 people
- City population
- 123,167
- Metro
- Miami-Fort Lauderdale-Pompano Beach, FL
- Population (ZIP)
- 33,122
- Household income
- $78,163
- Rent vs Own
- Severe rent burden
- 1649.0
Population outlook (Palm Beach County) Hauer SSP2
- Today (2025)
- 1,637,487 people
- By 2030
- 1,743,255 · +6.5%
- By 2040
- 1,948,712 · +19.0%
- By 2050
- 2,132,979 · +30.3%
- By 2075
- 2,530,027 · +54.5%
- By 2100
- 2,706,979 · +65.3%
Race, ethnicity, and origin ACS 2023
- Neighborhood character
- Diverse neighborhood (Simpson 0.62)
- Race & ethnicity
- White 55% Black 24% Hispanic / Latino 11% Two or more races 11% Asian 4%
- Hispanic origin (detail)
- Puerto Rican 3% Cuban 2%
- Common ancestry
- Hispanic 14% Romanian 3% Scotch-Irish 3%
- Foreign-born
- 27% · Canada, Jamaica, Dominican Republic
- Languages at home
- 66% English-only · French/Haitian/Cajun 18% Spanish 9% Other Indo-European 4%
Political lean MEDSL · Palm Beach
- 2024 margin
- Toss-up / Even · D 50.0% · R 49.2%
- 2008→2024 swing
- -22.1pp toward R · 2008: 22.9pp · 2024: 0.8pp
- All cycles
- 2024: D+0.8 2020: D+12.8 2016: D+15.3 2012: D+17.0 2008: D+22.9
Not yet ingested
- Civics
- —
Market trends
- HPI YoY
- ▼ -258.16%
- Current HPI
- 349.5505
- Rent YoY
- ▲ 1.83%
- Metro
- Miami-Fort Lauderdale-Pompano Beach, FL
- State GDP YoY
- ▲ 3.28%
- F500 in state
- 36
Industry mix (Fortune 500 HQ in FL)
| Industry | F500 HQs | Revenue |
|---|---|---|
| Industrial Technology | 2 | $29B |
|
||
| Insurance | 2 | $17B |
|
||
| Retail | 1 | $60B |
|
||
| Technology Distribution | 1 | $58B |
|
||
| Homebuilding | 1 | $35B |
|
||
| Technology Manufacturing | 1 | $35B |
|
||
Price history
+388.1% since first listed33 events — show timeline
- 2026-05-13 Price Changed $205,000 Beaches MLS
- 2026-04-01 Listed $210,000 Beaches MLS
- 2026-03-31 Listing Removed — Beaches MLS
- 2025-12-04 Price Changed $215,000 Beaches MLS
- 2025-09-04 Listed $225,000 Beaches MLS
- 2025-08-01 Listing Removed — Beaches MLS
- 2025-04-30 Price Changed $234,000 Beaches MLS
- 2025-02-01 Price Changed $244,902 Beaches MLS
- 2025-01-08 Listed $249,900 Beaches MLS
- 2025-01-01 Listing Removed — Beaches MLS
- 2024-11-02 Price Changed $249,900 Beaches MLS
- 2024-08-01 Listed $255,000 Beaches MLS
- 2022-05-24 Sold (Public Records) $230,000 Public Records
- 2022-05-16 Sold (MLS) $230,000 Beaches MLS
- 2022-03-19 Contingent — Beaches MLS
- 2022-03-18 Listed $230,000 Beaches MLS
- 2021-05-12 Sold (Public Records) $149,000 Public Records
- 2021-04-22 Sold (MLS) $149,000 Beaches MLS
- 2021-03-18 Pending — Beaches MLS
- 2021-03-04 Listed $155,000 Beaches MLS
- 2021-03-04 Coming Soon $155,000 Beaches MLS
- 2019-04-18 Sold (Public Records) $112,000 Public Records
- 2019-04-15 Sold (MLS) $112,000 Beaches MLS
- 2019-03-30 Pending — Beaches MLS
- 2019-03-28 Price Changed $119,900 Beaches MLS
- 2019-03-13 Price Changed $124,900 Beaches MLS
- 2019-01-14 Listed $129,900 Beaches MLS
- 2016-11-09 Sold (Public Records) $100,000 Public Records
- 2016-10-28 Sold (MLS) $100,000 Beaches MLS
- 2016-09-27 Pending — Beaches MLS
- 2016-09-20 Price Changed $108,900 Beaches MLS
- 2016-08-09 Listed $114,900 Beaches MLS
- 1996-06-10 Sold (Public Records) $42,000 Public Records
Property tax history
+8.2%/yrLatest (2025): $3,647 · -9.0% YoY. Source: county tax records.
Cash-flow waterfall
monthlySold comps — $/sqft
last 12 mo · ≤1 miLoading sold comps…