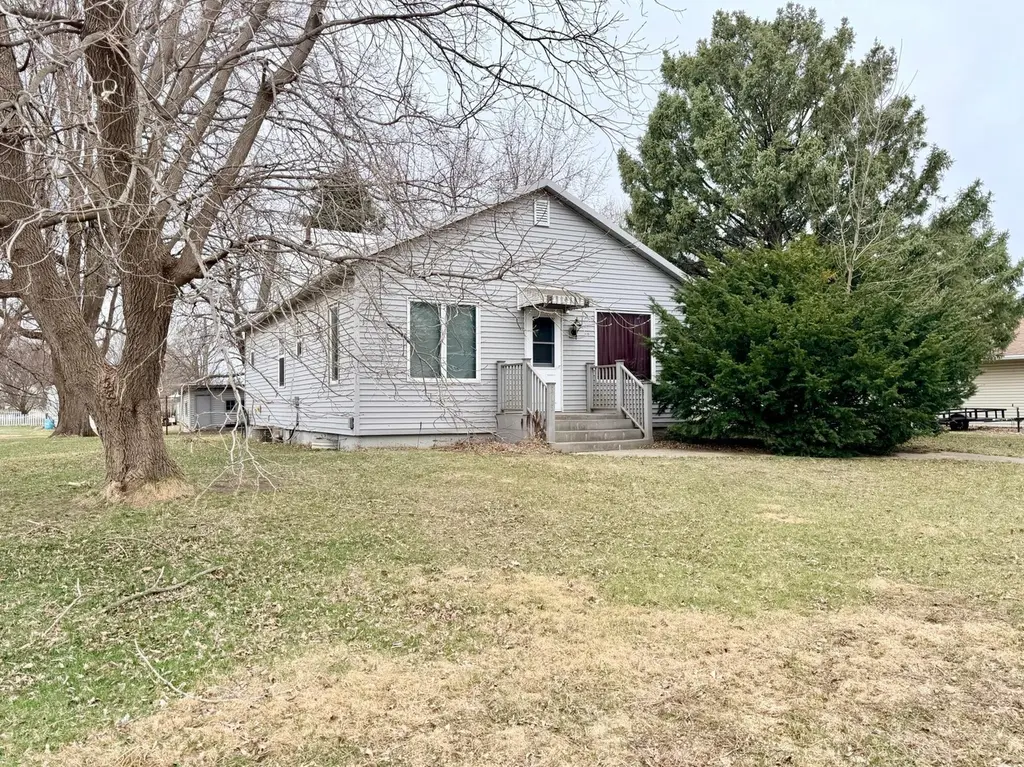
313 8th St · Brewster, MN
Flood risk 1/10 · Minimal
- FEMA flood zone
- X (unshaded)
- Chance of flooding over 30 yrs
- 0.0%
- Est. flood insurance / yr
- $473 – $860
Fire risk 1/10 · Minimal
- Est. fire insurance / yr
- $888 – $1,650
Heat risk 2/10 · Minimal
- Hot days now (above 97°F)
- 7 days/yr
- Hot days in 30 yrs
- 15 days/yr
Wind risk 2/10 · Minimal
- Chance of severe wind over 30 yrs
- —
Air-quality risk 2/10 · Minimal
- Unhealthy air days now
- 1 days/yr
- Unhealthy air days in 30 yrs
- 1 days/yr
Risk factors via First Street. Map © Google.
Why this score? — see what drove the C grade
The composite is a weighted blend of 9 inputs, each scored 0–100. Each bar is that input's sub-score; the figure is the points it added to the 100-point composite (weight × sub-score).
- Cash flow +16.9/30.0
- Appreciation +7.6/10.0
- ARV discount +7.5/15.0
- DSCR +5.3/10.0
- Schools +5.0/10.0
- 1% rule +4.4/10.0
- Livability +3.5/5.0
- Rent growth +2.5/5.0
- Condition / age +2.5/5.0
$110,000
🖨 Deal sheet 📄 Offer letter ✓ Due diligence
Listing remarks
Opportunity knocks with this classic A-frame home featuring convenient one-level living. Offering 2 bedrooms and 1 bath, this property is the perfect canvas for buyers looking to add their own style and value. The spacious lot provides plenty of room to expand, garden, or simply enjoy the space, while the detached double garage and storage shed add practical functionality. Finished with low-maintenance vinyl siding, this home is a smart investment with strong upside potential.
Key facts
- 0.23 acre lot
- 2 garage spots
- Built 1920
Property features AI
Exterior
- Parking: Detached 2-car garage (20 x 22)
- Utilities: City water connected; City sewer connected; Natural gas
- Home design: Residential property; One story; Block foundation; Asphalt roof
- Construction: Block foundation; Vinyl siding; Asphalt roof
- Exterior features: Vinyl exterior; Storage shed; City street frontage, public maintained road; Lot approximately 0.23 acres (62 x 159)
Interior
- Bedrooms: 2 bedrooms
- Bathrooms: 1 full bathroom
- Heating & cooling: Forced air heating; Central air conditioning
- Interior features: Full basement
Neighborhood map
What this means for you Summary
Snapshot
- This is a 2-bed/1.0-bath single-family listed at $110k.
Deal economics
- At list price, monthly cash flow is $73 ($879/yr) — positive.
- The deal already cash-flows at list — no discount required.
- To meet the 1% rule (rent ≥ 1% of price), the offer needs to be $103k (6.1% below list).
- Recommended offer: $103k (6.1% below list) — sets the bar for 1% rule.
Location & tenants
- Location reads 69/100 on livability (#384 in MN) — a middle-class / working-renter tenant base. Strengths: cost of living A+, housing A+; Watch: crime D+, health & safety D+, schools D.
- Market conditions: 7 active listings in the ZIP; 19 units permitted in Nobles County in 2024 (0 in 5+ unit buildings).
Forward outlook
- In year one you build about $6k of equity ($761 loan paydown + $6k appreciation (5.1% local appreciation)).
- Nobles County population projected at +20% by 2050 — long-run rental-demand tailwind backs the buy-and-hold thesis.
- At projected returns (5.1% appreciation + 3.0% rent growth), your $31k cash investment doubles in ~4 years — after that, you're playing with house money.
- By year 6, paydown + projected appreciation supports a ~$34k cash-out refi (75% LTV) — recoverable capital for the next deal without selling this one.
Negotiation context
- Only 11 days on market — expect competitive offers; lowballing is unlikely to land.
- Current owner paid $60k; list at $110k implies a 83% gain — meaningful room to come down on a strong offer.
Risks & watch-outs
- Watch-outs: built in 1920 — expect roof / HVAC / electrical / plumbing capex.
Questions for the listing agent
- Built in 1920 — when were the roof, HVAC, electrical panel, plumbing, and water heater last replaced?
- Is there a deadline driving the sale (1031 exchange, divorce, estate, relocation)? That informs how much negotiation room exists.
- Schools are D-rated, which usually means shorter tenancies and higher turnover. Who's the typical renter profile here, and what's been the actual vacancy rate?
- Crime grade is D in this area — have there been break-ins, vandalism, or insurance claims at this property in the last 3 years? What carrier currently insures it and at what premium?
- What's the average days-on-market for RENTAL listings here right now (not sales)? A rising rental-DOM trend means longer vacancies and softer asking-rent achievability than the comps imply.
- What's the recent tenant-quality profile in this submarket — average credit score on applications, eviction rate, late-payment / NSF rate, and stable-employment percentage? A property-management company in the area should have these aggregated.
- How much new for-sale + rental construction is in the pipeline within 1–3 miles? Heavy new supply typically softens prices + rents 12–24 months out; constrained supply supports both.
Investment metrics
- 1% rule
- 0.94% ✗
- Cap rate
- 7.09%
- Cash-on-cash
- 2.85%
- DSCR
- 1.13
- GRM
- 8.9
CMA / ARV
No comps found within radius.
Projected returns pro-forma
5.12% appreciation · 3.0% rent growth · sell at horizon
- IRR
- 15.6%
- Equity multiple
- 2.00×
- Total profit
- $30,784
- Equity at exit
- $63,144
- IRR
- 16.0%
- Equity multiple
- 3.88×
- Total profit
- $88,707
- Equity at exit
- $109,653
Cash invested: $30,800 (down + closing). Projections, not guarantees.
Landlord ↔ Tenant lean methodology
- Overall (STATE)
- 46 Balanced
- State Minnesota
- 46 Balanced · D+2
- County
- — inherits STATE
- City
- — inherits STATE
ZIP-level market 56119
- Home prices YoY
- 2.9%
- Active inventory
- 7
- Price-to-rent
- 8.9×
Monthly cashflow live
- Estimated rent
- $1,033 medium interval (Pro) →
- Mortgage (P&I)
- −$577
- Tax from tax record
- −$120 /mo · $1,444/yr
- Insurance
- −$46
- HOA
- −$0
- Vacancy / Maint / Mgmt
- −$217
- Net cashflow
- $73
Break-even live
UW: 25.0% down · 7.5% · 30yr · 1.5% tax · 5.0% vac · 8.0% maint · 8.0% mgmt
Financing live
Cash to close
- Down payment
- $27,500
- Closing costs
- $3,300
- Reserves months
- —
- Total cash needed
- —
Loan-product check · same deal, 3 products live
Conventional
25% down · 7.5% · 30yr
- Down + closing
- —
- Monthly P&I
- —
- Monthly cashflow
- —
- DSCR
- —
- Eligible?
- —
Personal DTI + credit; lowest rate.
DSCR
20% down · 8.5% · 30yr
- Down + closing
- —
- Monthly P&I
- —
- Monthly cashflow
- —
- DSCR
- —
- Eligible?
- —
No personal income docs; deal must DSCR.
Hard money
10% down · 12.0% · 12mo
- Down + closing
- —
- Monthly P&I
- —
- Monthly cashflow
- —
- DSCR
- —
- Eligible?
- —
Short-term bridge; refi at stabilization.
Listing history 4 events
-
2026-05-02status Pending
-
2026-04-22$110,000 Active
-
2026-04-02historical $110,000
-
2014-10-03soldstatus $60,000
ⓘ Source: listings_history table (triggers on properties + properties_extension) + one-shot
backfill from property_details.listing_events for pre-trigger history.
Tax reassessment forecast MN · Partial reset (capped growth)
- Current annual tax
- $1,444 · $120/mo
- Projected year-2 tax
- $1,444 · $120/mo
- Expected delta
- $0/yr ($0/mo · 0.0%)
ⓘ Screening estimate from a state-policy table — verify with the county assessor before closing.
Climate risk First Street
- Flood 1/10 Low FEMA zone X (unshaded) · 0% chance over 30 yrs
- Wildfire 1/10 Low
- Heat 2/10 Low 7 d/yr ≥97°F today · 15 d/yr by 30 yrs out
- Wind 2/10 Low
- Air quality 2/10 Low 1 unhealthy d/yr today · 1 by 30 yrs out
Nearby sold comps map
Loading sold comps map…
Walkable amenities ~0.75 mi
Loading nearby amenities…
Taxation est. · year 1
- Rental income
- $12,399
- − Mortgage interest
- −$6,162
- − Property taxes
- −$1,444
- − Insurance
- −$550
- − Repairs & maintenance
- −$992
- − Management
- −$992
- − Depreciation
- −$3,200
- Taxable loss
- −$941
- Est. tax savings @ 24.0%
- +$226
- After-tax cash flow
- $1,105/yr
For passive investors: Depreciation is non-cash, so a rental often shows a tax loss while cash-flowing — sheltering income. Rental losses are passive: they offset passive income freely, and up to $25,000/yr can offset ordinary (W-2) income if you actively participate and your MAGI is under $100k (phasing out to $0 by $150k); unused losses carry forward. On sale, claimed depreciation is recaptured at up to 25%, and gains may owe capital-gains tax (a 1031 exchange can defer both). Figures are a year-1 estimate at your 24.0% rate — not tax advice; consult a CPA.
Schools (NCES district)
No district data.
Livability — Brewster
- Score
- 69/100
- State rank
- #384
- US rank
- #9036
Category grades
Schools grade is shown separately in the Schools card above.
Census & demographics
- Census place
- Brewster, MN
- Population (ZIP)
- 1,080
Population outlook (Nobles County) Hauer SSP2
- Today (2025)
- 22,693 people
- By 2030
- 23,304 · +2.7%
- By 2040
- 25,000 · +10.2%
- By 2050
- 27,213 · +19.9%
- By 2075
- 34,196 · +50.7%
- By 2100
- 40,638 · +79.1%
Race, ethnicity, and origin ACS 2023
- Neighborhood character
- Predominantly White (66%)
- Race & ethnicity
- White 66% Hispanic / Latino 29% Two or more races 19% Asian 2% Native American 1%
- Hispanic origin (detail)
- Mexican 24%
- Common ancestry
- Portuguese 5% Iranian 2% Lithuanian 1%
- Foreign-born
- 18% · Canada, Philippines
- Languages at home
- 72% English-only · Spanish 26% Other Asian/Pacific 2%
Political lean MEDSL · Nobles
- 2024 margin
- Solid R (+35.6) · D 31.5% · R 67.1% · Other 1.4%
- 2008→2024 swing
- -34.2pp toward R · 2008: -1.4pp · 2024: -35.6pp
- All cycles
- 2024: R+35.6 2020: R+30.6 2016: R+29.9 2012: R+9.3 2008: R+1.4
Not yet ingested
- Civics
- —
Market trends
- HPI YoY
- ▲ 5.12%
- Current HPI
- 179.4036
- Rent YoY
- —
- Metro
- —
- State GDP YoY
- ▲ 2.41%
- F500 in state
- 34
Industry mix (Fortune 500 HQ in MN)
| Industry | F500 HQs | Revenue |
|---|---|---|
| Healthcare | 2 | $407B |
|
||
| Retail | 2 | $150B |
|
||
| Consumer Goods | 2 | $32B |
|
||
| Industrial Machinery | 2 | $6B |
|
||
| Agriculture | 1 | $40B |
|
||
| Healthcare / Medical Devices | 1 | $32B |
|
||
Price history
+83.3% since first listed4 events — show timeline
- 2026-05-02 Pending — NORTHSTARMLS as Distributed by MLS Grid
- 2026-04-22 Listed $110,000 NORTHSTARMLS as Distributed by MLS Grid
- 2026-04-02 Coming Soon $110,000 NORTHSTARMLS as Distributed by MLS Grid
- 2014-10-03 Sold (Public Records) $60,000 Public Records
Property tax history
+7.9%/yrLatest (2026): $1,444 · +22.4% YoY. Source: county tax records.
Cash-flow waterfall
monthlySold comps — $/sqft
last 12 mo · ≤1 miLoading sold comps…