 Duplex
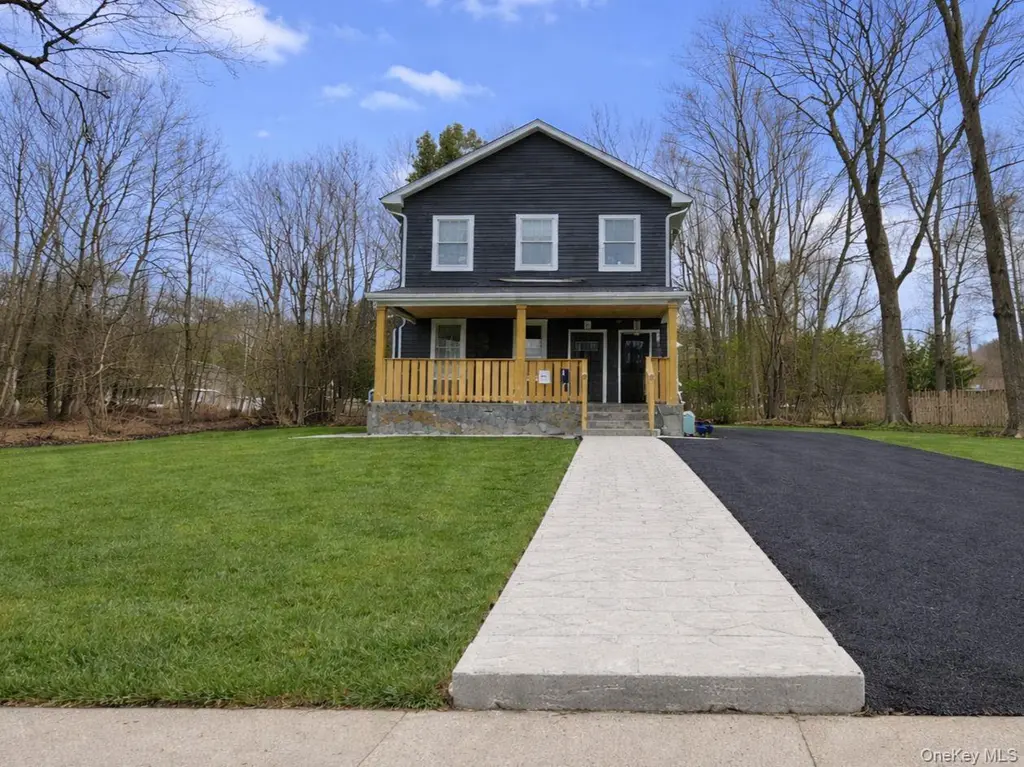
45 Clinton Ave · Monticello, NY
Flood risk 1/10 · Minimal
- FEMA flood zone
- X (unshaded)
- Chance of flooding over 30 yrs
- 0.0%
- Est. flood insurance / yr
- $507 – $1,088
Fire risk 2/10 · Minimal
- Est. fire insurance / yr
- $691 – $1,283
Heat risk 2/10 · Minimal
- Hot days now (above 92°F)
- 7 days/yr
- Hot days in 30 yrs
- 15 days/yr
Wind risk 3/10 · Minor
- Chance of severe wind over 30 yrs
- 5.0%
Air-quality risk 2/10 · Minimal
- Unhealthy air days now
- 1 days/yr
- Unhealthy air days in 30 yrs
- 1 days/yr
Risk factors via First Street. Map © Google.
Why this score? — see what drove the D- grade
The composite is a weighted blend of 9 inputs, each scored 0–100. Each bar is that input's sub-score; the figure is the points it added to the 100-point composite (weight × sub-score).
- Appreciation +10.0/10.0
- Cash flow +7.6/30.0
- ARV discount +4.8/15.0
- Livability +3.1/5.0
- Rent growth +2.5/5.0
- Schools +2.5/10.0
- Condition / age +2.5/5.0
- 1% rule +2.2/10.0
- DSCR +1.7/10.0
$575,000
🖨 Deal sheet (PDF) 📄 Offer letter ✓ Due diligence
Multi-family units
County records classify this as Multi-Family (2-4 Unit). Listing-text estimate: 2 units. confirmed
Listing remarks MLS
Welcome home to this fully renovated gem, perfectly situated in the heart of Monticello. This impressive multi-family property delivers modern finishes, generous living space, and strong income potential for investors or owner-occupants. The first-floor unit features an open layout with 3 bedrooms and 2 full baths, soaring ceilings, hardwood floors, and a designer kitchen with stainless steel appliances, granite countertops, dual sinks, and a center island, plus in-unit laundry. Unit 1 offers two separate entrances, including an additional entry that provides direct access to the spacious side yard. The upper unit offers 3–4 bedrooms with bonus space ideal for a home office, 2 full baths including an en-suite, a contemporary kitchen with granite counters, dual sinks, and a center island, in-unit laundry, and a private rear deck off the primary suite. High-end finishes continue throughout, along with attic storage and multiple mini-split systems serving both units. Outside, enjoy a newly paved driveway with parking for 4+ vehicles. A rare turnkey opportunity—schedule your private showing today!
Key facts
- 0.23 acre lot
- 4 parking spots
- Built 1942
Neighborhood map
What this means for you Summary
Snapshot
- This is a 2 × 3-bed/2-bath units multifamily listed at $575k.
Deal economics
- At list price, monthly cash flow is $-680 ($-8k/yr) — negative. Per door: $-340/mo.
- To cash-flow at today's rent, offer at most $455k (20.9% below list).
- To meet the 1% rule (rent ≥ 1% of price), the offer needs to be $414k (28.0% below list).
- Recommended offer: $414k (28.0% below list) — sets the bar for 1% rule.
- Cap rate 4.9% vs local median 3.4% in Monticello — top-decile yield for the area; either an underpriced asset or a hidden risk that comps aren't pricing in. Stress-test before assuming the spread holds.
Location & tenants
- Location reads 61/100 on livability (#899 in NY) — a middle-class / working-renter tenant base. Strengths: housing A+, cost of living A-; Watch: crime D, amenities F, commute F.
- Monticello Central School District (town): math 29% / reading 30% proficiency, ranked #577 of 590 in NY (top 98%) — low school quality limits family demand, transient renter base, plan for 1-2y turnover.
- Zoned schools: George L Cooke School (592 students, 71% FRL); Robert J Kaiser Middle School (math 7% / reading 35%, grade F, #661 of 729 statewide, top 91%, 595 students, 66% FRL); Monticello High School (math 82% / reading 34%, grade C, #879 of 1,100 statewide, top 80%, 844 students, 63% FRL) — zoned schools average 67% FRL vs 50% district-wide (16 pts higher); higher-poverty schools than district average — tighter screening recommended.
- Market conditions: 188 active listings in the ZIP; 739 units permitted in Sullivan County in 2024 (5 in 5+ unit buildings).
- At $4,140/mo this rent would consume 87% of the median local household income ($57k/yr) (locally 814% of renters already pay >50% of income on rent) — very limited rent-growth headroom before tenants either downsize or default.
Forward outlook
- In year one you build about $61k of equity ($4k loan paydown + $58k appreciation (10.0% local appreciation)).
- Sullivan County population projected at -24% by 2050 — secular population decline; favor cash flow + early exit over multi-decade hold.
- By year 2, paydown + projected appreciation supports a ~$99k cash-out refi (75% LTV) — recoverable capital for the next deal without selling this one.
Negotiation context
- It's been on market 87 days — a 6% lower offer ($540k) is reasonable based on typical stale-listing flexibility.
- 3 sale attempts since 5y ago with the ask held roughly flat each time — persistent listings suggest the price (not the market) is what's stuck; bring a comps-based counter.
- Current owner paid $32k; list at $575k implies a 1669% gain — meaningful room to come down on a strong offer.
Risks & watch-outs
- Watch-outs: built in 1942 — expect roof / HVAC / electrical / plumbing capex.
Questions for the listing agent
- What do current leases actually rent for vs. the listed asking? Can we see a recent rent roll and the last 12 months of T-12 income?
- It's been on market 87 days. Have you received any prior offers? Is the seller open to a 28% concession, seller financing, or rate buy-down credit?
- Can we see the unit-by-unit rent roll, current vacancy, and any below-market leases? What's the average tenancy length?
- What capital expenditures (roof, boiler, parking lot, exteriors) have been made in the last 5 years, and what's planned in the next 2?
- Built in 1942 — when were the roof, HVAC, electrical panel, plumbing, and water heater last replaced?
- Why hasn't it sold? Are there any deal-killer items the seller is aware of (foundation, flood, title, zoning, code violations)?
- Is there a deadline driving the sale (1031 exchange, divorce, estate, relocation)? That informs how much negotiation room exists.
- Schools are F-rated, which usually means shorter tenancies and higher turnover. Who's the typical renter profile here, and what's been the actual vacancy rate?
- Crime grade is D in this area — have there been break-ins, vandalism, or insurance claims at this property in the last 3 years? What carrier currently insures it and at what premium?
- The area grade is low — what's the realistic commute time and amenity access for the typical tenant pool here? Any planned neighborhood developments (good or bad) we should know about?
- What's the average days-on-market for RENTAL listings here right now (not sales)? A rising rental-DOM trend means longer vacancies and softer asking-rent achievability than the comps imply.
- What's the recent tenant-quality profile in this submarket — average credit score on applications, eviction rate, late-payment / NSF rate, and stable-employment percentage? A property-management company in the area should have these aggregated.
- How much new apartment / multifamily construction is in the pipeline within 1–3 miles? Heavy new supply (>2% of stock underway) typically softens rents 12–24 months out; light construction supports rent growth.
Investment metrics
- 1% rule
- 0.72% ✗
- Cap rate
- 4.87%
- Cash-on-cash
- -5.07%
- DSCR
- 0.77
- GRM
- 11.6
CMA / ARV
- ARV (median comp)
- $542,063
- List price
- $575,000
- Delta
- 6.08%
- Verdict
- FAIR
- Comps
- 11 within 1.0 mi
Show comp detail 1 sale within ~0.75 mi
| Address | Dist | Beds/Ba | Sqft | Sold | Price | $/sf | Match |
|---|---|---|---|---|---|---|---|
| 55 High St | 0.65mi | 5/4.0 (-1) | 2,687 (-2%) | 8mo | $360,000 | $134 | 54 |
Match score weights: distance 35% · size 25% · config 20% · recency 20%. Top-matched comps best support the ARV.
Projected returns pro-forma
10.0% appreciation · 3.0% rent growth · sell at horizon
- IRR
- 20.7%
- Equity multiple
- 2.68×
- Total profit
- $269,892
- Equity at exit
- $518,006
- IRR
- 18.8%
- Equity multiple
- 6.15×
- Total profit
- $828,947
- Equity at exit
- $1,117,099
Cash invested: $161,000 (down + closing). Projections, not guarantees.
Landlord ↔ Tenant lean methodology
- Overall (STATE)
- 15 Strongly Tenant-Friendly
- State New York
- 15 Strongly Tenant-Friendly · D+10
- County
- — inherits STATE
- City
- — inherits STATE
ZIP-level market 12701
- Home prices YoY
- 16.7%
- Active inventory
- 188
- Price-to-rent
- 23.1×
Monthly cashflow live
- Estimated rent
- $4,140 high interval (Pro) →
- Mortgage (P&I)
- −$3,015
- Tax from tax record
- −$696 /mo · $8,349/yr
- Insurance
- −$240
- HOA
- −$0
- Vacancy / Maint / Mgmt
- −$869
- Net cashflow
- $-680
Break-even live
Sensitivity live
| Price | -10% $-355 | -5% $-517 | +0% $-680 | +5% $-843 | +10% $-1,006 |
|---|---|---|---|---|---|
| Rent | -10% $-1,007 | -5% $-844 | +0% $-680 | +5% $-517 | +10% $-353 |
| Rate | -1.0pp $-391 | -0.5pp $-534 | base $-680 | +0.5pp $-829 | +1.0pp $-981 |
2-unit breakdown (identical units grouped — click to expand)
| Units | Beds | Baths | Est. rent |
|---|---|---|---|
| 2× units | 3 | 2 | $4,140 |
| #1 | 3 | 2 | $2,070 |
| #2 | 3 | 2 | $2,070 |
| Total (2 units) | $4,140 | ||
UW: 25.0% down · 7.5% · 30yr · 1.5% tax · 5.0% vac · 8.0% maint · 8.0% mgmt
Financing live
Cash to close
- Down payment
- $143,750
- Closing costs
- $17,250
- Reserves months
- —
- Total cash needed
- —
Loan-product check · same deal, 3 products live
Conventional
25% down · 7.5% · 30yr
- Down + closing
- —
- Monthly P&I
- —
- Monthly cashflow
- —
- DSCR
- —
- Eligible?
- —
Personal DTI + credit; lowest rate.
DSCR
20% down · 8.5% · 30yr
- Down + closing
- —
- Monthly P&I
- —
- Monthly cashflow
- —
- DSCR
- —
- Eligible?
- —
No personal income docs; deal must DSCR.
Hard money
10% down · 12.0% · 12mo
- Down + closing
- —
- Monthly P&I
- —
- Monthly cashflow
- —
- DSCR
- —
- Eligible?
- —
Short-term bridge; refi at stabilization.
Listing history 24 events
-
2026-06-16days on market $575,000 Active 87 DOM
-
2026-06-15days on market $575,000 Active 86 DOM
-
2026-06-14days on market $575,000 Active 84 DOM
-
2026-06-10days on market $575,000 Active 81 DOM
-
2026-06-09days on market $575,000 Active 80 DOM
-
2026-06-08days on market $575,000 Active 79 DOM
-
2026-06-07days on market $575,000 Active 78 DOM
-
2026-06-03days on market $575,000 Active 74 DOM
-
2026-06-02days on market $575,000 Active 73 DOM
-
2026-06-01days on market $575,000 Active 72 DOM
-
2026-05-31days on market $575,000 Active 71 DOM
-
2026-05-31days on market $575,000 Active 70 DOM
-
2026-03-22$575,000 Active 1122-char remark
Show marketing remark (1122 chars)
Welcome home to this fully renovated gem, perfectly situated in the heart of Monticello. This impressive multi-family property delivers modern finishes, generous living space, and strong income potential for investors or owner-occupants. The first-floor unit features an open layout with 3 bedrooms and 2 full baths, soaring ceilings, hardwood floors, and a designer kitchen with stainless steel appliances, granite countertops, dual sinks, and a center island, plus in-unit laundry. Unit 1 offers two separate entrances, including an additional entry that provides direct access to the spacious side yard. The upper unit offers 3–4 bedrooms with bonus space ideal for a home office, 2 full baths including an en-suite, a contemporary kitchen with granite counters, dual sinks, and a center island, in-unit laundry, and a private rear deck off the primary suite. High-end finishes continue throughout, along with attic storage and multiple mini-split systems serving both units. Outside, enjoy a newly paved driveway with parking for 4+ vehicles. A rare turnkey opportunity—schedule your private showing today!
-
2026-03-16historical $575,000 1122-char remark
Show marketing remark (1122 chars)
Welcome home to this fully renovated gem, perfectly situated in the heart of Monticello. This impressive multi-family property delivers modern finishes, generous living space, and strong income potential for investors or owner-occupants. The first-floor unit features an open layout with 3 bedrooms and 2 full baths, soaring ceilings, hardwood floors, and a designer kitchen with stainless steel appliances, granite countertops, dual sinks, and a center island, plus in-unit laundry. Unit 1 offers two separate entrances, including an additional entry that provides direct access to the spacious side yard. The upper unit offers 3–4 bedrooms with bonus space ideal for a home office, 2 full baths including an en-suite, a contemporary kitchen with granite counters, dual sinks, and a center island, in-unit laundry, and a private rear deck off the primary suite. High-end finishes continue throughout, along with attic storage and multiple mini-split systems serving both units. Outside, enjoy a newly paved driveway with parking for 4+ vehicles. A rare turnkey opportunity—schedule your private showing today!
-
2025-07-24historical
-
2025-07-10price $592,999
-
2025-05-07$599,999 Active
-
2022-03-09historical
-
2022-01-28price $150,500
-
2021-12-01price $119,950
-
2021-09-09$99,950 Active
-
2017-08-29soldstatus $32,500
-
2006-05-22soldstatus $240,625
-
1989-01-27soldstatus $80,000
ⓘ Source: listings_history table (triggers on properties + properties_extension) + one-shot
backfill from property_details.listing_events for pre-trigger history.
Tax reassessment forecast NY · Partial reset (capped growth)
- Current annual tax
- $8,349 · $696/mo
- Projected year-2 tax
- $9,033 · $753/mo
- Expected delta
- +$684/yr (+$57/mo · 8.2%)
ⓘ Screening estimate from a state-policy table — verify with the county assessor before closing.
Climate risk First Street
- Flood 1/10 Low FEMA zone X (unshaded) · 0% chance over 30 yrs
- Wildfire 2/10 Low
- Heat 2/10 Low 7 d/yr ≥92°F today · 15 d/yr by 30 yrs out
- Wind 3/10 Moderate 5% chance of damaging wind over 30 yrs
- Air quality 2/10 Low 1 unhealthy d/yr today · 1 by 30 yrs out
Nearby sold comps map
Loading sold comps map…
Walkable amenities ~0.75 mi
Loading nearby amenities…
Taxation est. · year 1
- Rental income
- $49,680
- − Mortgage interest
- −$32,209
- − Property taxes
- −$8,349
- − Insurance
- −$2,875
- − Repairs & maintenance
- −$3,974
- − Management
- −$3,974
- − Depreciation
- −$16,727
- Taxable loss
- −$18,429
- Est. tax savings @ 24.0%
- +$4,423
- After-tax cash flow
- $-3,738/yr
For passive investors: Depreciation is non-cash, so a rental often shows a tax loss while cash-flowing — sheltering income. Rental losses are passive: they offset passive income freely, and up to $25,000/yr can offset ordinary (W-2) income if you actively participate and your MAGI is under $100k (phasing out to $0 by $150k); unused losses carry forward. On sale, claimed depreciation is recaptured at up to 25%, and gains may owe capital-gains tax (a 1031 exchange can defer both). Figures are a year-1 estimate at your 24.0% rate — not tax advice; consult a CPA.
Schools (NCES district)
- District
- Monticello Central School District
- NCES district ID
- 3619740
- Math proficiency
- 29% ▼ -4.00%
- Reading proficiency
- 30% ▼ -2.00%
- Median HH income
- $44,696
- Composite
- 25.28/100
- National rank
- #7491
- State rank
- #577 of 590 in NY
Livability — Monticello
- Score
- 61/100
- State rank
- #899
- US rank
- #17510
Category grades
Schools grade is shown separately in the Schools card above.
Census & demographics
- Census place
- Monticello, NY
- County
- Sullivan County · 12,197 people
- City population
- 12,197
- Metro
- nan
- Population (ZIP)
- 12,197
- Household income
- $57,222
- Rent vs Own
- Severe rent burden
- 814.0
Population outlook (Sullivan County) Hauer SSP2
- Today (2025)
- 68,974 people
- By 2030
- 65,609 · -4.9%
- By 2040
- 58,878 · -14.6%
- By 2050
- 52,500 · -23.9%
- By 2075
- 39,941 · -42.1%
- By 2100
- 28,880 · -58.1%
Race, ethnicity, and origin ACS 2023
- Neighborhood character
- Diverse neighborhood (Simpson 0.69)
- Race & ethnicity
- White 43% Hispanic / Latino 31% Black 15% Two or more races 15% Asian 5%
- Hispanic origin (detail)
- Mexican 1% Puerto Rican 19% Dominican 3%
- Common ancestry
- Scotch-Irish 3% Romanian 2% Iranian 1%
- Foreign-born
- 15% · Canada, China, Jamaica
- Languages at home
- 71% English-only · Spanish 20% Other Indo-European 3% Russian/Polish/Slavic 2%
Political lean MEDSL · Sullivan
- 2024 margin
- R (+16.7) · D 41.6% · R 58.4%
- 2008→2024 swing
- -26.2pp toward R · 2008: 9.5pp · 2024: -16.7pp
- All cycles
- 2024: R+16.7 2020: R+9.2 2016: R+13.7 2012: D+10.4 2008: D+9.5
Not yet ingested
- Civics
- —
Market trends
- HPI YoY
- ▲ 72.71%
- Current HPI
- 507.739
- Rent YoY
- —
- Metro
- nan
- State GDP YoY
- ▲ 2.60%
- F500 in state
- 92
Industry mix (Fortune 500 HQ in NY)
| Industry | F500 HQs | Revenue |
|---|---|---|
| Financial Services | 10 | $950B |
|
||
| Consumer Goods | 9 | $162B |
|
||
| Insurance | 4 | $225B |
|
||
| Telecommunications | 2 | $144B |
|
||
| Pharmaceuticals | 2 | $112B |
|
||
| Media / Entertainment | 2 | $69B |
|
||
Price history
+618.8% since first listed12 events — show timeline
- 2026-03-22 Listed $575,000 OneKey® MLS as Distributed by MLS Grid
- 2026-03-16 Coming Soon $575,000 OneKey® MLS as Distributed by MLS Grid
- 2025-07-24 Listing Removed — OneKey® MLS as Distributed by MLS Grid
- 2025-07-10 Price Changed $592,999 OneKey® MLS as Distributed by MLS Grid
- 2025-05-07 Listed $599,999 OneKey® MLS as Distributed by MLS Grid
- 2022-03-09 Listing Removed — OneKey® MLS as Distributed by MLS Grid
- 2022-01-28 Price Changed $150,500 OneKey® MLS as Distributed by MLS Grid
- 2021-12-01 Price Changed $119,950 OneKey® MLS as Distributed by MLS Grid
- 2021-09-09 Listed $99,950 OneKey® MLS as Distributed by MLS Grid
- 2017-08-29 Sold (Public Records) $32,500 Public Records
- 2006-05-22 Sold (Public Records) $240,625 Public Records
- 1989-01-27 Sold (Public Records) $80,000 Public Records
Property tax history
+1.1%/yrLatest (2025): $8,349 · +242.9% YoY. Source: county tax records.
Cash-flow waterfall
monthlySold comps — $/sqft
last 12 mo · ≤1 miLoading sold comps…