415 Water Bend Way · Mexico Beach, FL
Flood risk No data
- FEMA flood zone
- —
- Chance of flooding over 30 yrs
- —
- Est. flood insurance / yr
- —
Fire risk No data
- Est. fire insurance / yr
- —
Heat risk No data
- Hot days now (above threshold)
- —
- Hot days in 30 yrs
- —
Wind risk No data
- Chance of severe wind over 30 yrs
- —
Air-quality risk No data
- Unhealthy air days now
- —
- Unhealthy air days in 30 yrs
- —
Risk factors via First Street. Map © Google.
Why this score? — see what drove the D- grade
The composite is a weighted blend of 9 inputs, each scored 0–100. Each bar is that input's sub-score; the figure is the points it added to the 100-point composite (weight × sub-score).
- ARV discount +15.0/15.0
- Appreciation +5.0/10.0
- Cash flow +4.6/30.0
- Schools +4.3/10.0
- Livability +3.3/5.0
- Rent growth +2.5/5.0
- Condition / age +2.5/5.0
- 1% rule +0.6/10.0
- DSCR +0.0/10.0
$398,990
🖨 Deal sheet 📄 Offer letter ✓ Due diligence
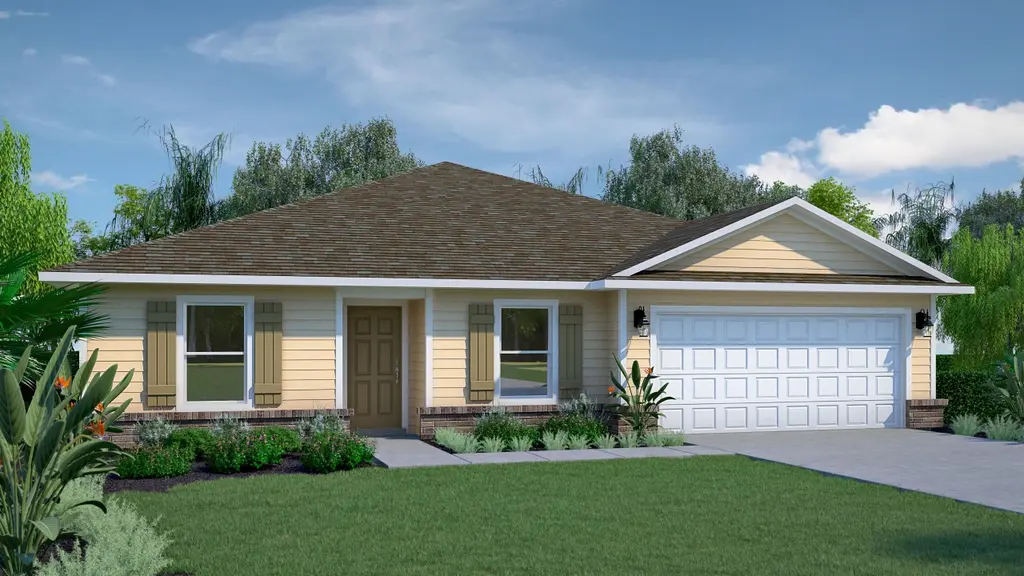
Listing remarks
The Gulf Isle offers a welcoming layout with thoughtful spaces throughout its 1,806 square feet. When you enter through the front door, the foyer opens to a bedroom on the left and to the right is the dining room, positioned perfectly for gatherings. Continue straight from the foyer to reach the kitchen, which includes a pantry, a center island, and a clear view into the great room, creating an open feel that ties the main living areas together. From the great room, sliding doors open to a 10-by-8 outdoor living space, ideal for enjoying Florida's warm weather year-round. Off the kitchen, a hallway leads to two additional bedrooms that share a full guest bathroom, complete with a linen clos
Key facts
- Pantry
- Thoughtful spaces
- Welcoming layout
Tags
Property features AI
Finance
- Other: Located at 415 Water Bend Way, Port Saint Joe, FL 32410
- Financial info: List price $398,990
Exterior
- Parking: 2 total parking spaces; 2-car garage
- Home design: Single-family property; Active listing
- Exterior features: 1,806 living area
Interior
- Bedrooms: 4 bedrooms
- Bathrooms: 2 full bathrooms
- Interior features: Spec home (Gulf Isle plan)
Neighborhood map
What this means for you Summary
Snapshot
- This is a 4-bed/2.0-bath single-family listed at $399k.
Deal economics
- At list price, monthly cash flow is $-1k ($-12k/yr) — negative.
- To cash-flow at today's rent, offer at most $254k (36.4% below list).
- To meet the 1% rule (rent ≥ 1% of price), the offer needs to be $222k (44.4% below list).
- Recommended offer: $222k (44.4% below list) — sets the bar for 1% rule.
- Cap rate 3.3% vs local median 1.0% in Mexico Beach — top-decile yield for the area; either an underpriced asset or a hidden risk that comps aren't pricing in. Stress-test before assuming the spread holds.
Location & tenants
- Location reads 66/100 on livability (#627 in FL) — a middle-class / working-renter tenant base. Strengths: crime A+, housing A+; Watch: schools F, amenities F, commute F.
- Bay (suburban): math 51% / reading 51% proficiency, ranked #29 of 73 in FL (top 40%) — acceptable for families but not a draw, mixed tenant base, ~2y average lease.
- Market conditions: 22 active listings in the ZIP; 4 comparable units currently listed for rent nearby; rentals leasing fast (median 13d on market — plan ~1-2 weeks tenant-placement turnaround); 2,473 units permitted in Bay County in 2024 (559 in 5+ unit buildings).
Forward outlook
- In year one you build about $15k of equity ($3k loan paydown + $12k appreciation (3.0% local appreciation)).
- Bay County population projected at +24% by 2050 — long-run rental-demand tailwind backs the buy-and-hold thesis.
- By year 3, paydown + projected appreciation supports a ~$37k cash-out refi (75% LTV) — recoverable capital for the next deal without selling this one.
Negotiation context
- It's been on market 37 days — a 3% lower offer ($387k) is reasonable based on typical stale-listing flexibility.
Questions for the listing agent
- What do current leases actually rent for vs. the listed asking? Can we see a recent rent roll and the last 12 months of T-12 income?
- It's been on market 37 days. Have you received any prior offers? Is the seller open to a 44% concession, seller financing, or rate buy-down credit?
- Is there a deadline driving the sale (1031 exchange, divorce, estate, relocation)? That informs how much negotiation room exists.
- Schools are F-rated, which usually means shorter tenancies and higher turnover. Who's the typical renter profile here, and what's been the actual vacancy rate?
- The area grade is low — what's the realistic commute time and amenity access for the typical tenant pool here? Any planned neighborhood developments (good or bad) we should know about?
- What's the average days-on-market for RENTAL listings here right now (not sales)? A rising rental-DOM trend means longer vacancies and softer asking-rent achievability than the comps imply.
- What's the recent tenant-quality profile in this submarket — average credit score on applications, eviction rate, late-payment / NSF rate, and stable-employment percentage? A property-management company in the area should have these aggregated.
- How much new for-sale + rental construction is in the pipeline within 1–3 miles? Heavy new supply typically softens prices + rents 12–24 months out; constrained supply supports both.
Investment metrics
- 1% rule
- 0.56% ✗
- Cap rate
- 3.27%
- Cash-on-cash
- -10.78%
- DSCR
- 0.52
- GRM
- 15.0
CMA / ARV
- ARV (median comp)
- $614,383
- List price
- $398,990
- Delta
- -35.06%
- Verdict
- UNDERPRICED
- Comps
- 9 within 1.0 mi
Show comp detail 2 sales within ~0.75 mi
| Address | Dist | Beds/Ba | Sqft | Sold | Price | $/sf | Match |
|---|---|---|---|---|---|---|---|
| 272 Salt Creek Ln | 0.14mi | 4/2.5 | 1,710 (-5%) | 9mo | $349,900 | $205 | 75 |
| 235 Salt Creek Ln | 0.13mi | 4/2.5 | 1,710 (-5%) | 12mo | $368,496 | $215 | 73 |
Match score weights: distance 35% · size 25% · config 20% · recency 20%. Top-matched comps best support the ARV.
Projected returns pro-forma
3.0% appreciation · 3.0% rent growth · sell at horizon
- IRR
- -2.5%
- Equity multiple
- 0.86×
- Total profit
- $-15,825
- Equity at exit
- $179,403
- IRR
- 1.9%
- Equity multiple
- 1.30×
- Total profit
- $33,357
- Equity at exit
- $276,482
Cash invested: $111,717 (down + closing). Projections, not guarantees.
Landlord ↔ Tenant lean methodology
- Overall (STATE)
- 87 Strongly Landlord-Friendly
- State Florida
- 87 Strongly Landlord-Friendly · R+3
- County
- — inherits STATE
- City
- — inherits STATE
ZIP-level market 32410
- Active inventory
- 22
- Price-to-rent
- 15.0×
Monthly cashflow live
- Estimated rent
- $2,220 medium interval (Pro) →
- Mortgage (P&I)
- −$2,092
- Tax est. 1.5%
- −$499 /mo · $5,985/yr
- Insurance
- −$166
- HOA
- −$0
- Vacancy / Maint / Mgmt
- −$466
- Net cashflow
- $-1,004
Break-even live
UW: 25.0% down · 7.5% · 30yr · 1.5% tax · 5.0% vac · 8.0% maint · 8.0% mgmt
Financing live
Cash to close
- Down payment
- $99,748
- Closing costs
- $11,970
- Reserves months
- —
- Total cash needed
- —
Loan-product check · same deal, 3 products live
Conventional
25% down · 7.5% · 30yr
- Down + closing
- —
- Monthly P&I
- —
- Monthly cashflow
- —
- DSCR
- —
- Eligible?
- —
Personal DTI + credit; lowest rate.
DSCR
20% down · 8.5% · 30yr
- Down + closing
- —
- Monthly P&I
- —
- Monthly cashflow
- —
- DSCR
- —
- Eligible?
- —
No personal income docs; deal must DSCR.
Hard money
10% down · 12.0% · 12mo
- Down + closing
- —
- Monthly P&I
- —
- Monthly cashflow
- —
- DSCR
- —
- Eligible?
- —
Short-term bridge; refi at stabilization.
Rent comps 4 comps
| Address | Beds | Baths | Sqft | Rent | $/sqft | DOM | Units | Dist |
|---|---|---|---|---|---|---|---|---|
| 264 Salt Creek Ln Port Saint Joe, FL | 3.0 | 2.5 | 1533 | $2,300 | $1.50 | 13d | 1 | 0.09mi |
| 231 Salt Creek Ln Port Saint Joe, FL | 3.0 | 2.5 | 1460 | $2,100 | $1.44 | 13d | 1 | 0.09mi |
| 260 Salt Creek Ln Port Saint Joe, FL | 3.0 | 2.5 | 1460 | $2,300 | $1.58 | 13d | 1 | 0.09mi |
| 155 Town Village Blvd Mexico Beach, FL | 1.0–3.0 | 1.0–2.0 | 1121 | $2,085 | $1.86 | 13d | 9 | 0.23mi |
Listing history 18 events
-
2026-06-19days on market $398,990 Active 37 DOM
-
2026-06-18days on market $398,990 Active 36 DOM
-
2026-06-17days on market $398,990 Active 35 DOM
-
2026-06-16days on market $398,990 Active 34 DOM
-
2026-06-15days on market $398,990 Active 33 DOM
-
2026-06-14days on market $398,990 Active 31 DOM
-
2026-06-13days on market $398,990 Active 30 DOM
-
2026-06-10days on market $398,990 Active 28 DOM
-
2026-06-09days on market $398,990 Active 27 DOM
-
2026-06-08days on market $398,990 Active 26 DOM
-
2026-06-07days on market $398,990 Active 25 DOM
-
2026-06-05days on market $398,990 Active 22 DOM
-
2026-06-03days on market $398,990 Active 21 DOM
-
2026-06-02days on market $398,990 Active 20 DOM
-
2026-06-01days on market $398,990 Active 19 DOM
-
2026-05-31days on market $398,990 Active 18 DOM
-
2026-05-30days on market $398,990 Active 17 DOM
-
2026-05-13$398,990 Active 1191-char remark
ⓘ Source: listings_history table (triggers on properties + properties_extension) + one-shot
backfill from property_details.listing_events for pre-trigger history.
Nearby sold comps map
Loading sold comps map…
Walkable amenities ~0.75 mi
Loading nearby amenities…
Taxation est. · year 1
- Rental income
- $26,638
- − Mortgage interest
- −$22,350
- − Property taxes
- −$5,985
- − Insurance
- −$1,995
- − Repairs & maintenance
- −$2,131
- − Management
- −$2,131
- − Depreciation
- −$11,607
- Taxable loss
- −$19,560
- Est. tax savings @ 24.0%
- +$4,694
- After-tax cash flow
- $-7,349/yr
For passive investors: Depreciation is non-cash, so a rental often shows a tax loss while cash-flowing — sheltering income. Rental losses are passive: they offset passive income freely, and up to $25,000/yr can offset ordinary (W-2) income if you actively participate and your MAGI is under $100k (phasing out to $0 by $150k); unused losses carry forward. On sale, claimed depreciation is recaptured at up to 25%, and gains may owe capital-gains tax (a 1031 exchange can defer both). Figures are a year-1 estimate at your 24.0% rate — not tax advice; consult a CPA.
Schools (NCES district)
- District
- Bay
- NCES district ID
- 1200090
- Math proficiency
- 51% ▼ -8.00%
- Reading proficiency
- 51% ▼ -7.00%
- Median HH income
- $47,740
- Composite
- 43.41/100
- National rank
- #3014
- State rank
- #29 of 73 in FL
Livability — Mexico Beach
- Score
- 66/100
- State rank
- #627
- US rank
- #12224
Category grades
Schools grade is shown separately in the Schools card above.
Census & demographics
- Census place
- Mexico Beach, FL
- Population (ZIP)
- 499
Population outlook (Bay County) Hauer SSP2
- Today (2025)
- 206,264 people
- By 2030
- 217,740 · +5.6%
- By 2040
- 238,738 · +15.7%
- By 2050
- 255,545 · +23.9%
- By 2075
- 288,295 · +39.8%
- By 2100
- 288,638 · +39.9%
Race, ethnicity, and origin ACS 2023
- Neighborhood character
- Predominantly White (94%)
- Race & ethnicity
- White 94% Black 5% Two or more races 1%
- Common ancestry
- Slovak 4% Lithuanian 2% Italian 1%
- Foreign-born
- 4% · Canada
- Languages at home
- 91% English-only · Spanish 6% Other Indo-European 3%
Political lean MEDSL · Bay
- 2024 margin
- Solid R (+47.4) · D 25.8% · R 73.1% · Other 1.1%
- 2008→2024 swing
- -6.6pp toward R · 2008: -40.7pp · 2024: -47.4pp
- All cycles
- 2024: R+47.4 2020: R+43.5 2016: R+46.3 2012: R+43.6 2008: R+40.7
Not yet ingested
- Civics
- —
Market trends
- HPI YoY
- —
- Current HPI
- —
- Rent YoY
- —
- Metro
- —
- State GDP YoY
- ▲ 3.28%
- F500 in state
- 36
Industry mix (Fortune 500 HQ in FL)
| Industry | F500 HQs | Revenue |
|---|---|---|
| Industrial Technology | 2 | $29B |
|
||
| Insurance | 2 | $17B |
|
||
| Retail | 1 | $60B |
|
||
| Technology Distribution | 1 | $58B |
|
||
| Homebuilding | 1 | $35B |
|
||
| Technology Manufacturing | 1 | $35B |
|
||
Cash-flow waterfall
monthlySold comps — $/sqft
last 12 mo · ≤1 miLoading sold comps…