 Multi-family
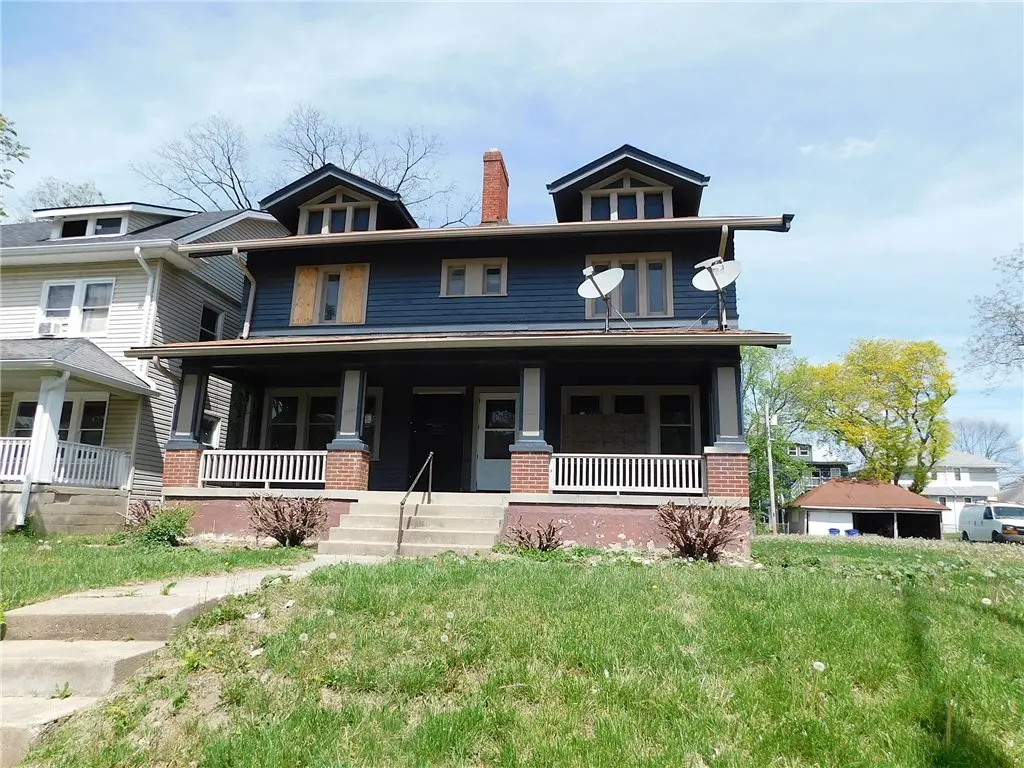
817 Harvard Blvd · Dayton, OH
Flood risk 1/10 · Minimal
- FEMA flood zone
- X (unshaded)
- Chance of flooding over 30 yrs
- 0.0%
- Est. flood insurance / yr
- $473 – $860
Fire risk 1/10 · Minimal
- Est. fire insurance / yr
- $713 – $1,323
Heat risk 4/10 · Minor
- Hot days now (above 102°F)
- 7 days/yr
- Hot days in 30 yrs
- 18 days/yr
Wind risk 2/10 · Minimal
- Chance of severe wind over 30 yrs
- 0.0%
Air-quality risk 3/10 · Minor
- Unhealthy air days now
- 2 days/yr
- Unhealthy air days in 30 yrs
- 4 days/yr
Risk factors via First Street. Map © Google.
Why this score? — see what drove the B+ grade
The composite is a weighted blend of 9 inputs, each scored 0–100. Each bar is that input's sub-score; the figure is the points it added to the 100-point composite (weight × sub-score).
- Cash flow +30.0/30.0
- ARV discount +15.0/15.0
- 1% rule +10.0/10.0
- DSCR +10.0/10.0
- Rent growth +3.3/5.0
- Livability +3.2/5.0
- Condition / age +2.5/5.0
- Schools +1.3/10.0
- Appreciation +0.0/10.0
$84,900
🖨 Deal sheet 📄 Offer letter ✓ Due diligence
Multi-family units
County records classify this as Multi-Family (2-4 Unit). Listing-text estimate: 1 unit. estimate disagrees with records
Listing remarks MLS
Large side-by-side double with 3 bedrooms and 1 bath on each side. 2 car detached garage. Gutter and downspout repairs completed. Separate meters for gas, electric and water are available for each unit. Rents could be $1000 or more. Can be sold individually or in a PACKAGE with 3 other properties. This could be a great project since all 4 properties are within 2 blocks of each other. This property is owned by Montgomery County Land Bank. Please Note: All properties currently owned by potential buyers must be current for a minimum of 2 years on their taxes and all nuisance violations on those properties must have been addressed. (Information provided by seller and public record. Please rely on own inspections. )
Key facts
- Detached garage
- Separate meters
- 6,159 sq ft lot
Tags
Neighborhood map
What this means for you Summary
Snapshot
- This is a 6-bed/2.0-bath multifamily listed at $85k.
Deal economics
- At list price, monthly cash flow is $1k ($14k/yr) — positive.
- The deal already cash-flows at list — no discount required.
- Meets the 1% rule at list price ($2k rent vs $85k).
- Recommended offer: $80k (6.0% below list) — sets the bar for market timing.
- Cap rate 23.3% vs local median 7.4% in Dayton — top-decile yield for the area; either an underpriced asset or a hidden risk that comps aren't pricing in. Stress-test before assuming the spread holds.
Location & tenants
- Location reads 65/100 on livability (#716 in OH) — a middle-class / working-renter tenant base. Strengths: cost of living A+, housing A+, health & safety A; Watch: schools C-, amenities C-, crime F.
- Dayton City (urban): math 12% / reading 21% proficiency, ranked #641 of 656 in OH (top 98%) — low school quality limits family demand, transient renter base, plan for 1-2y turnover; 74% free/reduced lunch — lower-income household profile, screen leases tightly.
- Market conditions: Rents rising (+3.0%/yr); 156 active listings in the ZIP; 1 comparable units currently listed for rent nearby; lower-income renter base — watch delinquency; 907 units permitted in Montgomery County in 2024 (416 in 5+ unit buildings).
- At $2,264/mo this rent would consume 65% of the median local household income ($42k/yr) (locally 1504% of renters already pay >50% of income on rent) — very limited rent-growth headroom before tenants either downsize or default.
Forward outlook
- Local home prices are declining (-3.0%/yr); year-one equity from $587 of loan paydown is wiped out by about $3k of value loss. Plan a longer hold.
- Montgomery County population projected at -10% by 2050 — secular population decline; favor cash flow + early exit over multi-decade hold.
- At projected returns (-3.0% appreciation + 3.0% rent growth), your $24k cash investment doubles in ~2 years — after that, you're playing with house money.
Negotiation context
- It's been on market 62 days — a 6% lower offer ($80k) is reasonable based on typical stale-listing flexibility.
Risks & watch-outs
- Watch-outs: built in 1913 — expect roof / HVAC / electrical / plumbing capex.
Questions for the listing agent
- It's been on market 62 days. Have you received any prior offers? Is the seller open to a 6% concession, seller financing, or rate buy-down credit?
- Built in 1913 — when were the roof, HVAC, electrical panel, plumbing, and water heater last replaced?
- Why hasn't it sold? Are there any deal-killer items the seller is aware of (foundation, flood, title, zoning, code violations)?
- Is there a deadline driving the sale (1031 exchange, divorce, estate, relocation)? That informs how much negotiation room exists.
- Crime grade is F in this area — have there been break-ins, vandalism, or insurance claims at this property in the last 3 years? What carrier currently insures it and at what premium?
- What's the average days-on-market for RENTAL listings here right now (not sales)? A rising rental-DOM trend means longer vacancies and softer asking-rent achievability than the comps imply.
- What's the recent tenant-quality profile in this submarket — average credit score on applications, eviction rate, late-payment / NSF rate, and stable-employment percentage? A property-management company in the area should have these aggregated.
- How much new apartment / multifamily construction is in the pipeline within 1–3 miles? Heavy new supply (>2% of stock underway) typically softens rents 12–24 months out; light construction supports rent growth.
Investment metrics
- 1% rule
- 2.67% ✓
- Cap rate
- 23.28%
- Cash-on-cash
- 60.67%
- DSCR
- 3.70
- GRM
- 3.1
CMA / ARV
- ARV (median comp)
- $102,982
- List price
- $84,900
- Delta
- -17.56%
- Verdict
- UNDERPRICED
- Comps
- 20 within 1.0 mi
Show comp detail 12 sales within ~0.75 mi
| Address | Dist | Beds/Ba | Sqft | Sold | Price | $/sf | Match |
|---|---|---|---|---|---|---|---|
| 804 Harvard Blvd | 0.03mi | 6/2.0 | 2,796 (-1%) | 0mo | $65,000 | $23 | 97 |
| 229-231 Wroe Ave | 0.09mi | 6/2.0 | 2,704 (-4%) | 3mo | $115,000 | $43 | 87 |
| 717 Homewood Ave | 0.13mi | 6/2.0 | 2,570 (-9%) | 4mo | $75,000 | $29 | 76 |
| 375 Kenwood Ave #373 | 0.17mi | 6/2.0 | 2,560 (-9%) | 5mo | $50,000 | $20 | 72 |
| 18-20 Cambridge Ave | 0.26mi | 6/2.0 | 3,196 (+14%) | 3mo | $130,000 | $41 | 63 |
| 44 W Mumma Ave | 0.43mi | 6/2.0 | 2,530 (-10%) | 2mo | $115,000 | $45 | 62 |
| 1208 Salem #210 | 0.44mi | 6/— | 3,090 (+10%) | 4mo | $180,000 | $58 | 60 |
| 1117-1119 Superior Ave #1117 | 0.73mi | 6/2.0 | 2,870 (+2%) | 4mo | $169,000 | $59 | 59 |
| 49-51 Cambridge Ave | 0.27mi | 6/2.0 | 3,224 (+15%) | 7mo | $65,000 | $20 | 57 |
| 249-251 Lexington Ave | 0.47mi | 6/2.0 | 2,464 (-12%) | 3mo | $67,500 | $27 | 55 |
| 120 Marathon Ave | 0.59mi | 6/2.0 | 2,514 (-11%) | 2mo | $30,000 | $12 | 53 |
| 70-72 Mary Ave #70 | 0.65mi | 6/2.0 | 2,560 (-9%) | 6mo | $55,000 | $21 | 50 |
Match score weights: distance 35% · size 25% · config 20% · recency 20%. Top-matched comps best support the ARV.
Projected returns pro-forma
-3.0% appreciation · 3.03% rent growth · sell at horizon
- IRR
- 59.5%
- Equity multiple
- 3.65×
- Total profit
- $62,891
- Equity at exit
- $12,659
- IRR
- 64.2%
- Equity multiple
- 7.47×
- Total profit
- $153,748
- Equity at exit
- $7,341
Cash invested: $23,772 (down + closing). Projections, not guarantees.
Landlord ↔ Tenant lean methodology
- Overall (STATE)
- 73 Landlord-Friendly
- State Ohio
- 73 Landlord-Friendly · R+6
- County
- — inherits STATE
- City
- — inherits STATE
ZIP-level market 45406
- Rents YoY
- 3.0%
- Active inventory
- 156
- Price-to-rent
- 6.2×
Monthly cashflow live
- Estimated rent
- $2,264 high interval (Pro) →
- Mortgage (P&I)
- −$445
- Tax est. 1.5%
- −$106 /mo · $1,274/yr
- Insurance
- −$35
- HOA
- −$0
- Vacancy / Maint / Mgmt
- −$475
- Net cashflow
- $1,202
Break-even live
2-unit breakdown (identical units grouped — click to expand)
| Units | Beds | Baths | Est. rent |
|---|---|---|---|
| 2× units | 3 | 1 | $2,264 |
| #1 | 3 | 1 | $1,132 |
| #2 | 3 | 1 | $1,132 |
| Total (2 units) | $2,264 | ||
UW: 25.0% down · 7.5% · 30yr · 1.5% tax · 5.0% vac · 8.0% maint · 8.0% mgmt
Financing live
Cash to close
- Down payment
- $21,225
- Closing costs
- $2,547
- Reserves months
- —
- Total cash needed
- —
Loan-product check · same deal, 3 products live
Conventional
25% down · 7.5% · 30yr
- Down + closing
- —
- Monthly P&I
- —
- Monthly cashflow
- —
- DSCR
- —
- Eligible?
- —
Personal DTI + credit; lowest rate.
DSCR
20% down · 8.5% · 30yr
- Down + closing
- —
- Monthly P&I
- —
- Monthly cashflow
- —
- DSCR
- —
- Eligible?
- —
No personal income docs; deal must DSCR.
Hard money
10% down · 12.0% · 12mo
- Down + closing
- —
- Monthly P&I
- —
- Monthly cashflow
- —
- DSCR
- —
- Eligible?
- —
Short-term bridge; refi at stabilization.
Rent comps 1 comps
| Address | Beds | Baths | Sqft | Rent | $/sqft | DOM | Units | Dist |
|---|---|---|---|---|---|---|---|---|
| 932 Harvard Blvd Dayton, OH | 5.0 | 2.0 | 1986 | $1,500 | $0.76 | 44d | 1 | 0.11mi |
Listing history 23 events
-
2026-06-18days on market $84,900 Active 62 DOM
-
2026-06-17days on market $84,900 Active 61 DOM
-
2026-06-16days on market $84,900 Active 60 DOM
-
2026-06-15days on market $84,900 Active 59 DOM
-
2026-06-14days on market $84,900 Active 57 DOM
-
2026-06-13days on market $84,900 Active 56 DOM
-
2026-06-10days on market $84,900 Active 54 DOM
-
2026-06-09days on market $84,900 Active 53 DOM
-
2026-06-08days on market $84,900 Active 52 DOM
-
2026-06-07days on market $84,900 Active 51 DOM
-
2026-06-05days on market $84,900 Active 48 DOM
-
2026-06-03days on market $84,900 Active 47 DOM
-
2026-06-02days on market $84,900 Active 46 DOM
-
2026-06-01days on market $84,900 Active 45 DOM
-
2026-05-31days on market $84,900 Active 44 DOM
-
2026-03-02$89,900 Active 720-char remark
Show marketing remark (720 chars)
Large side-by-side double with 3 bedrooms and 1 bath on each side. 2 car detached garage. Gutter and downspout repairs completed. Separate meters for gas, electric and water are available for each unit. Rents could be $1000 or more. Can be sold individually or in a PACKAGE with 3 other properties. This could be a great project since all 4 properties are within 2 blocks of each other. This property is owned by Montgomery County Land Bank. Please Note: All properties currently owned by potential buyers must be current for a minimum of 2 years on their taxes and all nuisance violations on those properties must have been addressed. (Information provided by seller and public record. Please rely on own inspections. )
-
2022-12-16soldstatus $199,000
-
2018-10-03soldstatus $435,000
-
2018-08-23soldstatus $320,000
-
1991-11-27soldstatus $36,900
-
1991-11-27soldstatus $36,900
-
1987-08-03soldstatus $26,000
-
1986-07-28soldstatus $24,000
ⓘ Source: listings_history table (triggers on properties + properties_extension) + one-shot
backfill from property_details.listing_events for pre-trigger history.
Climate risk First Street
- Flood 1/10 Low FEMA zone X (unshaded) · 0% chance over 30 yrs
- Wildfire 1/10 Low
- Heat 4/10 Moderate 7 d/yr ≥102°F today · 18 d/yr by 30 yrs out
- Wind 2/10 Low 0% chance of damaging wind over 30 yrs
- Air quality 3/10 Moderate 2 unhealthy d/yr today · 4 by 30 yrs out
Nearby sold comps map
Loading sold comps map…
Walkable amenities ~0.75 mi
Loading nearby amenities…
Taxation est. · year 1
- Rental income
- $27,168
- − Mortgage interest
- −$4,756
- − Property taxes
- −$1,274
- − Insurance
- −$424
- − Repairs & maintenance
- −$2,173
- − Management
- −$2,173
- − Depreciation
- −$2,470
- Taxable income
- $13,898
- Est. tax owed @ 24.0%
- −$3,335
- After-tax cash flow
- $11,087/yr
For passive investors: Depreciation is non-cash, so a rental often shows a tax loss while cash-flowing — sheltering income. Rental losses are passive: they offset passive income freely, and up to $25,000/yr can offset ordinary (W-2) income if you actively participate and your MAGI is under $100k (phasing out to $0 by $150k); unused losses carry forward. On sale, claimed depreciation is recaptured at up to 25%, and gains may owe capital-gains tax (a 1031 exchange can defer both). Figures are a year-1 estimate at your 24.0% rate — not tax advice; consult a CPA.
Schools (NCES district)
- District
- Dayton City
- NCES district ID
- 3904384
- Math proficiency
- 12% ▼ -12.00%
- Reading proficiency
- 21% ▼ -11.00%
- Median HH income
- $28,688
- Composite
- 12.94/100
- National rank
- #9579
- State rank
- #641 of 656 in OH
Livability — Dayton
- Score
- 65/100
- State rank
- #716
- US rank
- #12895
Category grades
Schools grade is shown separately in the Schools card above.
Census & demographics
- Census place
- Dayton, OH
- County
- Montgomery County · 459,541 people
- City population
- 164,387
- Metro
- Dayton-Kettering, OH
- Population (ZIP)
- 19,991
- Household income
- $41,796
- Rent vs Own
- Severe rent burden
- 1504.0
Population outlook (Montgomery County) Hauer SSP2
- Today (2025)
- 523,241 people
- By 2030
- 514,948 · -1.6%
- By 2040
- 493,378 · -5.7%
- By 2050
- 469,639 · -10.2%
- By 2075
- 418,360 · -20.0%
- By 2100
- 353,315 · -32.5%
Race, ethnicity, and origin ACS 2023
- Neighborhood character
- Predominantly Black (75%)
- Race & ethnicity
- Black 75% White 16% Two or more races 7% Hispanic / Latino 3%
- Common ancestry
- Italian 2% Lithuanian 1% Slovak 1%
- Foreign-born
- 2% · Canada
- Languages at home
- 97% English-only · Spanish 1%
Political lean MEDSL · Montgomery
- 2024 margin
- Toss-up / Even · D 49.8% · R 49.3%
- 2008→2024 swing
- -5.8pp toward R · 2008: 6.2pp · 2024: 0.5pp
- All cycles
- 2024: D+0.5 2020: D+2.2 2016: R+1.2 2012: D+3.1 2008: D+6.2
Not yet ingested
- Civics
- —
Market trends
- HPI YoY
- ▼ -113.75%
- Current HPI
- 197.1302
- Rent YoY
- ▲ 3.03%
- Metro
- Dayton-Kettering, OH
- State GDP YoY
- ▲ 1.98%
- F500 in state
- 48
Industry mix (Fortune 500 HQ in OH)
| Industry | F500 HQs | Revenue |
|---|---|---|
| Insurance | 3 | $145B |
|
||
| Industrial Machinery | 3 | $49B |
|
||
| Financial Services | 3 | $24B |
|
||
| Consumer Goods | 2 | $93B |
|
||
| Aerospace / Defense | 2 | $47B |
|
||
| Utilities | 2 | $33B |
|
||
Price history
+274.6% since first listed8 events — show timeline
- 2026-03-02 Listed $89,900 Dayton MLS
- 2022-12-16 Sold (Public Records) $199,000 Public Records
- 2018-10-03 Sold (Public Records) $435,000 Public Records
- 2018-08-23 Sold (Public Records) $320,000 Public Records
- 1991-11-27 Sold (Public Records) $36,900 Public Records
- 1991-11-27 Sold (Public Records) $36,900 Public Records
- 1987-08-03 Sold (Public Records) $26,000 Public Records
- 1986-07-28 Sold (Public Records) $24,000 Public Records
Property tax history
-14.4%/yrLatest (2025): $104 · -77.4% YoY. Source: county tax records.
Cash-flow waterfall
monthlySold comps — $/sqft
last 12 mo · ≤1 miLoading sold comps…