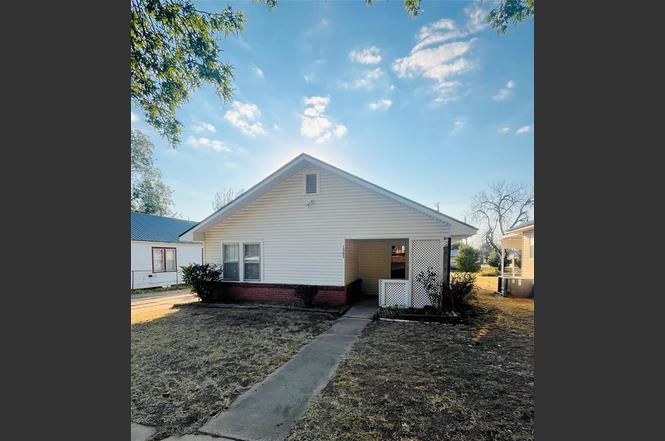
1305 Klabzuba Ave · Prague, OK
Flood risk 1/10 · Minimal
- FEMA flood zone
- X (unshaded)
- Chance of flooding over 30 yrs
- 0.0%
- Est. flood insurance / yr
- $507 – $1,088
Fire risk 8/10 · Major
- Est. fire insurance / yr
- $2,463 – $4,575
Heat risk 6/10 · Moderate
- Hot days now (above 110°F)
- 7 days/yr
- Hot days in 30 yrs
- 19 days/yr
Wind risk 3/10 · Minor
- Chance of severe wind over 30 yrs
- 6.0%
Air-quality risk 2/10 · Minimal
- Unhealthy air days now
- 1 days/yr
- Unhealthy air days in 30 yrs
- 1 days/yr
Risk factors via First Street. Map © Google.
Why this score? — see what drove the C+ grade
The composite is a weighted blend of 9 inputs, each scored 0–100. Each bar is that input's sub-score; the figure is the points it added to the 100-point composite (weight × sub-score).
- Cash flow +17.8/30.0
- ARV discount +14.5/15.0
- Appreciation +9.4/10.0
- DSCR +5.6/10.0
- 1% rule +3.8/10.0
- Livability +3.2/5.0
- Schools +2.9/10.0
- Rent growth +2.5/5.0
- Condition / age +2.5/5.0
$125,000
🖨 Deal sheet 📄 Offer letter ✓ Due diligence
Listing remarks
* * Back on the market at no fault of the seller * * This 2-bedroom, 1-bathroom home offers 1,232 sq ft of comfortable living space, including a versatile flex room perfect for a third bedroom, home office, or creative studio. Recent updates include fresh interior paint, new luxury vinyl plank flooring, and a stylish new bathroom vanity. The roof was replaced in 2023, offering peace of mind for years to come. Don’t miss this move-in ready gem!
Key facts
- Recent updates
- New bathroom vanity
- Replaced roof
Tags
Property features AI
Finance
- Other: Living area reported as 1,232 (assessor); Not occupied; Days on market: 175; Directions available
- Financial info: Listing accepts Cash, Conventional, FHA or VA; Assumable: Unknown; Loan qualification: Unknown; Current price: $124,000
- HOA & community: No mandatory association dues
Exterior
- Parking: Detached 2-car garage
- Utilities: No flood insurance indicated
- Home design: Single family residence; Residential property; One-level; North Addition
- Construction: Vinyl siding; Composition roof (replaced 2023); Conventional foundation; Existing property
- Exterior features: Covered porch; Interior lot
Interior
- Bedrooms: 2 bedrooms (one-level property)
- Bathrooms: 1 full bathroom
- Heating & cooling: Electric heating
- Interior features: No fireplace; No in-law plan
Neighborhood map
What this means for you Summary
Snapshot
- This is a 3-bed/1.0-bath single-family listed at $125k.
Deal economics
- At list price, monthly cash flow is $104 ($1k/yr) — positive.
- The deal already cash-flows at list — no discount required.
- To meet the 1% rule (rent ≥ 1% of price), the offer needs to be $110k (11.9% below list).
- Recommended offer: $110k (12.0% below list) — sets the bar for market timing.
- Cap rate 7.3% vs local median 3.6% in Prague — top-decile yield for the area; either an underpriced asset or a hidden risk that comps aren't pricing in. Stress-test before assuming the spread holds.
Location & tenants
- Location reads 63/100 on livability (#197 in OK) — a middle-class / working-renter tenant base. Strengths: cost of living A+, crime B+; Watch: housing C-, amenities F, commute F.
- Prague (rural): math 31% / reading 36% proficiency, ranked #45 of 270 in OK (top 17%) — families likely to look elsewhere, expect single-tenant / working-renter base with shorter leases.
- Zoned schools: Prague Es (math 44% / reading 42%, grade F, #80 of 845 statewide, top 10%, 534 students, 0% FRL); Prague Hs (math 24% / reading 34%, grade F, #96 of 447 statewide, top 26%, 321 students, 0% FRL) — zoned schools average 0% FRL vs 49% district-wide (49 pts lower); this property's tenant base skews higher-income than the district average.
- Market conditions: 46 active listings in the ZIP; 19 units permitted in Lincoln County in 2024 (0 in 5+ unit buildings).
Forward outlook
- In year one you build about $12k of equity ($864 loan paydown + $11k appreciation (8.9% local appreciation)).
- At projected returns (8.9% appreciation + 3.0% rent growth), your $35k cash investment doubles in ~3 years — after that, you're playing with house money.
- By year 3, paydown + projected appreciation supports a ~$30k cash-out refi (75% LTV) — recoverable capital for the next deal without selling this one.
Negotiation context
- It's been on market 211 days — a 12% lower offer ($110k) is reasonable based on typical stale-listing flexibility.
- 5 sale attempts since 10y ago with the ask held roughly flat each time — persistent listings suggest the price (not the market) is what's stuck; bring a comps-based counter.
- Current owner paid $44k; list at $125k implies a 184% gain — meaningful room to come down on a strong offer.
Risks & watch-outs
- Watch-outs: built in 1948 — expect roof / HVAC / electrical / plumbing capex.
- Climate carrying-cost: severe wildfire risk; extreme-heat days projected 7→19/yr by 2055 (HVAC capex compounding) — expect insurance premiums to compound above CPI over the hold.
Questions for the listing agent
- It's been on market 211 days. Have you received any prior offers? Is the seller open to a 12% concession, seller financing, or rate buy-down credit?
- Built in 1948 — when were the roof, HVAC, electrical panel, plumbing, and water heater last replaced?
- Why hasn't it sold? Are there any deal-killer items the seller is aware of (foundation, flood, title, zoning, code violations)?
- Is there a deadline driving the sale (1031 exchange, divorce, estate, relocation)? That informs how much negotiation room exists.
- Schools are D-rated, which usually means shorter tenancies and higher turnover. Who's the typical renter profile here, and what's been the actual vacancy rate?
- What's the average days-on-market for RENTAL listings here right now (not sales)? A rising rental-DOM trend means longer vacancies and softer asking-rent achievability than the comps imply.
- What's the recent tenant-quality profile in this submarket — average credit score on applications, eviction rate, late-payment / NSF rate, and stable-employment percentage? A property-management company in the area should have these aggregated.
- How much new for-sale + rental construction is in the pipeline within 1–3 miles? Heavy new supply typically softens prices + rents 12–24 months out; constrained supply supports both.
Investment metrics
- 1% rule
- 0.88% ✗
- Cap rate
- 7.29%
- Cash-on-cash
- 3.56%
- DSCR
- 1.16
- GRM
- 9.5
CMA / ARV
- ARV (on-the-fly)
- $147,840
- Comps found
- 12
Show comp detail 12 sales within ~0.75 mi
| Address | Dist | Beds/Ba | Sqft | Sold | Price | $/sf | Match |
|---|---|---|---|---|---|---|---|
| 1930 Haynie Ln | 0.46mi | 3/2.0 | 1,247 (+1%) | 4mo | $150,000 | $120 | 70 |
| 209 E Main | 0.25mi | 2/1.0 (-1) | 1,200 (-3%) | 12mo | $60,000 | $50 | 69 |
| 1223 Glenwood Dr | 0.53mi | 3/1.5 | 1,202 (-2%) | 1mo | $170,000 | $141 | 68 |
| 1621 Mitacek Ave | 0.29mi | 3/2.0 | 1,210 (-2%) | 14mo | $177,000 | $146 | 68 |
| 1810 Haynie Ln | 0.36mi | 3/1.5 | 1,184 (-4%) | 9mo | $140,000 | $118 | 67 |
| 1415 N Jim Thorpe Blvd | 0.12mi | 3/1.5 | 1,056 (-14%) | 8mo | $112,000 | $106 | 62 |
| 1016 Westlawn Ln | 0.65mi | 4/1.5 (+1) | 1,225 (-1%) | 3mo | $64,000 | $52 | 59 |
| 1429 Pastusek Ave | 0.24mi | 3/2.0 | 1,120 (-9%) | 13mo | $98,000 | $88 | 59 |
| 1216 N Jim Thorpe Blvd | 0.06mi | 2/1.0 (-1) | 1,049 (-15%) | 13mo | $155,000 | $148 | 56 |
| 1016 Brunson Ave | 0.25mi | 2/1.0 (-1) | 1,080 (-12%) | 21mo | $139,500 | $129 | 45 |
| 814 Ayars Ave | 0.40mi | 4/2.0 (+1) | 1,348 (+9%) | 16mo | $175,000 | $130 | 43 |
| 1202 13th St | 0.28mi | 2/1.0 (-1) | 1,048 (-15%) | 17mo | $112,100 | $107 | 43 |
Match score weights: distance 35% · size 25% · config 20% · recency 20%. Top-matched comps best support the ARV.
Projected returns pro-forma
8.87% appreciation · 3.0% rent growth · sell at horizon
- IRR
- 24.5%
- Equity multiple
- 2.86×
- Total profit
- $65,138
- Equity at exit
- $102,491
- IRR
- 21.9%
- Equity multiple
- 6.28×
- Total profit
- $184,675
- Equity at exit
- $211,075
Cash invested: $35,000 (down + closing). Projections, not guarantees.
Landlord ↔ Tenant lean methodology
- Overall (STATE)
- 83 Strongly Landlord-Friendly
- State Oklahoma
- 83 Strongly Landlord-Friendly · R+20
- County
- — inherits STATE
- City
- — inherits STATE
ZIP-level market 74864
- Home prices YoY
- 2.8%
- Active inventory
- 46
- Price-to-rent
- 9.5×
Monthly cashflow live
- Estimated rent
- $1,101 medium interval (Pro) →
- Mortgage (P&I)
- −$656
- Tax from tax record
- −$58 /mo · $698/yr
- Insurance
- −$52
- HOA
- −$0
- Vacancy / Maint / Mgmt
- −$231
- Net cashflow
- $104
Break-even live
UW: 25.0% down · 7.5% · 30yr · 1.5% tax · 5.0% vac · 8.0% maint · 8.0% mgmt
Financing live
Cash to close
- Down payment
- $31,250
- Closing costs
- $3,750
- Reserves months
- —
- Total cash needed
- —
Loan-product check · same deal, 3 products live
Conventional
25% down · 7.5% · 30yr
- Down + closing
- —
- Monthly P&I
- —
- Monthly cashflow
- —
- DSCR
- —
- Eligible?
- —
Personal DTI + credit; lowest rate.
DSCR
20% down · 8.5% · 30yr
- Down + closing
- —
- Monthly P&I
- —
- Monthly cashflow
- —
- DSCR
- —
- Eligible?
- —
No personal income docs; deal must DSCR.
Hard money
10% down · 12.0% · 12mo
- Down + closing
- —
- Monthly P&I
- —
- Monthly cashflow
- —
- DSCR
- —
- Eligible?
- —
Short-term bridge; refi at stabilization.
Listing history 30 events
-
2026-06-19days on market $125,000 Active 211 DOM
-
2026-06-18days on market $125,000 Active 210 DOM
-
2026-06-17days on market $125,000 Active 209 DOM
-
2026-06-16days on market $125,000 Active 208 DOM
-
2026-06-15days on market $125,000 Active 207 DOM
-
2026-06-14days on market $125,000 Active 205 DOM
-
2026-06-12days on market $125,000 Active 204 DOM
-
2026-06-09days on market $125,000 Active 201 DOM
-
2026-06-08days on market $125,000 Active 200 DOM
-
2026-06-07days on market $125,000 Active 199 DOM
-
2026-06-05days on market $125,000 Active 196 DOM
-
2026-06-02days on market $125,000 Active 194 DOM
-
2026-06-01days on market $125,000 Active 193 DOM
-
2026-05-31days on market $125,000 Active 192 DOM
-
2026-05-30days on market $125,000 Active 191 DOM
-
2026-05-15price $125,000
-
2026-05-14status Active
-
2026-04-12status Pending
-
2026-01-14price $124,000
-
2025-10-19$125,000 Active
-
2016-07-20historical
-
2016-06-04price $53,000
-
2016-06-04status Active
-
2016-05-31historical
-
2016-05-31status Active
-
2016-05-27historical
-
2016-05-09price $50,000
-
2016-01-20$63,500 Active
-
2015-04-28soldstatus $44,000
-
2006-05-16soldstatus $45,000
ⓘ Source: listings_history table (triggers on properties + properties_extension) + one-shot
backfill from property_details.listing_events for pre-trigger history.
Tax reassessment forecast OK · Resets to sale price
- Current annual tax
- $698 · $58/mo
- Projected year-2 tax
- $1,125 · $94/mo
- Expected delta
- +$427/yr (+$36/mo · 61.2%)
ⓘ Screening estimate from a state-policy table — verify with the county assessor before closing.
Climate risk First Street
- Flood 1/10 Low FEMA zone X (unshaded) · 0% chance over 30 yrs
- Wildfire 8/10 Severe
- Heat 6/10 Major 7 d/yr ≥110°F today · 19 d/yr by 30 yrs out
- Wind 3/10 Moderate 6% chance of damaging wind over 30 yrs
- Air quality 2/10 Low 1 unhealthy d/yr today · 1 by 30 yrs out
Nearby sold comps map
Loading sold comps map…
Walkable amenities ~0.75 mi
Loading nearby amenities…
Taxation est. · year 1
- Rental income
- $13,209
- − Mortgage interest
- −$7,002
- − Property taxes
- −$698
- − Insurance
- −$625
- − Repairs & maintenance
- −$1,057
- − Management
- −$1,057
- − Depreciation
- −$3,636
- Taxable loss
- −$865
- Est. tax savings @ 24.0%
- +$208
- After-tax cash flow
- $1,454/yr
For passive investors: Depreciation is non-cash, so a rental often shows a tax loss while cash-flowing — sheltering income. Rental losses are passive: they offset passive income freely, and up to $25,000/yr can offset ordinary (W-2) income if you actively participate and your MAGI is under $100k (phasing out to $0 by $150k); unused losses carry forward. On sale, claimed depreciation is recaptured at up to 25%, and gains may owe capital-gains tax (a 1031 exchange can defer both). Figures are a year-1 estimate at your 24.0% rate — not tax advice; consult a CPA.
Schools (NCES district)
- District
- Prague
- NCES district ID
- 4024930
- Math proficiency
- 31% ▼ -13.00%
- Reading proficiency
- 36% ▼ -8.00%
- Median HH income
- $47,676
- Composite
- 28.87/100
- National rank
- #6643
- State rank
- #45 of 270 in OK
Livability — Prague
- Score
- 63/100
- State rank
- #197
- US rank
- #15000
Category grades
Schools grade is shown separately in the Schools card above.
Census & demographics
- Census place
- Prague, OK
- Population (ZIP)
- 4,803
Population outlook (Lincoln County) Hauer SSP2
- Today (2025)
- 36,104 people
- By 2030
- 36,435 · +0.9%
- By 2040
- 36,696 · +1.6%
- By 2050
- 36,216 · +0.3%
- By 2075
- 35,057 · -2.9%
- By 2100
- 31,333 · -13.2%
Race, ethnicity, and origin ACS 2023
- Neighborhood character
- Predominantly White (80%)
- Race & ethnicity
- White 80% Two or more races 8% Native American 7% Hispanic / Latino 6%
- Hispanic origin (detail)
- Mexican 3%
- Common ancestry
- Italian 2% Serbian 1% Slovak 1%
- Foreign-born
- 1% · Canada
- Languages at home
- 98% English-only · Spanish 1%
Political lean MEDSL · Lincoln
- 2024 margin
- Solid R (+63.3) · D 17.5% · R 80.8% · Other 1.7%
- 2008→2024 swing
- -13.4pp toward R · 2008: -49.8pp · 2024: -63.3pp
- All cycles
- 2024: R+63.3 2020: R+63.2 2016: R+60.1 2012: R+49.0 2008: R+49.8
Not yet ingested
- Civics
- —
Market trends
- HPI YoY
- ▲ 8.87%
- Current HPI
- 325.0194
- Rent YoY
- —
- Metro
- —
- State GDP YoY
- ▲ 1.55%
- F500 in state
- 6
Industry mix (Fortune 500 HQ in OK)
| Industry | F500 HQs | Revenue |
|---|---|---|
| Energy | 3 | $48B |
|
||
Price history
+177.8% since first listed15 events — show timeline
- 2026-05-15 Price Changed $125,000 MLSOK
- 2026-05-14 Relisted — MLSOK
- 2026-04-12 Pending — MLSOK
- 2026-01-14 Price Changed $124,000 MLSOK
- 2025-10-19 Listed $125,000 MLSOK
- 2016-07-20 Listing Removed — MLSOK
- 2016-06-04 Price Changed $53,000 MLSOK
- 2016-06-04 Relisted — MLSOK
- 2016-05-31 Listing Removed — MLSOK
- 2016-05-31 Relisted — MLSOK
- 2016-05-27 Listing Removed — MLSOK
- 2016-05-09 Price Changed $50,000 MLSOK
- 2016-01-20 Listed $63,500 MLSOK
- 2015-04-28 Sold (Public Records) $44,000 Public Records
- 2006-05-16 Sold (Public Records) $45,000 Public Records
Property tax history
+11.2%/yrLatest (2025): $698 · +8.0% YoY. Source: county tax records.
Cash-flow waterfall
monthlySold comps — $/sqft
last 12 mo · ≤1 miLoading sold comps…