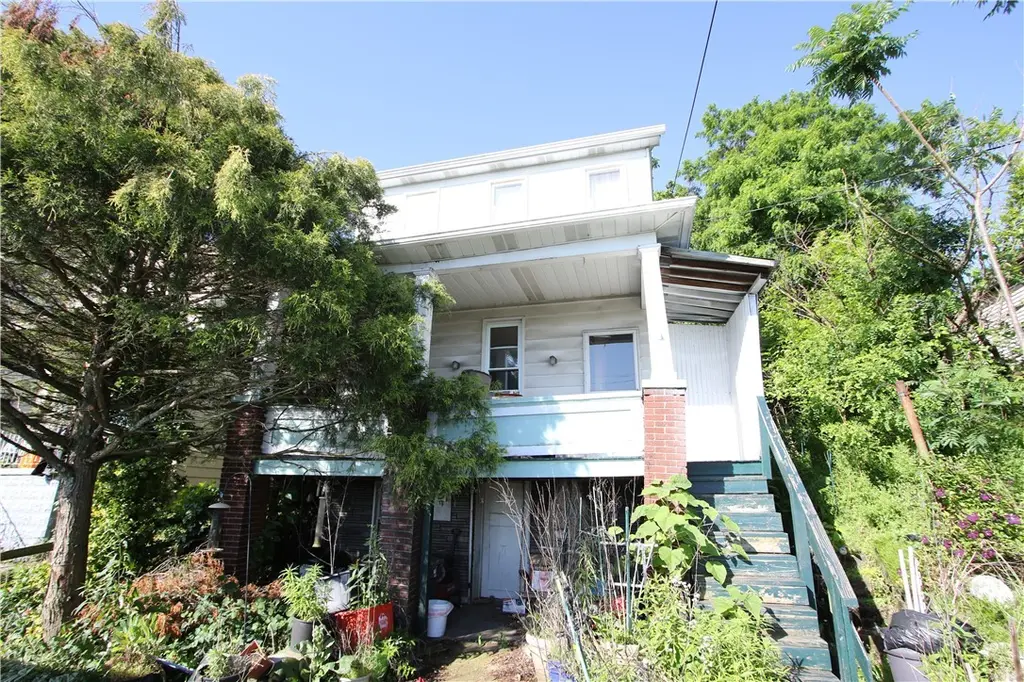
915 Oakland Ave · Charleroi, PA
Flood risk 1/10 · Minimal
- FEMA flood zone
- X (unshaded)
- Chance of flooding over 30 yrs
- 0.0%
- Est. flood insurance / yr
- $473 – $860
Fire risk 2/10 · Minimal
- Est. fire insurance / yr
- $511 – $949
Heat risk 4/10 · Minor
- Hot days now (above 97°F)
- 7 days/yr
- Hot days in 30 yrs
- 19 days/yr
Wind risk 2/10 · Minimal
- Chance of severe wind over 30 yrs
- —
Air-quality risk 2/10 · Minimal
- Unhealthy air days now
- 1 days/yr
- Unhealthy air days in 30 yrs
- 2 days/yr
Risk factors via First Street. Map © Google.
Why this score? — see what drove the D+ grade
The composite is a weighted blend of 9 inputs, each scored 0–100. Each bar is that input's sub-score; the figure is the points it added to the 100-point composite (weight × sub-score).
- Cash flow +15.0/30.0
- ARV discount +7.5/15.0
- 1% rule +5.0/10.0
- DSCR +5.0/10.0
- Appreciation +4.1/10.0
- Livability +3.8/5.0
- Schools +3.0/10.0
- Rent growth +2.5/5.0
- Condition / age +2.5/5.0
$15,000
🖨 Deal sheet 📄 Offer letter ✓ Due diligence
Listing remarks MLS
A PERFECT STARTER OR INVESTMENT PROPERTY LG NEWER EAT-IN KITCHEN NEWER CARPET ING THROUGHOUT A MUST SELL
Key facts
- 5,501 sq ft lot
- 2 parking spots
- Built 1920
Property features AI
Finance
- HOA & community: Public transportation access
Exterior
- Parking: On-street parking; 2 total parking spaces
- Utilities: Public water; Public sewer
- Home design: 2-story home; Resale property; Composition roof; Aluminum siding
- Construction: Aluminum siding construction; Composition roof
- Exterior features: 49 x 107 x 49 x 109 lot (approx. 0.12 acres)
Interior
- Kitchen: Kitchen (main level) — 17 x 13
- Bedrooms: Bedroom (upper level) — 13 x 11
- Flooring: Carpet
- Bathrooms: 2 full bathrooms
- Heating & cooling: Forced-air gas heating
- Interior features: Carpet flooring; Full walk-out basement
Neighborhood map
What this means for you Summary
Snapshot
- This is a 2-bed/1.0-bath single-family listed at $15k.
Deal economics
- At list price, monthly cash flow is $815 ($10k/yr) — positive.
- The deal already cash-flows at list — no discount required.
- Meets the 1% rule at list price ($1k rent vs $15k).
- Cap rate 71.5% vs local median 15.3% in Charleroi — top-decile yield for the area; either an underpriced asset or a hidden risk that comps aren't pricing in. Stress-test before assuming the spread holds.
Location & tenants
- Location reads 76/100 on livability (#382 in PA, #3,416 nationally) — a middle-class / working-renter tenant base. Strengths: cost of living A+, housing A+, crime A-; Watch: schools D+, employment F.
- Charleroi SD (rural): math 20% / reading 51% proficiency, ranked #421 of 539 in PA (top 78%) — families likely to look elsewhere, expect single-tenant / working-renter base with shorter leases.
- Market conditions: 87 active listings in the ZIP; 5 comparable units currently listed for rent nearby; rentals leasing fast (median 2d on market — plan ~1-2 weeks tenant-placement turnaround); 489 units permitted in Washington County in 2024 (30 in 5+ unit buildings).
Forward outlook
- Local home prices are declining (-1.8%/yr); year-one equity from $104 of loan paydown is wiped out by about $274 of value loss. Plan a longer hold.
- Washington County population projected to shrink 6% by 2050 — rents likely to lag national; underwrite the cash flow, not the appreciation.
- At projected returns (-1.8% appreciation + 3.0% rent growth), your $4k cash investment doubles in ~1 year — after that, you're playing with house money.
Negotiation context
- Only 3 days on market — expect competitive offers; lowballing is unlikely to land.
- 2 sale attempts since 29y ago with the ask held roughly flat each time — persistent listings suggest the price (not the market) is what's stuck; bring a comps-based counter.
Risks & watch-outs
- Watch-outs: built in 1920 — expect roof / HVAC / electrical / plumbing capex.
Questions for the listing agent
- Built in 1920 — when were the roof, HVAC, electrical panel, plumbing, and water heater last replaced?
- Is there a deadline driving the sale (1031 exchange, divorce, estate, relocation)? That informs how much negotiation room exists.
- Schools are D-rated, which usually means shorter tenancies and higher turnover. Who's the typical renter profile here, and what's been the actual vacancy rate?
- The area grade is low — what's the realistic commute time and amenity access for the typical tenant pool here? Any planned neighborhood developments (good or bad) we should know about?
- What's the average days-on-market for RENTAL listings here right now (not sales)? A rising rental-DOM trend means longer vacancies and softer asking-rent achievability than the comps imply.
- What's the recent tenant-quality profile in this submarket — average credit score on applications, eviction rate, late-payment / NSF rate, and stable-employment percentage? A property-management company in the area should have these aggregated.
- How much new for-sale + rental construction is in the pipeline within 1–3 miles? Heavy new supply typically softens prices + rents 12–24 months out; constrained supply supports both.
Investment metrics
- 1% rule
- 7.75% ✓
- Cap rate
- 71.46%
- Cash-on-cash
- 232.74%
- DSCR
- 11.36
- GRM
- 1.1
CMA / ARV
- ARV (on-the-fly)
- $104,760
- Comps found
- 12
Show comp detail 12 sales within ~0.75 mi
| Address | Dist | Beds/Ba | Sqft | Sold | Price | $/sf | Match |
|---|---|---|---|---|---|---|---|
| 705 Meadow Ave | 0.21mi | 2/1.0 | 1,100 (+2%) | 7mo | $74,900 | $68 | 81 |
| 924 5th St | 0.20mi | 2/2.0 | 1,087 (+1%) | 6mo | $58,000 | $53 | 80 |
| 301 Fremont Rd | 0.13mi | 2/2.0 | 1,087 (+1%) | 16mo | $122,500 | $113 | 76 |
| 37 Moyer Ave | 0.32mi | 3/1.0 (+1) | 1,088 (+1%) | 18mo | $162,000 | $149 | 64 |
| 611 Oakland Ave | 0.25mi | 3/1.5 (+1) | 1,100 (+2%) | 22mo | $179,000 | $163 | 60 |
| 412 Oakland Ave | 0.40mi | 3/1.0 (+1) | 1,050 (-3%) | 22mo | $84,000 | $80 | 54 |
| 800 Ridge Ave | 0.52mi | 3/1.5 (+1) | 1,179 (+9%) | 2mo | $164,000 | $139 | 52 |
| 730 Washington Ave | 0.30mi | 3/1.5 (+1) | 1,175 (+9%) | 16mo | $32,000 | $27 | 51 |
| 209 Crest Ave | 0.63mi | 2/2.0 | 1,120 (+4%) | 11mo | $40,000 | $36 | 51 |
| 415 Oakland Ave | 0.39mi | 3/3.0 (+1) | 1,216 (+13%) | 1mo | $40,000 | $33 | 47 |
| 404 Meadow Ave | 0.44mi | 2/1.5 | 1,240 (+15%) | 20mo | $120,000 | $97 | 36 |
| 702 1st St | 0.71mi | 3/2.0 (+1) | 1,218 (+13%) | 16mo | $145,000 | $119 | 24 |
Match score weights: distance 35% · size 25% · config 20% · recency 20%. Top-matched comps best support the ARV.
Projected returns pro-forma
-1.83% appreciation · 3.0% rent growth · sell at horizon
- IRR
- —
- Equity multiple
- 12.96×
- Total profit
- $50,216
- Equity at exit
- $3,033
- IRR
- —
- Equity multiple
- 27.49×
- Total profit
- $111,277
- Equity at exit
- $2,707
Cash invested: $4,200 (down + closing). Projections, not guarantees.
Landlord ↔ Tenant lean methodology
- Overall (STATE)
- 62 Landlord-Friendly
- State Pennsylvania
- 62 Landlord-Friendly · EVEN
- County
- — inherits STATE
- City
- — inherits STATE
ZIP-level market 15022
- Home prices YoY
- -1.0%
- Active inventory
- 87
- Price-to-rent
- 1.1×
Monthly cashflow live
- Estimated rent
- $1,162 high interval (Pro) →
- Mortgage (P&I)
- −$79
- Tax est. 1.5%
- −$19 /mo · $225/yr
- Insurance
- −$6
- HOA
- −$0
- Vacancy / Maint / Mgmt
- −$244
- Net cashflow
- $815
Break-even live
UW: 25.0% down · 7.5% · 30yr · 1.5% tax · 5.0% vac · 8.0% maint · 8.0% mgmt
Financing live
Cash to close
- Down payment
- $3,750
- Closing costs
- $450
- Reserves months
- —
- Total cash needed
- —
Loan-product check · same deal, 3 products live
Conventional
25% down · 7.5% · 30yr
- Down + closing
- —
- Monthly P&I
- —
- Monthly cashflow
- —
- DSCR
- —
- Eligible?
- —
Personal DTI + credit; lowest rate.
DSCR
20% down · 8.5% · 30yr
- Down + closing
- —
- Monthly P&I
- —
- Monthly cashflow
- —
- DSCR
- —
- Eligible?
- —
No personal income docs; deal must DSCR.
Hard money
10% down · 12.0% · 12mo
- Down + closing
- —
- Monthly P&I
- —
- Monthly cashflow
- —
- DSCR
- —
- Eligible?
- —
Short-term bridge; refi at stabilization.
Rent comps 5 comps
| Address | Beds | Baths | Sqft | Rent | $/sqft | DOM | Units | Dist |
|---|---|---|---|---|---|---|---|---|
| 1204 Lower Meadow Ave Charleroi, PA | 3.0 | 1.0 | 1024 | $1,150 | $1.12 | 1d | 1 | 0.27mi |
| 1022 McKean Ave Charleroi, PA | 3.0 | 3.0 | 1344 | $1,450 | $1.08 | 1d | 1 | 0.37mi |
| 1221 Graham Ave Monessen, PA | 3.0 | 1.0 | 960 | $1,300 | $1.35 | 1d | 1 | 0.94mi |
| 925 Leeds Ave Monessen, PA | 2.0 | 1.0 | 1000 | $700 | $0.70 | 14d | 1 | 1.21mi |
| 925 Leeds Ave Monessen, PA | 2.0 | 1.0 | 1000 | $700 | $0.70 | 1d | 1 | 1.21mi |
Listing history 3 events
-
2026-06-02status $15,000 Pending 3 DOM
-
2026-06-01days on market $15,000 Active 3 DOM
-
2026-05-31days on market $15,000 Active 2 DOM
ⓘ Source: listings_history table (triggers on properties + properties_extension) + one-shot
backfill from property_details.listing_events for pre-trigger history.
Climate risk First Street
- Flood 1/10 Low FEMA zone X (unshaded) · 0% chance over 30 yrs
- Wildfire 2/10 Low
- Heat 4/10 Moderate 7 d/yr ≥97°F today · 19 d/yr by 30 yrs out
- Wind 2/10 Low
- Air quality 2/10 Low 1 unhealthy d/yr today · 2 by 30 yrs out
Nearby sold comps map
Loading sold comps map…
Walkable amenities ~0.75 mi
Loading nearby amenities…
Taxation est. · year 1
- Rental income
- $13,948
- − Mortgage interest
- −$840
- − Property taxes
- −$225
- − Insurance
- −$75
- − Repairs & maintenance
- −$1,116
- − Management
- −$1,116
- − Depreciation
- −$436
- Taxable income
- $10,140
- Est. tax owed @ 24.0%
- −$2,434
- After-tax cash flow
- $7,341/yr
For passive investors: Depreciation is non-cash, so a rental often shows a tax loss while cash-flowing — sheltering income. Rental losses are passive: they offset passive income freely, and up to $25,000/yr can offset ordinary (W-2) income if you actively participate and your MAGI is under $100k (phasing out to $0 by $150k); unused losses carry forward. On sale, claimed depreciation is recaptured at up to 25%, and gains may owe capital-gains tax (a 1031 exchange can defer both). Figures are a year-1 estimate at your 24.0% rate — not tax advice; consult a CPA.
Schools (NCES district)
- District
- Charleroi SD
- NCES district ID
- 4205640
- Math proficiency
- 20% ▼ -19.00%
- Reading proficiency
- 51% ▼ -11.00%
- Median HH income
- $40,410
- Composite
- 29.72/100
- National rank
- #6450
- State rank
- #421 of 539 in PA
Livability — Charleroi
- Score
- 76/100
- State rank
- #382
- US rank
- #3416
Category grades
Schools grade is shown separately in the Schools card above.
Census & demographics
- Census place
- Charleroi, PA
- Population (ZIP)
- 10,044
Population outlook (Washington County) Hauer SSP2
- Today (2025)
- 208,060 people
- By 2030
- 207,168 · -0.4%
- By 2040
- 202,738 · -2.6%
- By 2050
- 195,269 · -6.1%
- By 2075
- 175,588 · -15.6%
- By 2100
- 145,827 · -29.9%
Race, ethnicity, and origin ACS 2023
- Neighborhood character
- Predominantly White (87%)
- Race & ethnicity
- White 87% Two or more races 6% Black 6%
- Common ancestry
- Romanian 8% Lithuanian 3% Scotch-Irish 2%
- Foreign-born
- 2% · Canada
- Languages at home
- 98% English-only · Spanish 1%
Political lean MEDSL · Washington
- 2024 margin
- Strong R (+25.5) · D 36.9% · R 62.4%
- 2008→2024 swing
- -20.8pp toward R · 2008: -4.7pp · 2024: -25.5pp
- All cycles
- 2024: R+25.5 2020: R+22.8 2016: R+25.3 2012: R+13.3 2008: R+4.7
Not yet ingested
- Civics
- —
Market trends
- HPI YoY
- ▼ -1.83%
- Current HPI
- 174.218
- Rent YoY
- —
- Metro
- —
- State GDP YoY
- ▲ 1.68%
- F500 in state
- 34
Industry mix (Fortune 500 HQ in PA)
| Industry | F500 HQs | Revenue |
|---|---|---|
| Healthcare | 2 | $309B |
|
||
| Insurance | 2 | $27B |
|
||
| Telecommunications / Media | 1 | $124B |
|
||
| Industrial Distribution | 1 | $22B |
|
||
| Financial Services | 1 | $20B |
|
||
| Chemicals / Materials | 1 | $18B |
|
||
Price history
-23.1% since first listed4 events — show timeline
- 2026-05-28 Listed $15,000 West Penn MLS
- 1997-11-20 Sold (Public Records) $17,500 Public Records
- 1997-11-20 Sold (MLS) $17,500 West Penn MLS
- 1997-07-01 Listed $19,500 West Penn MLS
Property tax history
+1.7%/yrLatest (2026): $1,257 · +1.2% YoY. Source: county tax records.
Cash-flow waterfall
monthlySold comps — $/sqft
last 12 mo · ≤1 miLoading sold comps…