 🔨 Auction
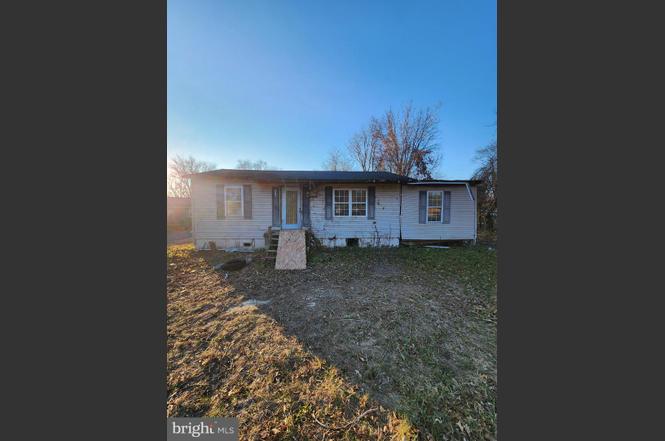
6824 Kent Rd · Owings, MD
Flood risk 1/10 · Minimal
- FEMA flood zone
- X (unshaded)
- Chance of flooding over 30 yrs
- 0.0%
- Est. flood insurance / yr
- $507 – $1,088
Fire risk 4/10 · Minor
- Est. fire insurance / yr
- $755 – $1,403
Heat risk 8/10 · Major
- Hot days now (above 102°F)
- 7 days/yr
- Hot days in 30 yrs
- 16 days/yr
Wind risk 6/10 · Moderate
- Chance of severe wind over 30 yrs
- 64.0%
Air-quality risk 2/10 · Minimal
- Unhealthy air days now
- 1 days/yr
- Unhealthy air days in 30 yrs
- 2 days/yr
Risk factors via First Street. Map © Google.
Why this score? — see what drove the F grade
The composite is a weighted blend of 9 inputs, each scored 0–100. Each bar is that input's sub-score; the figure is the points it added to the 100-point composite (weight × sub-score).
- ARV discount +7.5/15.0
- Appreciation +5.5/10.0
- Livability +3.6/5.0
- Schools +3.3/10.0
- Cash flow +2.8/30.0
- Rent growth +2.5/5.0
- Condition / age +2.5/5.0
- 1% rule +0.0/10.0
- DSCR +0.0/10.0
$20,000
🖨 Deal sheet 📄 Offer letter ✓ Due diligence
Listing remarks
TO BE OFFERED FOR SALE AT PUBLIC AUCTION AT THE PROPERTY ON WEDNESDAY APRIL 15, 2026 AT 11AM NOON BY JOE AVAMPATO, AUCTIONEER, IN COOPERATION WITH ALBERTI REALTY. THE LIST PRICE IS THE SUGGESTED OPENING BID AND NOT THE ANTICIPATED SALE PRICE. $10,000 CASH OR CERTIFIED CHECK CONTRACT DEPOSIT REQUIRED. SETTLEMENT ON OR BEFORE MAY 15, 2026. INVESTOR ALERT! SINGLE FAMILY RANCHER IN NEED OF REHAB IN SUNDERLAND!
Key facts
- 0.5 acre lot
- Built 1962
- Listed 87 days
Neighborhood map
What this means for you Summary
Snapshot
- This is a 2-bed/1.0-bath single-family listed at $20k.
Deal economics
- At list price, monthly cash flow is $-923 ($-11k/yr) — negative.
- The deal already cash-flows at list — no discount required.
- Meets the 1% rule at list price ($1k rent vs $20k).
- Recommended offer: $19k (6.0% below list) — sets the bar for market timing.
Location & tenants
- Location reads 72/100 on livability (#139 in MD) — a middle-class / working-renter tenant base. Strengths: crime A+, employment A+, housing A+; Watch: amenities F, cost of living F, health & safety F.
- Calvert County Public Schools (rural): math 23% / reading 44% proficiency, ranked #5 of 24 in MD (top 21%) — families likely to look elsewhere, expect single-tenant / working-renter base with shorter leases; only 19% free/reduced lunch — higher-income household profile.
- Zoned schools: Northern High (math 65% / reading 77%, grade B+, #37 of 222 statewide, top 17%, 1,493 students, 17% FRL) — zoned schools at 17% FRL track the district average.
- Zoned-school proficiency averages 71% at this address vs 34% district-wide (+38 pts) — the actual schools serving this property are materially stronger than the Calvert County Public Schools average implies; a family-tenant draw the district grade alone would hide.
- Market conditions: 10 active listings in the ZIP; 101 units permitted in Calvert County in 2024 (0 in 5+ unit buildings).
Forward outlook
- In year one you build about $5k of equity ($2k loan paydown + $3k appreciation (1.0% local appreciation)).
- By year 7, paydown + projected appreciation supports a ~$31k cash-out refi (75% LTV) — recoverable capital for the next deal without selling this one.
Negotiation context
- It's been on market 87 days — a 6% lower offer ($19k) is reasonable based on typical stale-listing flexibility.
- 2 sale attempts; this cycle's ask has dropped $110k (85%) from the opening price — seller is motivated, your offer sets the floor, not the list.
Risks & watch-outs
- Watch-outs: property tax is 20.8% of price.
- Climate carrying-cost: major wind risk, 64% chance of damaging wind over 30y; extreme-heat days projected 7→16/yr by 2055 (HVAC capex compounding) — expect insurance premiums to compound above CPI over the hold.
Questions for the listing agent
- What do current leases actually rent for vs. the listed asking? Can we see a recent rent roll and the last 12 months of T-12 income?
- It's been on market 87 days. Have you received any prior offers? Is the seller open to a 6% concession, seller financing, or rate buy-down credit?
- Built in 1962 — when were the roof, HVAC, electrical panel, plumbing, and water heater last replaced?
- Property tax is high relative to price — has the assessment been appealed recently, and will the sale trigger a re-assessment?
- Why hasn't it sold? Are there any deal-killer items the seller is aware of (foundation, flood, title, zoning, code violations)?
- Is there a deadline driving the sale (1031 exchange, divorce, estate, relocation)? That informs how much negotiation room exists.
- Schools are B-rated — typically a magnet for longer-tenancy family renters. What's the average tenant stay here, and is there a school-zone premium baked into asking?
- The area grade is low — what's the realistic commute time and amenity access for the typical tenant pool here? Any planned neighborhood developments (good or bad) we should know about?
- What's the average days-on-market for RENTAL listings here right now (not sales)? A rising rental-DOM trend means longer vacancies and softer asking-rent achievability than the comps imply.
- What's the recent tenant-quality profile in this submarket — average credit score on applications, eviction rate, late-payment / NSF rate, and stable-employment percentage? A property-management company in the area should have these aggregated.
- How much new for-sale + rental construction is in the pipeline within 1–3 miles? Heavy new supply typically softens prices + rents 12–24 months out; constrained supply supports both.
Investment metrics
- 1% rule
- 0.45% ✗
- Cap rate
- 2.30%
- Cash-on-cash
- -14.27%
- DSCR
- 0.36
- GRM
- 18.4
CMA / ARV
- ARV (on-the-fly)
- $277,200
- Comps found
- 2
Show comp detail 2 sales within ~0.75 mi
| Address | Dist | Beds/Ba | Sqft | Sold | Price | $/sf | Match |
|---|---|---|---|---|---|---|---|
| 6824 Kent Rd | 0.00mi | 2/1.5 | 1,008 (0%) | 1mo | $105,000 | $104 | 97 |
| 6730 Solomons Island Rd | 0.14mi | 3/1.0 (+1) | 1,038 (+3%) | 15mo | $285,000 | $275 | 71 |
Match score weights: distance 35% · size 25% · config 20% · recency 20%. Top-matched comps best support the ARV.
Projected returns pro-forma
0.97% appreciation · 3.0% rent growth · sell at horizon
- IRR
- -13.9%
- Equity multiple
- 0.30×
- Total profit
- $-54,044
- Equity at exit
- $94,155
- IRR
- -7.5%
- Equity multiple
- 0.08×
- Total profit
- $-71,194
- Equity at exit
- $124,755
Cash invested: $77,616 (down + closing). Projections, not guarantees.
Landlord ↔ Tenant lean methodology
- Overall (STATE)
- 27 Tenant-Leaning
- State Maryland
- 27 Tenant-Leaning · D+14
- County
- — inherits STATE
- City
- — inherits STATE
ZIP-level market 20689
- Home prices YoY
- 0.4%
- Active inventory
- 10
- Price-to-rent
- 1.3×
Monthly cashflow live
- Estimated rent
- $1,256 medium interval (Pro) →
- Mortgage (P&I)
- −$1,454
- Tax est. 1.5%
- −$346 /mo · $4,158/yr
- Insurance
- −$116
- HOA
- −$0
- Vacancy / Maint / Mgmt
- −$264
- Net cashflow
- $-923
Break-even live
UW: 25.0% down · 7.5% · 30yr · 1.5% tax · 5.0% vac · 8.0% maint · 8.0% mgmt
Financing live
Cash to close
- Down payment
- $69,300
- Closing costs
- $8,316
- Reserves months
- —
- Total cash needed
- —
Loan-product check · same deal, 3 products live
Conventional
25% down · 7.5% · 30yr
- Down + closing
- —
- Monthly P&I
- —
- Monthly cashflow
- —
- DSCR
- —
- Eligible?
- —
Personal DTI + credit; lowest rate.
DSCR
20% down · 8.5% · 30yr
- Down + closing
- —
- Monthly P&I
- —
- Monthly cashflow
- —
- DSCR
- —
- Eligible?
- —
No personal income docs; deal must DSCR.
Hard money
10% down · 12.0% · 12mo
- Down + closing
- —
- Monthly P&I
- —
- Monthly cashflow
- —
- DSCR
- —
- Eligible?
- —
Short-term bridge; refi at stabilization.
Listing history 6 events
-
2026-04-15status Pending
-
2026-03-25price $20,000
-
2026-01-18$129,999 Active
-
2026-01-09historical
-
2026-01-08$135,000 Active
-
2025-10-14soldstatus $73,000
ⓘ Source: listings_history table (triggers on properties + properties_extension) + one-shot
backfill from property_details.listing_events for pre-trigger history.
Climate risk First Street
- Flood 1/10 Low FEMA zone X (unshaded) · 0% chance over 30 yrs
- Wildfire 4/10 Moderate
- Heat 8/10 Severe 7 d/yr ≥102°F today · 16 d/yr by 30 yrs out
- Wind 6/10 Major 64% chance of damaging wind over 30 yrs
- Air quality 2/10 Low 1 unhealthy d/yr today · 2 by 30 yrs out
Nearby sold comps map
Loading sold comps map…
Walkable amenities ~0.75 mi
Loading nearby amenities…
Taxation est. · year 1
- Rental income
- $15,075
- − Mortgage interest
- −$15,528
- − Property taxes
- −$4,158
- − Insurance
- −$1,386
- − Repairs & maintenance
- −$1,206
- − Management
- −$1,206
- − Depreciation
- −$8,064
- Taxable loss
- −$16,472
- Est. tax savings @ 24.0%
- +$3,953
- After-tax cash flow
- $-7,125/yr
For passive investors: Depreciation is non-cash, so a rental often shows a tax loss while cash-flowing — sheltering income. Rental losses are passive: they offset passive income freely, and up to $25,000/yr can offset ordinary (W-2) income if you actively participate and your MAGI is under $100k (phasing out to $0 by $150k); unused losses carry forward. On sale, claimed depreciation is recaptured at up to 25%, and gains may owe capital-gains tax (a 1031 exchange can defer both). Figures are a year-1 estimate at your 24.0% rate — not tax advice; consult a CPA.
Schools (NCES district)
- District
- Calvert County Public Schools
- NCES district ID
- 2400150
- Math proficiency
- 23% ▼ -29.00%
- Reading proficiency
- 44% ▼ -15.00%
- Median HH income
- $94,392
- Composite
- 33.27/100
- National rank
- #5511
- State rank
- #5 of 24 in MD
Livability — Owings
- Score
- 72/100
- State rank
- #139
- US rank
- #6016
Category grades
Schools grade is shown separately in the Schools card above.
Census & demographics
- Population (ZIP)
- 2,046
Population outlook (Calvert County) Hauer SSP2
- Today (2025)
- 94,825 people
- By 2030
- 96,197 · +1.4%
- By 2040
- 96,954 · +2.2%
- By 2050
- 94,628 · -0.2%
- By 2075
- 91,576 · -3.4%
- By 2100
- 83,431 · -12.0%
Race, ethnicity, and origin ACS 2023
- Neighborhood character
- Predominantly White (74%)
- Race & ethnicity
- White 74% Black 21% Two or more races 3% Asian 2%
- Common ancestry
- Romanian 5% Irish 2% Slovak 1%
- Foreign-born
- 2%
- Languages at home
- 99% English-only · Russian/Polish/Slavic 1% Other Asian/Pacific 1%
Political lean MEDSL · Calvert
- 2024 margin
- R (+11.0) · D 43.5% · R 54.5% · Other 2.0%
- 2008→2024 swing
- -4.6pp toward R · 2008: -6.3pp · 2024: -11.0pp
- All cycles
- 2024: R+11.0 2020: R+5.6 2016: R+18.4 2012: R+8.2 2008: R+6.3
Not yet ingested
- Civics
- —
Market trends
- HPI YoY
- ▲ 0.97%
- Current HPI
- 265.3016
- Rent YoY
- —
- Metro
- —
- State GDP YoY
- ▲ 2.97%
- F500 in state
- 12
Industry mix (Fortune 500 HQ in MD)
| Industry | F500 HQs | Revenue |
|---|---|---|
| Aerospace / Defense | 1 | $71B |
|
||
| Utilities | 1 | $25B |
|
||
| Hotels | 1 | $24B |
|
||
| Consumer Goods | 1 | $7B |
|
||
| Real Estate | 1 | $6B |
|
||
| Chemicals | 1 | $2B |
|
||
Price history
-72.6% since first listed6 events — show timeline
- 2026-04-15 Pending — BRIGHT MLS
- 2026-03-25 Price Changed $20,000 BRIGHT MLS
- 2026-01-18 Listed $129,999 BRIGHT MLS
- 2026-01-09 Listing Removed — BRIGHT MLS
- 2026-01-08 Listed $135,000 BRIGHT MLS
- 2025-10-14 Sold (Public Records) $73,000 Public Records
Property tax history
+0.5%/yrLatest (2025): $1,469 · +1.7% YoY. Source: county tax records.
Cash-flow waterfall
monthlySold comps — $/sqft
last 12 mo · ≤1 miLoading sold comps…