 Multi-family
3810 Avenue H · New York, NY
Flood risk 1/10 · Minimal
- FEMA flood zone
- X (unshaded)
- Chance of flooding over 30 yrs
- 0.0%
- Est. flood insurance / yr
- $507 – $1,088
Fire risk 1/10 · Minimal
- Est. fire insurance / yr
- $691 – $1,283
Heat risk 7/10 · Major
- Hot days now (above 97°F)
- 7 days/yr
- Hot days in 30 yrs
- 16 days/yr
Wind risk 6/10 · Moderate
- Chance of severe wind over 30 yrs
- 62.0%
Air-quality risk 5/10 · Moderate
- Unhealthy air days now
- 6 days/yr
- Unhealthy air days in 30 yrs
- 8 days/yr
Risk factors via First Street. Map © Google.
Why this score? — see what drove the D+ grade
The composite is a weighted blend of 9 inputs, each scored 0–100. Each bar is that input's sub-score; the figure is the points it added to the 100-point composite (weight × sub-score).
- Cash flow +15.0/30.0
- ARV discount +7.5/15.0
- 1% rule +5.0/10.0
- DSCR +5.0/10.0
- Schools +5.0/10.0
- Livability +3.8/5.0
- Rent growth +3.0/5.0
- Condition / age +2.5/5.0
- Appreciation +0.0/10.0
$1,900
🖨 Deal sheet 📄 Offer letter ✓ Due diligence
Multi-family units
County records classify this as Multi-Family (2-4 Unit). Listing-text estimate: 1 unit. estimate disagrees with records
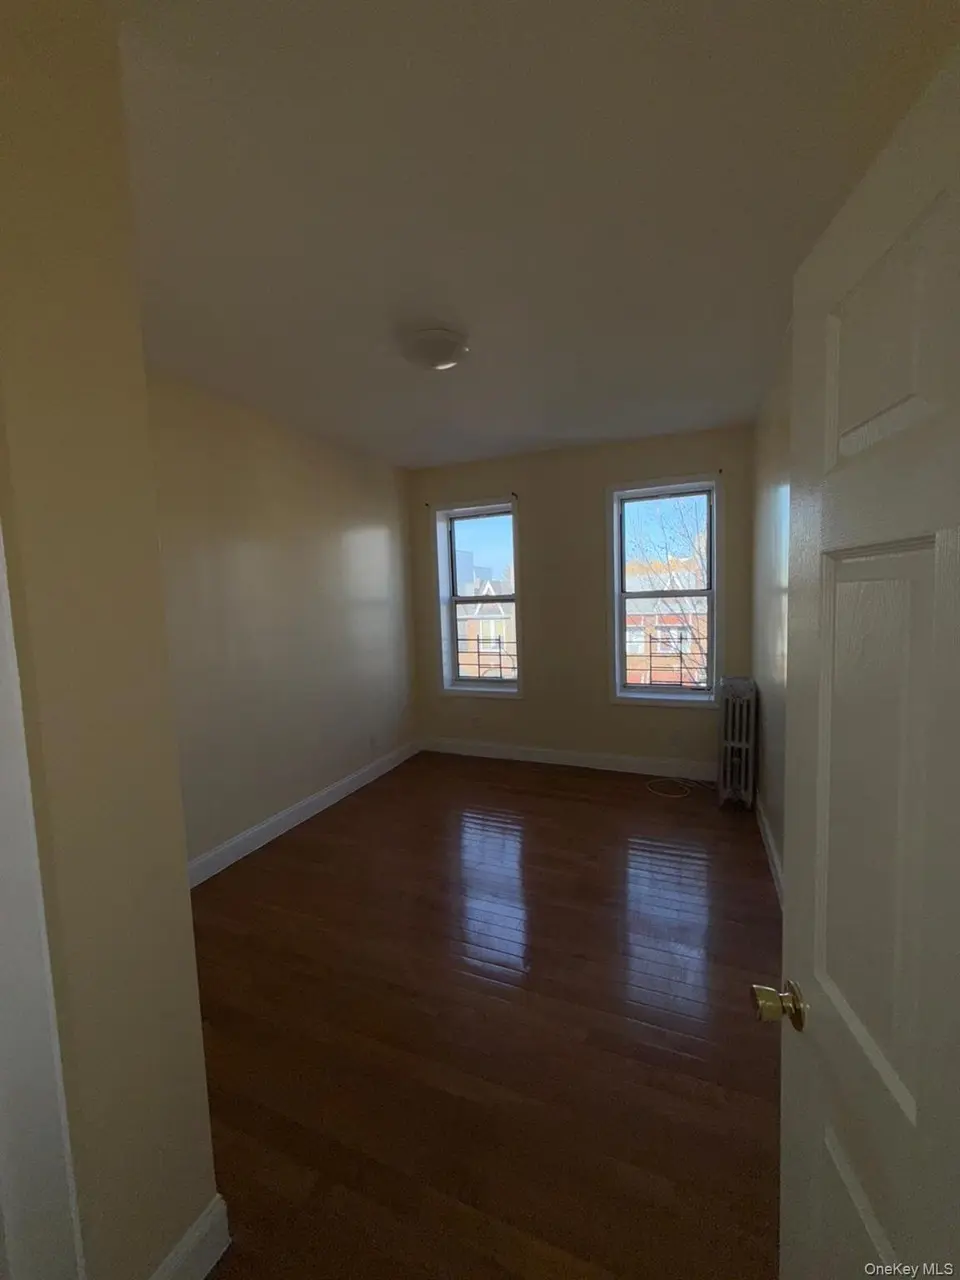
Listing remarks
Welcome to a spacious 1.5-bedroom private residence where comfort meets convenience. This thoughtfully laid-out home features bright living spaces, a versatile 1.5-bedroom configuration ideal for a home office or extra guest space, and well-appointed living areas designed for easy daily living. All utilities are included, making budgeting a breeze and removing the guesswork from monthly costs. Prime location with unmatched accessibility: just steps from key transit options—2 and 5 trains nearby—ensuring quick access to Manhattan and beyond. Proximity to major retailers and everyday conveniences, including Junction and Target, plus a variety of shopping options for errands and le
Key facts
- Bright living spaces
- Prime location
- 3,558 sq ft lot
Tags
Property features AI
Exterior
- Parking: On-street parking
- Utilities: Public sewer (shared); Cable available; Electricity available and connected
- Home design: Duplex
- Construction: Brick construction
- Exterior features: Brick exterior; Not waterfront; No additional parcels
Interior
- Kitchen: Eat-in kitchen
- Bedrooms: One 2-bedroom unit
- Bathrooms: One full bathroom
- Heating & cooling: Baseboard heat (oil); No central cooling
- Interior features: Eat-in kitchen; Basement present
Neighborhood map
What this means for you Summary
Snapshot
- This is a 2-bed/1.0-bath multifamily listed at $2k.
Deal economics
- At list price, monthly cash flow is $4k ($50k/yr) — positive.
- The deal already cash-flows at list — no discount required.
- Meets the 1% rule at list price ($5k rent vs $2k).
- Cap rate 2657.4% vs local median 2.6% in New York — top-decile yield for the area; either an underpriced asset or a hidden risk that comps aren't pricing in. Stress-test before assuming the spread holds.
Location & tenants
- Location reads 75/100 on livability (#268 in NY, #4,188 nationally) — a middle-class / working-renter tenant base. Strengths: amenities A+, commute A+, health & safety A; Watch: crime F, cost of living F.
- Market conditions: Rents rising (+2.1%/yr); 165 active listings in the ZIP; solid renter incomes; 10,063 units permitted in Kings County in 2024 (9,789 in 5+ unit buildings).
- At $5,330/mo this rent would consume 76% of the median local household income ($84k/yr) (locally 3513% of renters already pay >50% of income on rent) — very limited rent-growth headroom before tenants either downsize or default.
Forward outlook
- Local home prices are declining (-3.0%/yr); year-one equity from $13 of loan paydown is wiped out by about $57 of value loss. Plan a longer hold.
- Kings County population projected at +13% by 2050 — modest demand growth; plan on rents tracking national, not racing it.
- At projected returns (-3.0% appreciation + 2.1% rent growth), your $532 cash investment doubles in ~1 year — after that, you're playing with house money.
Negotiation context
- Only 8 days on market — expect competitive offers; lowballing is unlikely to land.
Risks & watch-outs
- Watch-outs: built in 1930 — expect roof / HVAC / electrical / plumbing capex.
- Climate carrying-cost: major wind risk, 62% chance of damaging wind over 30y; extreme-heat days projected 7→16/yr by 2055 (HVAC capex compounding) — expect insurance premiums to compound above CPI over the hold.
Questions for the listing agent
- Built in 1930 — when were the roof, HVAC, electrical panel, plumbing, and water heater last replaced?
- Is there a deadline driving the sale (1031 exchange, divorce, estate, relocation)? That informs how much negotiation room exists.
- Schools are B-rated — typically a magnet for longer-tenancy family renters. What's the average tenant stay here, and is there a school-zone premium baked into asking?
- Crime grade is F in this area — have there been break-ins, vandalism, or insurance claims at this property in the last 3 years? What carrier currently insures it and at what premium?
- The area grade is low — what's the realistic commute time and amenity access for the typical tenant pool here? Any planned neighborhood developments (good or bad) we should know about?
- What's the average days-on-market for RENTAL listings here right now (not sales)? A rising rental-DOM trend means longer vacancies and softer asking-rent achievability than the comps imply.
- What's the recent tenant-quality profile in this submarket — average credit score on applications, eviction rate, late-payment / NSF rate, and stable-employment percentage? A property-management company in the area should have these aggregated.
- How much new apartment / multifamily construction is in the pipeline within 1–3 miles? Heavy new supply (>2% of stock underway) typically softens rents 12–24 months out; light construction supports rent growth.
Investment metrics
- 1% rule
- 280.53% ✓
- Cap rate
- 2657.39%
- Cash-on-cash
- 9468.20%
- DSCR
- 422.28
- GRM
- 0.0
CMA / ARV
No comps found within radius.
Projected returns pro-forma
-3.0% appreciation · 2.11% rent growth · sell at horizon
- IRR
- —
- Equity multiple
- 494.21×
- Total profit
- $262,387
- Equity at exit
- $283
- IRR
- —
- Equity multiple
- 1042.33×
- Total profit
- $553,989
- Equity at exit
- $164
Cash invested: $532 (down + closing). Projections, not guarantees.
Landlord ↔ Tenant lean methodology
- Overall (CITY)
- 0 Strongly Tenant-Friendly
- State New York
- 15 Strongly Tenant-Friendly · D+10
- County
- — inherits STATE
- City New York
- 0 Strongly Tenant-Friendly · D+34
ZIP-level market 11210
- Rents YoY
- 2.1%
- Active inventory
- 165
- Price-to-rent
- 0.1×
Monthly cashflow live
- Estimated rent
- $5,330 medium interval (Pro) →
- Mortgage (P&I)
- −$10
- Tax est. 1.5%
- −$2 /mo · $28/yr
- Insurance
- −$1
- HOA
- −$0
- Vacancy / Maint / Mgmt
- −$1,119
- Net cashflow
- $4,198
Break-even live
2-unit breakdown (identical units grouped — click to expand)
| Units | Beds | Baths | Est. rent |
|---|---|---|---|
| 2× units | 1.5 | 1 | $5,330 |
| #1 | 1.5 | 1 | $2,665 |
| #2 | 1.5 | 1 | $2,665 |
| Total (2 units) | $5,330 | ||
UW: 25.0% down · 7.5% · 30yr · 1.5% tax · 5.0% vac · 8.0% maint · 8.0% mgmt
Financing live
Cash to close
- Down payment
- $475
- Closing costs
- $57
- Reserves months
- —
- Total cash needed
- —
Loan-product check · same deal, 3 products live
Conventional
25% down · 7.5% · 30yr
- Down + closing
- —
- Monthly P&I
- —
- Monthly cashflow
- —
- DSCR
- —
- Eligible?
- —
Personal DTI + credit; lowest rate.
DSCR
20% down · 8.5% · 30yr
- Down + closing
- —
- Monthly P&I
- —
- Monthly cashflow
- —
- DSCR
- —
- Eligible?
- —
No personal income docs; deal must DSCR.
Hard money
10% down · 12.0% · 12mo
- Down + closing
- —
- Monthly P&I
- —
- Monthly cashflow
- —
- DSCR
- —
- Eligible?
- —
Short-term bridge; refi at stabilization.
Listing history 6 events
-
2026-05-18$1,900 Active
-
2026-02-10soldstatus $710,000
-
2002-01-28soldstatus $310,000
-
2001-11-05soldstatus $210,000
-
2000-04-18soldstatus $70,000
-
1987-06-02soldstatus $20,000
ⓘ Source: listings_history table (triggers on properties + properties_extension) + one-shot
backfill from property_details.listing_events for pre-trigger history.
Climate risk First Street
- Flood 1/10 Low FEMA zone X (unshaded) · 0% chance over 30 yrs
- Wildfire 1/10 Low
- Heat 7/10 Severe 7 d/yr ≥97°F today · 16 d/yr by 30 yrs out
- Wind 6/10 Major 62% chance of damaging wind over 30 yrs
- Air quality 5/10 Major 6 unhealthy d/yr today · 8 by 30 yrs out
Nearby sold comps map
Loading sold comps map…
Walkable amenities ~0.75 mi
Loading nearby amenities…
Taxation est. · year 1
- Rental income
- $63,960
- − Mortgage interest
- −$106
- − Property taxes
- −$28
- − Insurance
- −$10
- − Repairs & maintenance
- −$5,117
- − Management
- −$5,117
- − Depreciation
- −$55
- Taxable income
- $53,527
- Est. tax owed @ 24.0%
- −$12,846
- After-tax cash flow
- $37,524/yr
For passive investors: Depreciation is non-cash, so a rental often shows a tax loss while cash-flowing — sheltering income. Rental losses are passive: they offset passive income freely, and up to $25,000/yr can offset ordinary (W-2) income if you actively participate and your MAGI is under $100k (phasing out to $0 by $150k); unused losses carry forward. On sale, claimed depreciation is recaptured at up to 25%, and gains may owe capital-gains tax (a 1031 exchange can defer both). Figures are a year-1 estimate at your 24.0% rate — not tax advice; consult a CPA.
Schools (NCES district)
No district data.
Livability — New York
- Score
- 75/100
- State rank
- #268
- US rank
- #4188
Category grades
Schools grade is shown separately in the Schools card above.
Census & demographics
- Census place
- New York, NY
- County
- Kings County · 2,614,986 people
- City population
- 7,731,280
- Metro
- New York-Newark-Jersey City, NY-NJ-PA
- Population (ZIP)
- 57,915
- Household income
- $83,692
- Rent vs Own
- Severe rent burden
- 3513.0
Population outlook (Kings County) Hauer SSP2
- Today (2025)
- 2,847,441 people
- By 2030
- 2,937,006 · +3.1%
- By 2040
- 3,095,491 · +8.7%
- By 2050
- 3,228,968 · +13.4%
- By 2075
- 3,321,723 · +16.7%
- By 2100
- 3,111,387 · +9.3%
Race, ethnicity, and origin ACS 2023
- Neighborhood character
- Diverse neighborhood (Simpson 0.65)
- Race & ethnicity
- Black 50% White 30% Two or more races 8% Hispanic / Latino 7% Asian 5%
- Hispanic origin (detail)
- Puerto Rican 2% Dominican 1%
- Common ancestry
- Hispanic 12% Romanian 2% Scotch-Irish 2%
- Foreign-born
- 39% · Canada, China, Mexico
- Languages at home
- 67% English-only · French/Haitian/Cajun 13% Spanish 5% Other Indo-European 3%
Political lean MEDSL · Kings
- 2024 margin
- Solid D (+44.0) · D 72.0% · R 28.0%
- 2008→2024 swing
- -15.5pp toward R · 2008: 59.4pp · 2024: 44.0pp
- All cycles
- 2024: D+44.0 2020: D+54.8 2016: D+61.8 2012: D+63.9 2008: D+59.4
Not yet ingested
- Civics
- —
Market trends
- HPI YoY
- ▼ -831.01%
- Current HPI
- 389.9293
- Rent YoY
- ▲ 2.11%
- Metro
- New York-Newark-Jersey City, NY-NJ-PA
- State GDP YoY
- ▲ 2.60%
- F500 in state
- 92
Industry mix (Fortune 500 HQ in NY)
| Industry | F500 HQs | Revenue |
|---|---|---|
| Financial Services | 10 | $950B |
|
||
| Consumer Goods | 9 | $162B |
|
||
| Insurance | 4 | $225B |
|
||
| Telecommunications | 2 | $144B |
|
||
| Pharmaceuticals | 2 | $112B |
|
||
| Media / Entertainment | 2 | $69B |
|
||
Price history
-90.5% since first listed6 events — show timeline
- 2026-05-18 Listed $1,900 OneKey® MLS as Distributed by MLS Grid
- 2026-02-10 Sold (Public Records) $710,000 Public Records
- 2002-01-28 Sold (Public Records) $310,000 Public Records
- 2001-11-05 Sold (Public Records) $210,000 Public Records
- 2000-04-18 Sold (Public Records) $70,000 Public Records
- 1987-06-02 Sold (Public Records) $20,000 Public Records
Property tax history
+5.2%/yrLatest (2025): $8,924 · +3.5% YoY. Source: county tax records.
Cash-flow waterfall
monthlySold comps — $/sqft
last 12 mo · ≤1 miLoading sold comps…