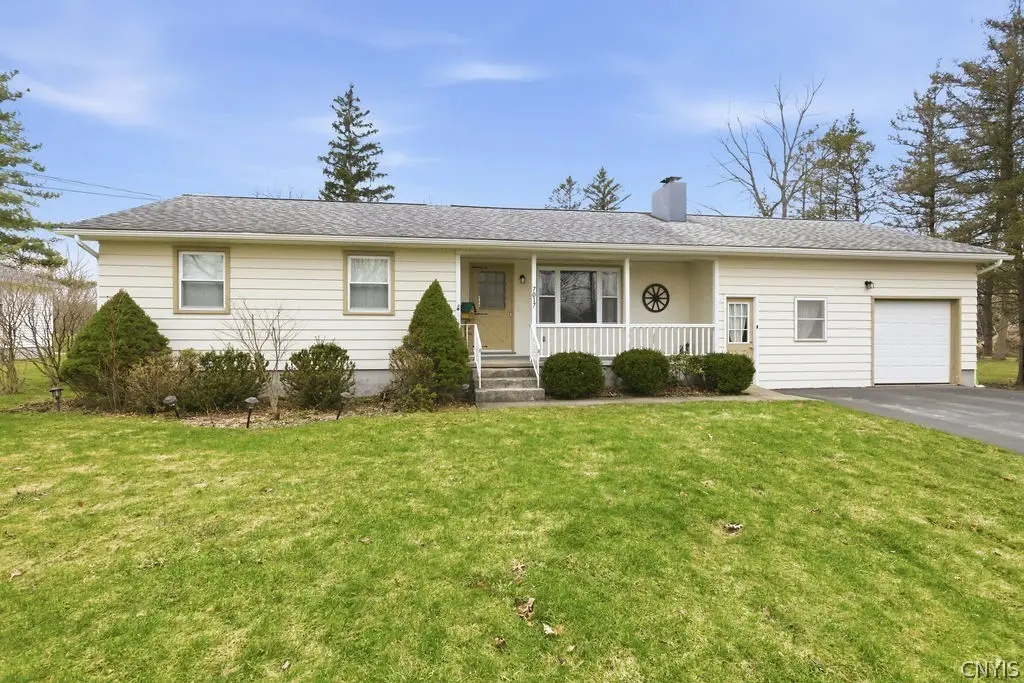
7017 Bolivar Rd · Chittenango, NY
Flood risk 1/10 · Minimal
- FEMA flood zone
- X
- Chance of flooding over 30 yrs
- 0.0%
- Est. flood insurance / yr
- $473 – $860
Fire risk 2/10 · Minimal
- Est. fire insurance / yr
- $691 – $1,283
Heat risk 3/10 · Minor
- Hot days now (above 94°F)
- 7 days/yr
- Hot days in 30 yrs
- 16 days/yr
Wind risk 1/10 · Minimal
- Chance of severe wind over 30 yrs
- —
Air-quality risk 2/10 · Minimal
- Unhealthy air days now
- 1 days/yr
- Unhealthy air days in 30 yrs
- 1 days/yr
Risk factors via First Street. Map © Google.
Why this score? — see what drove the B- grade
The composite is a weighted blend of 9 inputs, each scored 0–100. Each bar is that input's sub-score; the figure is the points it added to the 100-point composite (weight × sub-score).
- Cash flow +24.0/30.0
- ARV discount +15.0/15.0
- DSCR +7.7/10.0
- 1% rule +7.1/10.0
- Schools +5.4/10.0
- Livability +3.7/5.0
- Rent growth +2.5/5.0
- Condition / age +2.5/5.0
- Appreciation +0.0/10.0
$199,900
🖨 Deal sheet (PDF) 📄 Offer letter ✓ Due diligence
Listing remarks MLS
Beautiful ranch, one-floor living, in a nice quiet area. Hardwood floors throughout. Newly added back deck, plenty of space downstairs for a recreation room, and several hiking/cross-country skiing trails out back.
Key facts
- Double sinks
- Quartz countertops
- New tub
Tags
Neighborhood map
What this means for you Summary
Snapshot
- This is a 2-bed/2.0-bath single-family listed at $200k.
Deal economics
- At list price, monthly cash flow is $391 ($5k/yr) — positive.
- The deal already cash-flows at list — no discount required.
- Meets the 1% rule at list price ($2k rent vs $200k).
- Cap rate 8.6% vs local median 4.0% in Chittenango — top-decile yield for the area; either an underpriced asset or a hidden risk that comps aren't pricing in. Stress-test before assuming the spread holds.
Location & tenants
- Location reads 74/100 on livability (#296 in NY, #4,790 nationally) — a middle-class / working-renter tenant base. Strengths: housing A+, employment A, cost of living A; Watch: amenities F, commute F.
- Chittenango Central School District (rural): math 61% / reading 64% proficiency, ranked #192 of 590 in NY (top 32%) — acceptable for families but not a draw, mixed tenant base, ~2y average lease.
- Zoned schools: Bolivar Road Elementary School (math 72% / reading 72%, grade A-, #378 of 2,108 statewide, top 20%, 490 students, 37% FRL); Chittenango Middle School (math 47% / reading 61%, grade B-, #225 of 729 statewide, top 31%, 562 students, 42% FRL); Chittenango High School (math 87% / reading 84%, grade A, #358 of 1,100 statewide, top 33%, 623 students, 38% FRL).
- Market conditions: 74 active listings in the ZIP; 137 units permitted in Madison County in 2024 (46 in 5+ unit buildings).
Forward outlook
- Local home prices are declining (-3.0%/yr); year-one equity from $1k of loan paydown is wiped out by about $6k of value loss. Plan a longer hold.
- Madison County population projected at -24% by 2050 — secular population decline; favor cash flow + early exit over multi-decade hold.
Negotiation context
- Only 6 days on market — expect competitive offers; lowballing is unlikely to land.
- 3 sale attempts since 14y ago with the ask held roughly flat each time — persistent listings suggest the price (not the market) is what's stuck; bring a comps-based counter.
- Current owner paid $131k; list at $200k implies a 52% gain — meaningful room to come down on a strong offer.
Questions for the listing agent
- Built in 1963 — when were the roof, HVAC, electrical panel, plumbing, and water heater last replaced?
- Is there a deadline driving the sale (1031 exchange, divorce, estate, relocation)? That informs how much negotiation room exists.
- Schools are A-rated — typically a magnet for longer-tenancy family renters. What's the average tenant stay here, and is there a school-zone premium baked into asking?
- What's the average days-on-market for RENTAL listings here right now (not sales)? A rising rental-DOM trend means longer vacancies and softer asking-rent achievability than the comps imply.
- What's the recent tenant-quality profile in this submarket — average credit score on applications, eviction rate, late-payment / NSF rate, and stable-employment percentage? A property-management company in the area should have these aggregated.
- How much new for-sale + rental construction is in the pipeline within 1–3 miles? Heavy new supply typically softens prices + rents 12–24 months out; constrained supply supports both.
Investment metrics
- 1% rule
- 1.21% ✓
- Cap rate
- 8.64%
- Cash-on-cash
- 8.39%
- DSCR
- 1.37
- GRM
- 6.9
CMA / ARV
- ARV (on-the-fly)
- $272,208
- Comps found
- 3
Show comp detail 3 sales within ~0.75 mi
| Address | Dist | Beds/Ba | Sqft | Sold | Price | $/sf | Match |
|---|---|---|---|---|---|---|---|
| 7017 Bolivar Rd | 0.00mi | 2/2.0 | 1,272 (0%) | 0mo | $272,017 | $214 | 100 |
| 7053 Lakeport Rd | 0.66mi | 2/1.0 | 1,324 (+4%) | 4mo | $175,500 | $133 | 56 |
| 1525 Kinderhook Rd | 0.52mi | 2/1.5 | 1,128 (-11%) | 9mo | $290,000 | $257 | 47 |
Match score weights: distance 35% · size 25% · config 20% · recency 20%. Top-matched comps best support the ARV.
Projected returns pro-forma
-3.0% appreciation · 3.0% rent growth · sell at horizon
- IRR
- -3.5%
- Equity multiple
- 0.87×
- Total profit
- $-7,356
- Equity at exit
- $29,806
- IRR
- 6.3%
- Equity multiple
- 1.47×
- Total profit
- $26,170
- Equity at exit
- $17,284
Cash invested: $55,972 (down + closing). Projections, not guarantees.
Landlord ↔ Tenant lean methodology
- Overall (STATE)
- 15 Strongly Tenant-Friendly
- State New York
- 15 Strongly Tenant-Friendly · D+10
- County
- — inherits STATE
- City
- — inherits STATE
ZIP-level market 13037
- Home prices YoY
- -17.1%
- Active inventory
- 74
- Price-to-rent
- 6.9×
Monthly cashflow live
- Estimated rent
- $2,419 medium interval (Pro) →
- Mortgage (P&I)
- −$1,048
- Tax from tax record
- −$388 /mo · $4,657/yr
- Insurance
- −$83
- HOA
- −$0
- Vacancy / Maint / Mgmt
- −$508
- Net cashflow
- $391
Break-even live
Sensitivity live
| Price | -10% $504 | -5% $448 | +0% $391 | +5% $335 | +10% $278 |
|---|---|---|---|---|---|
| Rent | -10% $200 | -5% $296 | +0% $391 | +5% $487 | +10% $582 |
| Rate | -1.0pp $492 | -0.5pp $442 | base $391 | +0.5pp $339 | +1.0pp $287 |
UW: 25.0% down · 7.5% · 30yr · 1.5% tax · 5.0% vac · 8.0% maint · 8.0% mgmt
Financing live
Cash to close
- Down payment
- $49,975
- Closing costs
- $5,997
- Reserves months
- —
- Total cash needed
- —
Loan-product check · same deal, 3 products live
Conventional
25% down · 7.5% · 30yr
- Down + closing
- —
- Monthly P&I
- —
- Monthly cashflow
- —
- DSCR
- —
- Eligible?
- —
Personal DTI + credit; lowest rate.
DSCR
20% down · 8.5% · 30yr
- Down + closing
- —
- Monthly P&I
- —
- Monthly cashflow
- —
- DSCR
- —
- Eligible?
- —
No personal income docs; deal must DSCR.
Hard money
10% down · 12.0% · 12mo
- Down + closing
- —
- Monthly P&I
- —
- Monthly cashflow
- —
- DSCR
- —
- Eligible?
- —
Short-term bridge; refi at stabilization.
Listing history 11 events
-
2026-04-04status Pending
-
2026-03-29$199,900 Active
-
2017-01-20soldstatus $131,325 Closed Sale or Rented 214-char remark
Show marketing remark (214 chars)
Beautiful ranch, one-floor living, in a nice quiet area. Hardwood floors throughout. Newly added back deck, plenty of space downstairs for a recreation room, and several hiking/cross-country skiing trails out back.
-
2017-01-10soldstatus $131,325
-
2016-12-05status Pending Sale 214-char remark
Show marketing remark (214 chars)
Beautiful ranch, one-floor living, in a nice quiet area. Hardwood floors throughout. Newly added back deck, plenty of space downstairs for a recreation room, and several hiking/cross-country skiing trails out back.
-
2016-11-07historical Under Contract- Do Not Show 214-char remark
Show marketing remark (214 chars)
Beautiful ranch, one-floor living, in a nice quiet area. Hardwood floors throughout. Newly added back deck, plenty of space downstairs for a recreation room, and several hiking/cross-country skiing trails out back.
-
2016-10-26$132,900 Active 214-char remark
Show marketing remark (214 chars)
Beautiful ranch, one-floor living, in a nice quiet area. Hardwood floors throughout. Newly added back deck, plenty of space downstairs for a recreation room, and several hiking/cross-country skiing trails out back.
-
2012-07-06soldstatus $115,000
-
2012-06-25soldstatus $115,000 173-char remark
Show marketing remark (173 chars)
Terrific ranch just outside of village. Could be turned back into 3 bedrooms, newer kitchen, hardwoods, fireplace, central air, newer roof, full basement partially finished.
-
2012-04-13$118,500 173-char remark
Show marketing remark (173 chars)
Terrific ranch just outside of village. Could be turned back into 3 bedrooms, newer kitchen, hardwoods, fireplace, central air, newer roof, full basement partially finished.
-
2000-11-09soldstatus $75,000
ⓘ Source: listings_history table (triggers on properties + properties_extension) + one-shot
backfill from property_details.listing_events for pre-trigger history.
Tax reassessment forecast NY · Partial reset (capped growth)
- Current annual tax
- $4,657 · $388/mo
- Projected year-2 tax
- $4,657 · $388/mo
- Expected delta
- $0/yr ($0/mo · 0.0%)
ⓘ Screening estimate from a state-policy table — verify with the county assessor before closing.
Climate risk First Street
- Flood 1/10 Low FEMA zone X · 0% chance over 30 yrs
- Wildfire 2/10 Low
- Heat 3/10 Moderate 7 d/yr ≥94°F today · 16 d/yr by 30 yrs out
- Wind 1/10 Low
- Air quality 2/10 Low 1 unhealthy d/yr today · 1 by 30 yrs out
Nearby sold comps map
Loading sold comps map…
Walkable amenities ~0.75 mi
Loading nearby amenities…
Taxation est. · year 1
- Rental income
- $29,025
- − Mortgage interest
- −$11,198
- − Property taxes
- −$4,657
- − Insurance
- −$1,000
- − Repairs & maintenance
- −$2,322
- − Management
- −$2,322
- − Depreciation
- −$5,815
- Taxable income
- $1,712
- Est. tax owed @ 24.0%
- −$411
- After-tax cash flow
- $4,283/yr
For passive investors: Depreciation is non-cash, so a rental often shows a tax loss while cash-flowing — sheltering income. Rental losses are passive: they offset passive income freely, and up to $25,000/yr can offset ordinary (W-2) income if you actively participate and your MAGI is under $100k (phasing out to $0 by $150k); unused losses carry forward. On sale, claimed depreciation is recaptured at up to 25%, and gains may owe capital-gains tax (a 1031 exchange can defer both). Figures are a year-1 estimate at your 24.0% rate — not tax advice; consult a CPA.
Schools (NCES district)
- District
- Chittenango Central School District
- NCES district ID
- 3607470
- Math proficiency
- 61% ▼ -4.00%
- Reading proficiency
- 64% ▲ 9.00%
- Median HH income
- $62,521
- Composite
- 54.34/100
- National rank
- #1365
- State rank
- #192 of 590 in NY
Livability — Chittenango
- Score
- 74/100
- State rank
- #296
- US rank
- #4790
Category grades
Schools grade is shown separately in the Schools card above.
Census & demographics
- Population (ZIP)
- 9,519
Population outlook (Madison County) Hauer SSP2
- Today (2025)
- 69,528 people
- By 2030
- 66,599 · -4.2%
- By 2040
- 59,814 · -14.0%
- By 2050
- 52,842 · -24.0%
- By 2075
- 39,167 · -43.7%
- By 2100
- 28,442 · -59.1%
Race, ethnicity, and origin ACS 2023
- Neighborhood character
- Predominantly White (92%)
- Race & ethnicity
- White 92% Two or more races 5% Hispanic / Latino 4%
- Common ancestry
- Romanian 9% Iranian 3% Lithuanian 3%
- Foreign-born
- 3% · Canada, Jamaica
- Languages at home
- 96% English-only · Spanish 2% French/Haitian/Cajun 1%
Political lean MEDSL · Madison
- 2024 margin
- R (+13.1) · D 43.5% · R 56.5%
- 2008→2024 swing
- -13.9pp toward R · 2008: 0.9pp · 2024: -13.1pp
- All cycles
- 2024: R+13.1 2020: R+10.6 2016: R+15.9 2012: D+0.3 2008: D+0.9
Not yet ingested
- Civics
- —
Market trends
- HPI YoY
- ▼ -56.53%
- Current HPI
- 272.9953
- Rent YoY
- —
- Metro
- —
- State GDP YoY
- ▲ 2.60%
- F500 in state
- 92
Industry mix (Fortune 500 HQ in NY)
| Industry | F500 HQs | Revenue |
|---|---|---|
| Financial Services | 10 | $950B |
|
||
| Consumer Goods | 9 | $162B |
|
||
| Insurance | 4 | $225B |
|
||
| Telecommunications | 2 | $144B |
|
||
| Pharmaceuticals | 2 | $112B |
|
||
| Media / Entertainment | 2 | $69B |
|
||
Price history
+166.5% since first listed11 events — show timeline
- 2026-04-04 Pending — CNYIS
- 2026-03-29 Listed $199,900 CNYIS
- 2017-01-20 Sold (MLS) $131,325 CNYIS
- 2017-01-10 Sold (Public Records) $131,325 Public Records
- 2016-12-05 Pending — CNYIS
- 2016-11-07 Contingent — CNYIS
- 2016-10-26 Listed $132,900 CNYIS
- 2012-07-06 Sold (Public Records) $115,000 Public Records
- 2012-06-25 Sold (MLS) $115,000 CNYIS
- 2012-04-13 Listed $118,500 CNYIS
- 2000-11-09 Sold (Public Records) $75,000 Public Records
Property tax history
+3.0%/yrLatest (2025): $4,657 · +2.2% YoY. Source: county tax records.
Cash-flow waterfall
monthlySold comps — $/sqft
last 12 mo · ≤1 miLoading sold comps…