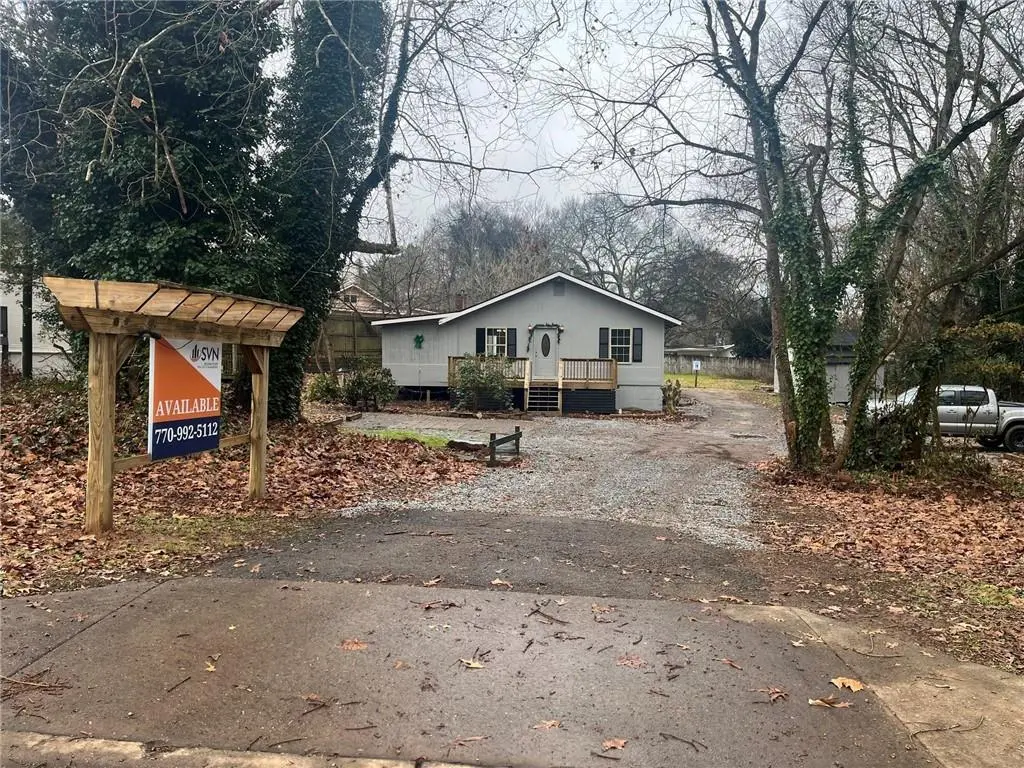
2230 Palm Rd · Woodstock, GA
Flood risk 1/10 · Minimal
- FEMA flood zone
- X (unshaded)
- Chance of flooding over 30 yrs
- 0.0%
- Est. flood insurance / yr
- $507 – $1,088
Fire risk 4/10 · Minor
- Est. fire insurance / yr
- $963 – $1,789
Heat risk 5/10 · Moderate
- Hot days now (above 103°F)
- 7 days/yr
- Hot days in 30 yrs
- 18 days/yr
Wind risk 4/10 · Minor
- Chance of severe wind over 30 yrs
- 14.0%
Air-quality risk 4/10 · Minor
- Unhealthy air days now
- 5 days/yr
- Unhealthy air days in 30 yrs
- 7 days/yr
Risk factors via First Street. Map © Google.
Why this score? — see what drove the D+ grade
The composite is a weighted blend of 9 inputs, each scored 0–100. Each bar is that input's sub-score; the figure is the points it added to the 100-point composite (weight × sub-score).
- ARV discount +13.2/15.0
- Cash flow +11.9/30.0
- Schools +4.2/10.0
- Condition / age +3.8/5.0
- Livability +3.7/5.0
- DSCR +3.5/10.0
- 1% rule +3.4/10.0
- Rent growth +2.4/5.0
- Appreciation +0.0/10.0
$295,000
🖨 Deal sheet (PDF) 📄 Offer letter ✓ Due diligence
Key facts
- 0.36 acre lot
- Built 1940
- Listed 41 days
Property features AI
Exterior
- Parking: Driveway parking; Open parking available
- Utilities: Public water; Septic tank sewer; Electricity available; Natural gas available; Phone service available; Electric: Other
- Home design: One-level home; Enhanced accessible
- Construction: Cement siding; Asbestos shingle roof; Block foundation; Resale condition
- Exterior features: Located off Main Street; City street frontage; Workshop on the property
Interior
- Kitchen: Cabinets (other)
- Bedrooms: Three main-level bedrooms; Bedroom features: Other
- Flooring: Laminate flooring
- Bathrooms: Two full bathrooms (both on the main level); Master bath: None
- Heating & cooling: Heating: Other; Cooling: Other
- Interior features: Other interior features; No shared/common walls
- Laundry & utility: Appliances: Other
Neighborhood map
What this means for you Summary
Snapshot
- This is a 3-bed/2.0-bath single-family listed at $295k. Condition is rated good.
Deal economics
- At list price, monthly cash flow is $-77 ($-928/yr) — negative.
- To cash-flow at today's rent, offer at most $284k (3.8% below list).
- To meet the 1% rule (rent ≥ 1% of price), the offer needs to be $248k (15.8% below list).
- Recommended offer: $248k (15.8% below list) — sets the bar for 1% rule.
- Cap rate 6.0% vs local median 3.3% in Woodstock — top-decile yield for the area; either an underpriced asset or a hidden risk that comps aren't pricing in. Stress-test before assuming the spread holds.
Location & tenants
- Location reads 73/100 on livability (#46 in GA) — a middle-class / working-renter tenant base. Strengths: crime A+, employment A+, housing A+; Watch: amenities F, commute F, health & safety F.
- Cherokee County (suburban): math 46% / reading 48% proficiency, ranked #17 of 174 in GA (top 10%) — families likely to look elsewhere, expect single-tenant / working-renter base with shorter leases.
- Zoned schools: Holly Springs Elementary School (math 53% / reading 36%, grade F, #336 of 1,228 statewide, top 29%, 744 students, 36% FRL); Dean Rusk Middle School (math 47% / reading 56%, grade C, #63 of 470 statewide, top 13%, 1,473 students, 23% FRL); Sequoyah High School (math 26% / reading 40%, grade F, #101 of 424 statewide, top 24%, 2,083 students, 19% FRL) — zoned schools at 26% FRL track the district average.
- Market conditions: Rents soft (-0.2%/yr); 633 active listings in the ZIP; 9 comparable units currently listed for rent nearby; rentals leasing fast (median 7d on market — plan ~1-2 weeks tenant-placement turnaround); high-income renter base; 2,665 units permitted in Cherokee County in 2024 (852 in 5+ unit buildings).
Forward outlook
- Local home prices are declining (-3.0%/yr); year-one equity from $2k of loan paydown is wiped out by about $9k of value loss. Plan a longer hold.
- Cherokee County population projected at +34% by 2050 — long-run rental-demand tailwind backs the buy-and-hold thesis.
Negotiation context
- It's been on market 41 days — a 3% lower offer ($286k) is reasonable based on typical stale-listing flexibility.
- 2 sale attempts; this cycle's ask has dropped $30k (9%) from the opening price — seller is motivated, your offer sets the floor, not the list.
Risks & watch-outs
- Watch-outs: built in 1940 — expect roof / HVAC / electrical / plumbing capex.
- Climate carrying-cost: extreme-heat days projected 7→18/yr by 2055 (HVAC capex compounding) — expect insurance premiums to compound above CPI over the hold.
Questions for the listing agent
- What do current leases actually rent for vs. the listed asking? Can we see a recent rent roll and the last 12 months of T-12 income?
- It's been on market 41 days. Have you received any prior offers? Is the seller open to a 16% concession, seller financing, or rate buy-down credit?
- Built in 1940 — when were the roof, HVAC, electrical panel, plumbing, and water heater last replaced?
- Is there a deadline driving the sale (1031 exchange, divorce, estate, relocation)? That informs how much negotiation room exists.
- Schools are B-rated — typically a magnet for longer-tenancy family renters. What's the average tenant stay here, and is there a school-zone premium baked into asking?
- The area grade is low — what's the realistic commute time and amenity access for the typical tenant pool here? Any planned neighborhood developments (good or bad) we should know about?
- What's the average days-on-market for RENTAL listings here right now (not sales)? A rising rental-DOM trend means longer vacancies and softer asking-rent achievability than the comps imply.
- What's the recent tenant-quality profile in this submarket — average credit score on applications, eviction rate, late-payment / NSF rate, and stable-employment percentage? A property-management company in the area should have these aggregated.
- How much new for-sale + rental construction is in the pipeline within 1–3 miles? Heavy new supply typically softens prices + rents 12–24 months out; constrained supply supports both.
Investment metrics
- 1% rule
- 0.84% ✗
- Cap rate
- 5.98%
- Cash-on-cash
- -1.12%
- DSCR
- 0.95
- GRM
- 9.9
CMA / ARV
- ARV (median comp)
- $338,105
- List price
- $295,000
- Delta
- -12.75%
- Verdict
- UNDERPRICED
- Comps
- 20 within 1.0 mi
Show comp detail 12 sales within ~0.75 mi
| Address | Dist | Beds/Ba | Sqft | Sold | Price | $/sf | Match |
|---|---|---|---|---|---|---|---|
| 212 Hiawassee Dr | 0.54mi | 2/2.0 (-1) | 1,130 (-3%) | 4mo | $322,000 | $285 | 62 |
| 309 Ridge Hill Cir | 0.43mi | 3/2.0 | 1,246 (+7%) | 9mo | $315,000 | $253 | 60 |
| 905 Lebanon Pl | 0.60mi | 3/2.0 | 1,248 (+7%) | 1mo | $375,000 | $300 | 59 |
| 129 Swanee Ln | 0.56mi | 3/2.0 | 1,118 (-4%) | 14mo | $349,000 | $312 | 56 |
| 233 Hiawassee Dr | 0.52mi | 2/2.0 (-1) | 1,118 (-4%) | 14mo | $345,000 | $309 | 53 |
| 326 Hiawassee Dr | 0.74mi | 2/2.0 (-1) | 1,118 (-4%) | 2mo | $312,000 | $279 | 53 |
| 116 Swanee Ln | 0.54mi | 2/2.0 (-1) | 1,012 (-13%) | 2mo | $265,000 | $262 | 47 |
| 142 Swanee Ln | 0.62mi | 3/2.5 | 1,274 (+10%) | 8mo | $329,900 | $259 | 46 |
| 185 Swanee Ln | 0.66mi | 2/2.5 (-1) | 1,232 (+6%) | 8mo | $332,000 | $269 | 45 |
| 494 Toonigh Rd | 0.50mi | 4/2.0 (+1) | 1,332 (+15%) | 5mo | $405,000 | $304 | 43 |
| 278 Hiawassee Dr | 0.72mi | 2/2.0 (-1) | 1,027 (-12%) | 4mo | $325,000 | $316 | 39 |
| 309 Hiawassee Dr | 0.71mi | 2/2.5 (-1) | 1,320 (+14%) | 3mo | $313,000 | $237 | 35 |
Match score weights: distance 35% · size 25% · config 20% · recency 20%. Top-matched comps best support the ARV.
Projected returns pro-forma
-3.0% appreciation · 0.0% rent growth · sell at horizon
- IRR
- -21.6%
- Equity multiple
- 0.27×
- Total profit
- $-59,968
- Equity at exit
- $43,985
- IRR
- -24.6%
- Equity multiple
- -0.05×
- Total profit
- $-86,529
- Equity at exit
- $25,506
Cash invested: $82,600 (down + closing). Projections, not guarantees.
Landlord ↔ Tenant lean methodology
- Overall (STATE)
- 90 Strongly Landlord-Friendly
- State Georgia
- 90 Strongly Landlord-Friendly · R+3
- County
- — inherits STATE
- City
- — inherits STATE
ZIP-level market 30115
- Home prices YoY
- -29.3%
- Rents YoY
- -0.2%
- Active inventory
- 633
- Price-to-rent
- 9.9×
Monthly cashflow live
- Estimated rent
- $2,483 high interval (Pro) →
- Mortgage (P&I)
- −$1,547
- Tax est. 1.5%
- −$369 /mo · $4,425/yr
- Insurance
- −$123
- HOA
- −$0
- Vacancy / Maint / Mgmt
- −$521
- Net cashflow
- $-77
Break-even live
Sensitivity live
| Price | -10% $127 | -5% $25 | +0% $-77 | +5% $-179 | +10% $-281 |
|---|---|---|---|---|---|
| Rent | -10% $-273 | -5% $-175 | +0% $-77 | +5% $21 | +10% $119 |
| Rate | -1.0pp $71 | -0.5pp $-2 | base $-77 | +0.5pp $-154 | +1.0pp $-232 |
UW: 25.0% down · 7.5% · 30yr · 1.5% tax · 5.0% vac · 8.0% maint · 8.0% mgmt
Financing live
Cash to close
- Down payment
- $73,750
- Closing costs
- $8,850
- Reserves months
- —
- Total cash needed
- —
Loan-product check · same deal, 3 products live
Conventional
25% down · 7.5% · 30yr
- Down + closing
- —
- Monthly P&I
- —
- Monthly cashflow
- —
- DSCR
- —
- Eligible?
- —
Personal DTI + credit; lowest rate.
DSCR
20% down · 8.5% · 30yr
- Down + closing
- —
- Monthly P&I
- —
- Monthly cashflow
- —
- DSCR
- —
- Eligible?
- —
No personal income docs; deal must DSCR.
Hard money
10% down · 12.0% · 12mo
- Down + closing
- —
- Monthly P&I
- —
- Monthly cashflow
- —
- DSCR
- —
- Eligible?
- —
Short-term bridge; refi at stabilization.
Rent comps 9 comps
| Address | Beds | Baths | Sqft | Rent | $/sqft | DOM | Units | Dist |
|---|---|---|---|---|---|---|---|---|
| 1151 Heights Pkwy Canton, GA | 1.0–3.0 | 1.0–2.0 | 1184 | $3,205 | $2.71 | 0d | 24 | 0.23mi |
| 4501 Holly Springs Pkwy Holly Springs, GA | 1.0–3.0 | 1.0–2.0 | 1109 | $2,869 | $2.59 | 3d | 24 | 0.48mi |
| 305 Fox Overlook Unit 1 Woodstock, GA | 2.0 | 2.0 | 1304 | $1,900 | $1.46 | 6d | 1 | 0.50mi |
| 305 Fox Overlook Woodstock, GA | 2.0 | 2.0 | 1304 | $1,900 | $1.46 | 26d | 1 | 0.50mi |
| 137 Swanee Ln Woodstock, GA | 3.0 | 2.5 | 1274 | $1,795 | $1.41 | 26d | 1 | 0.57mi |
| 4416 Holly Springs Pkwy Canton, GA | 1.0–3.0 | 1.0–2.0 | 1008 | $2,400 | $2.38 | 0d | 19 | 0.62mi |
| 100 Holly Park Ct Holly Springs, GA | 1.0–3.0 | 1.0–2.0 | 1081 | $2,383 | $2.20 | 4d | 9 | 0.69mi |
| 143 Aspen Ct Woodstock, GA | 3.0 | 2.0 | 1428 | $2,029 | $1.42 | 24d | 1 | 1.36mi |
| 806 Palm St #03 Holly Springs, GA | 2.0 | 1.0 | 1177 | $1,450 | $1.23 | 19d | 1 | 1.48mi |
Listing history 6 events
-
2026-05-31days on market $295,000 Active 41 DOM
-
2026-05-18historical $1,700
-
2026-04-28price $1,700
-
2026-04-27price $295,000
-
2026-04-20$325,000 Active
-
2026-04-15$2,000
ⓘ Source: listings_history table (triggers on properties + properties_extension) + one-shot
backfill from property_details.listing_events for pre-trigger history.
Climate risk First Street
- Flood 1/10 Low FEMA zone X (unshaded) · 0% chance over 30 yrs
- Wildfire 4/10 Moderate
- Heat 5/10 Major 7 d/yr ≥103°F today · 18 d/yr by 30 yrs out
- Wind 4/10 Moderate 14% chance of damaging wind over 30 yrs
- Air quality 4/10 Moderate 5 unhealthy d/yr today · 7 by 30 yrs out
Nearby sold comps map
Loading sold comps map…
Walkable amenities ~0.75 mi
Loading nearby amenities…
Taxation est. · year 1
- Rental income
- $29,792
- − Mortgage interest
- −$16,525
- − Property taxes
- −$4,425
- − Insurance
- −$1,475
- − Repairs & maintenance
- −$2,383
- − Management
- −$2,383
- − Depreciation
- −$8,582
- Taxable loss
- −$5,981
- Est. tax savings @ 24.0%
- +$1,435
- After-tax cash flow
- $507/yr
For passive investors: Depreciation is non-cash, so a rental often shows a tax loss while cash-flowing — sheltering income. Rental losses are passive: they offset passive income freely, and up to $25,000/yr can offset ordinary (W-2) income if you actively participate and your MAGI is under $100k (phasing out to $0 by $150k); unused losses carry forward. On sale, claimed depreciation is recaptured at up to 25%, and gains may owe capital-gains tax (a 1031 exchange can defer both). Figures are a year-1 estimate at your 24.0% rate — not tax advice; consult a CPA.
Condition & rehab AI · 12 photos
This multi-family property is in good condition with cosmetic updates needed. The home is move-in ready with a good foundation and structure.
Value-add opportunities
- Both paint exterior — enhances curb appeal and resale value
- Both landscaping — improves curb appeal and rental value
- Both install new flooring in bathrooms — enhances resale and rental value
Renovation cost estimate screening
Value-add ROI direction
- Both paint exterior — enhances curb appeal and resale value ↑
- Both landscaping — improves curb appeal and rental value ↑
- Both install new flooring in bathrooms — enhances resale and rental value ↑
ⓘ Cost ranges are severity-bucket heuristics (US national rule-of-thumb). Get contractor quotes + a written scope before underwriting a rehab budget.
Schools (NCES district)
- District
- Cherokee County
- NCES district ID
- 1301110
- Math proficiency
- 46% ▼ -11.00%
- Reading proficiency
- 48% ▼ -8.00%
- Median HH income
- $69,295
- Composite
- 42.14/100
- National rank
- #3304
- State rank
- #17 of 174 in GA
Livability — Woodstock
- Score
- 73/100
- State rank
- #46
- US rank
- #5116
Category grades
Schools grade is shown separately in the Schools card above.
Census & demographics
- County
- Cherokee County · 289,977 people
- City population
- 109,446
- Metro
- Atlanta-Sandy Springs-Alpharetta, GA
- Population (ZIP)
- 53,687
- Household income
- $113,089
- Rent vs Own
- Severe rent burden
- 829.0
Population outlook (Cherokee County) Hauer SSP2
- Today (2025)
- 281,923 people
- By 2030
- 303,845 · +7.8%
- By 2040
- 344,738 · +22.3%
- By 2050
- 379,010 · +34.4%
- By 2075
- 449,617 · +59.5%
- By 2100
- 484,103 · +71.7%
Race, ethnicity, and origin ACS 2023
- Neighborhood character
- Predominantly White (82%)
- Race & ethnicity
- White 82% Hispanic / Latino 9% Black 5% Two or more races 5%
- Hispanic origin (detail)
- Mexican 6% Puerto Rican 1%
- Common ancestry
- Slovak 3% Lithuanian 2% Romanian 2%
- Foreign-born
- 7% · Canada, China
- Languages at home
- 89% English-only · Spanish 7% Russian/Polish/Slavic 1% French/Haitian/Cajun 1%
Political lean MEDSL · Cherokee
- 2024 margin
- Solid R (+39.0) · D 30.1% · R 69.1%
- 2008→2024 swing
- +12.1pp toward D · 2008: -51.1pp · 2024: -39.0pp
- All cycles
- 2024: R+39.0 2020: R+39.2 2016: R+50.0 2012: R+57.8 2008: R+51.1
Not yet ingested
- Civics
- —
Market trends
- HPI YoY
- ▼ -105.71%
- Current HPI
- 255.5527
- Rent YoY
- ▼ -0.23%
- Metro
- Atlanta-Sandy Springs-Alpharetta, GA
- State GDP YoY
- ▲ 2.66%
- F500 in state
- 28
Industry mix (Fortune 500 HQ in GA)
| Industry | F500 HQs | Revenue |
|---|---|---|
| Paper / Packaging | 2 | $29B |
|
||
| Retail | 1 | $160B |
|
||
| Transportation / Logistics | 1 | $91B |
|
||
| Airlines | 1 | $62B |
|
||
| Consumer Goods | 1 | $47B |
|
||
| Utilities | 1 | $25B |
|
||
Price history
-15.0% since first listed6 events — show timeline
- 2026-05-31 Listing Removed — FMLS
- 2026-05-18 Rental Removed $1,700 FMLS
- 2026-04-28 Price Changed $1,700 FMLS
- 2026-04-27 Price Changed $295,000 FMLS
- 2026-04-20 Listed $325,000 FMLS
- 2026-04-15 Listed for Rent $2,000 FMLS
Cash-flow waterfall
monthlySold comps — $/sqft
last 12 mo · ≤1 miLoading sold comps…