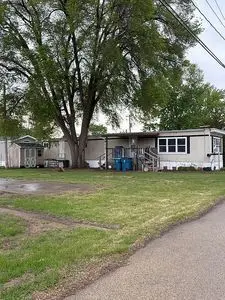
11 Cedar Heights Trailer Ct · Camanche, IA
Flood risk 1/10 · Minimal
- FEMA flood zone
- X (unshaded)
- Chance of flooding over 30 yrs
- 0.0%
- Est. flood insurance / yr
- $473 – $860
Fire risk 5/10 · Moderate
- Est. fire insurance / yr
- $902 – $1,676
Heat risk 3/10 · Minor
- Hot days now (above 103°F)
- 7 days/yr
- Hot days in 30 yrs
- 16 days/yr
Wind risk 2/10 · Minimal
- Chance of severe wind over 30 yrs
- —
Air-quality risk 3/10 · Minor
- Unhealthy air days now
- 2 days/yr
- Unhealthy air days in 30 yrs
- 3 days/yr
Risk factors via First Street. Map © Google.
Why this score? — see what drove the D+ grade
The composite is a weighted blend of 9 inputs, each scored 0–100. Each bar is that input's sub-score; the figure is the points it added to the 100-point composite (weight × sub-score).
- Cash flow +15.0/30.0
- ARV discount +7.5/15.0
- Schools +5.5/10.0
- 1% rule +5.0/10.0
- DSCR +5.0/10.0
- Condition / age +4.0/5.0
- Livability +3.5/5.0
- Rent growth +2.5/5.0
- Appreciation +0.0/10.0
$6,000
🖨 Deal sheet 📄 Offer letter ✓ Due diligence
Listing remarks
Well-maintained 14x70 mobile home located in Cedar Heights Mobile Home Park in Camanche. Move in ready! Great location with easy access to Washington Blvd and within walking distance to Camanche Middle and High School. Features include a nice-sized living room that opens into an eat-in kitchen, creating a comfortable and functional layout. A new gas cooktop was installed just one year ago. The main bedroom comfortably fits a queen-sized bed. Washer and dryer are included and in excellent condition. The furnace has been recently serviced for peace of mind. New water heater installed within the last year. Refrigerator is one year old. Roof was also resealed within the last year. ? Enjoy being
Key facts
- New gas cooktop
- Eat-in kitchen
- Built 1974
Tags
Neighborhood map
What this means for you Summary
Snapshot
- This is a 2-bed/1.0-bath other listed at $6k. Condition is rated good.
Deal economics
- At list price, monthly cash flow is $708 ($8k/yr) — positive.
- The deal already cash-flows at list — no discount required.
- Meets the 1% rule at list price ($949 rent vs $6k).
- Recommended offer: $6k (1.5% below list) — sets the bar for market timing.
- Cap rate 147.9% vs local median 2.6% in Camanche — top-decile yield for the area; either an underpriced asset or a hidden risk that comps aren't pricing in. Stress-test before assuming the spread holds.
Location & tenants
- Location reads 70/100 on livability (#366 in IA) — a middle-class / working-renter tenant base. Strengths: cost of living A+, housing A+, crime A; Watch: amenities F, commute F, health & safety F.
- Camanche Community School District (town): math 60% / reading 68% proficiency, ranked #203 of 289 in IA (top 70%) — acceptable for families but not a draw, mixed tenant base, ~2y average lease.
- Market conditions: 35 active listings in the ZIP; 116 units permitted in Clinton County in 2024 (50 in 5+ unit buildings).
Forward outlook
- Local home prices are declining (-3.0%/yr); year-one equity from $41 of loan paydown is wiped out by about $180 of value loss. Plan a longer hold.
- Clinton County population projected at -19% by 2050 — secular population decline; favor cash flow + early exit over multi-decade hold.
- At projected returns (-3.0% appreciation + 3.0% rent growth), your $2k cash investment doubles in ~1 year — after that, you're playing with house money.
Negotiation context
- It's been on market 27 days — a 2% lower offer ($6k) is reasonable based on typical stale-listing flexibility.
Risks & watch-outs
- Climate carrying-cost: moderate wildfire risk — expect insurance premiums to compound above CPI over the hold.
Questions for the listing agent
- Built in 1974 — when were the roof, HVAC, electrical panel, plumbing, and water heater last replaced?
- Is there a deadline driving the sale (1031 exchange, divorce, estate, relocation)? That informs how much negotiation room exists.
- Schools are B-rated — typically a magnet for longer-tenancy family renters. What's the average tenant stay here, and is there a school-zone premium baked into asking?
- The area grade is low — what's the realistic commute time and amenity access for the typical tenant pool here? Any planned neighborhood developments (good or bad) we should know about?
- What's the average days-on-market for RENTAL listings here right now (not sales)? A rising rental-DOM trend means longer vacancies and softer asking-rent achievability than the comps imply.
- What's the recent tenant-quality profile in this submarket — average credit score on applications, eviction rate, late-payment / NSF rate, and stable-employment percentage? A property-management company in the area should have these aggregated.
- How much new for-sale + rental construction is in the pipeline within 1–3 miles? Heavy new supply typically softens prices + rents 12–24 months out; constrained supply supports both.
Investment metrics
- 1% rule
- 15.82% ✓
- Cap rate
- 147.95%
- Cash-on-cash
- 505.90%
- DSCR
- 23.51
- GRM
- 0.5
CMA / ARV
No comps found within radius.
Projected returns pro-forma
-3.0% appreciation · 3.0% rent growth · sell at horizon
- IRR
- —
- Equity multiple
- 27.28×
- Total profit
- $44,152
- Equity at exit
- $895
- IRR
- —
- Equity multiple
- 58.49×
- Total profit
- $96,590
- Equity at exit
- $519
Cash invested: $1,680 (down + closing). Projections, not guarantees.
Landlord ↔ Tenant lean methodology
- Overall (STATE)
- 83 Strongly Landlord-Friendly
- State Iowa
- 83 Strongly Landlord-Friendly · R+6
- County
- — inherits STATE
- City
- — inherits STATE
ZIP-level market 52730
- Home prices YoY
- -28.1%
- Active inventory
- 35
- Price-to-rent
- 0.5×
Monthly cashflow live
- Estimated rent
- $949 medium interval (Pro) →
- Mortgage (P&I)
- −$31
- Tax est. 1.5%
- −$8 /mo · $90/yr
- Insurance
- −$2
- HOA
- −$0
- Vacancy / Maint / Mgmt
- −$199
- Net cashflow
- $708
Break-even live
UW: 25.0% down · 7.5% · 30yr · 1.5% tax · 5.0% vac · 8.0% maint · 8.0% mgmt
Financing live
Cash to close
- Down payment
- $1,500
- Closing costs
- $180
- Reserves months
- —
- Total cash needed
- —
Loan-product check · same deal, 3 products live
Conventional
25% down · 7.5% · 30yr
- Down + closing
- —
- Monthly P&I
- —
- Monthly cashflow
- —
- DSCR
- —
- Eligible?
- —
Personal DTI + credit; lowest rate.
DSCR
20% down · 8.5% · 30yr
- Down + closing
- —
- Monthly P&I
- —
- Monthly cashflow
- —
- DSCR
- —
- Eligible?
- —
No personal income docs; deal must DSCR.
Hard money
10% down · 12.0% · 12mo
- Down + closing
- —
- Monthly P&I
- —
- Monthly cashflow
- —
- DSCR
- —
- Eligible?
- —
Short-term bridge; refi at stabilization.
Listing history 17 events
-
2026-06-19days on market $6,000 Active 27 DOM
-
2026-06-18days on market $6,000 Active 26 DOM
-
2026-06-17days on market $6,000 Active 25 DOM
-
2026-06-16days on market $6,000 Active 24 DOM
-
2026-06-15days on market $6,000 Active 23 DOM
-
2026-06-14days on market $6,000 Active 21 DOM
-
2026-06-12days on market $6,000 Active 20 DOM
-
2026-06-09days on market $6,000 Active 17 DOM
-
2026-06-08days on market $6,000 Active 16 DOM
-
2026-06-07days on market $6,000 Active 15 DOM
-
2026-06-07days on market $6,000 Active 14 DOM
-
2026-06-03days on market $6,000 Active 11 DOM
-
2026-06-02days on market $6,000 Active 10 DOM
-
2026-06-01days on market $6,000 Active 9 DOM
-
2026-05-31days on market $6,000 Active 8 DOM
-
2026-05-30days on market $6,000 Active 7 DOM
-
2026-05-24$6,000 Active
ⓘ Source: listings_history table (triggers on properties + properties_extension) + one-shot
backfill from property_details.listing_events for pre-trigger history.
Climate risk First Street
- Flood 1/10 Low FEMA zone X (unshaded) · 0% chance over 30 yrs
- Wildfire 5/10 Major
- Heat 3/10 Moderate 7 d/yr ≥103°F today · 16 d/yr by 30 yrs out
- Wind 2/10 Low
- Air quality 3/10 Moderate 2 unhealthy d/yr today · 3 by 30 yrs out
Nearby sold comps map
Loading sold comps map…
Walkable amenities ~0.75 mi
Loading nearby amenities…
Taxation est. · year 1
- Rental income
- $11,388
- − Mortgage interest
- −$336
- − Property taxes
- −$90
- − Insurance
- −$30
- − Repairs & maintenance
- −$911
- − Management
- −$911
- − Depreciation
- −$175
- Taxable income
- $8,935
- Est. tax owed @ 24.0%
- −$2,145
- After-tax cash flow
- $6,355/yr
For passive investors: Depreciation is non-cash, so a rental often shows a tax loss while cash-flowing — sheltering income. Rental losses are passive: they offset passive income freely, and up to $25,000/yr can offset ordinary (W-2) income if you actively participate and your MAGI is under $100k (phasing out to $0 by $150k); unused losses carry forward. On sale, claimed depreciation is recaptured at up to 25%, and gains may owe capital-gains tax (a 1031 exchange can defer both). Figures are a year-1 estimate at your 24.0% rate — not tax advice; consult a CPA.
Condition & rehab AI · 1 photo
This well-maintained mobile home is move-in ready with recent updates to the kitchen, appliances, and HVAC. It offers a good investment opportunity with potential for further value enhancement through cosmetic upgrades.
Value-add opportunities
- Both Painting the exterior and interior walls — Fresh paint can enhance curb appeal and interior aesthetics.
- Both Landscaping improvements — Enhanced landscaping can improve curb appeal and attract more potential buyers or renters.
- Resale Upgrading the kitchen appliances — Modernizing the kitchen with new appliances can attract more buyers.
- Resale Upgrading the flooring — Upgrading the flooring can improve the home's overall appearance and attract more buyers.
- Resale Upgrading the windows — Upgrading windows can improve energy efficiency and increase the home's value.
- Both Upgrading the HVAC system — A new HVAC system can improve comfort and energy efficiency, attracting more buyers and renters.
- Both Upgrading the exterior siding — A fresh coat of paint or new siding can significantly enhance the home's curb appeal and value.
Renovation cost estimate screening
Value-add ROI direction
- Both Painting the exterior and interior walls — Fresh paint can enhance curb appeal and interior aesthetics. ↑
- Both Landscaping improvements — Enhanced landscaping can improve curb appeal and attract more potential buyers or renters. ↑
- Resale Upgrading the kitchen appliances — Modernizing the kitchen with new appliances can attract more buyers. ↑
- Resale Upgrading the flooring — Upgrading the flooring can improve the home's overall appearance and attract more buyers. ↑
- Resale Upgrading the windows — Upgrading windows can improve energy efficiency and increase the home's value. ↑
- Both Upgrading the HVAC system — A new HVAC system can improve comfort and energy efficiency, attracting more buyers and renters. ↑
- Both Upgrading the exterior siding — A fresh coat of paint or new siding can significantly enhance the home's curb appeal and value. ↑
ⓘ Cost ranges are severity-bucket heuristics (US national rule-of-thumb). Get contractor quotes + a written scope before underwriting a rehab budget.
Schools (NCES district)
- District
- Camanche Community School District
- NCES district ID
- 1906060
- Math proficiency
- 60% ▼ -9.00%
- Reading proficiency
- 68% ▲ 1.00%
- Median HH income
- $52,982
- Composite
- 54.65/100
- National rank
- #1331
- State rank
- #203 of 289 in IA
Livability — Camanche
- Score
- 70/100
- State rank
- #366
- US rank
- #7649
Category grades
Schools grade is shown separately in the Schools card above.
Census & demographics
- Census place
- Camanche, IA
- Population (ZIP)
- 4,993
Population outlook (Clinton County) Hauer SSP2
- Today (2025)
- 44,817 people
- By 2030
- 43,090 · -3.9%
- By 2040
- 39,513 · -11.8%
- By 2050
- 36,209 · -19.2%
- By 2075
- 31,888 · -28.8%
- By 2100
- 30,382 · -32.2%
Race, ethnicity, and origin ACS 2023
- Neighborhood character
- Predominantly White (94%)
- Race & ethnicity
- White 94% Two or more races 4% Black 1%
- Common ancestry
- Portuguese 4% Iranian 2% Romanian 1%
- Foreign-born
- 1%
- Languages at home
- 98% English-only · Tagalog/Filipino 1%
Political lean MEDSL · Clinton
- 2024 margin
- R (+18.9) · D 39.8% · R 58.6% · Other 1.6%
- 2008→2024 swing
- -41.9pp toward R · 2008: 23.0pp · 2024: -18.9pp
- All cycles
- 2024: R+18.9 2020: R+10.3 2016: R+5.1 2012: D+22.9 2008: D+23.0
Not yet ingested
- Civics
- —
Market trends
- HPI YoY
- ▼ -84.19%
- Current HPI
- 215.2008
- Rent YoY
- —
- Metro
- —
- State GDP YoY
- ▲ 2.48%
- F500 in state
- 4
Industry mix (Fortune 500 HQ in IA)
| Industry | F500 HQs | Revenue |
|---|---|---|
| Financial Services | 1 | $16B |
|
||
| Retail / Convenience | 1 | $15B |
|
||
Price history
1 event — show timeline
- 2026-05-24 Listed $6,000 FSBO.com
Cash-flow waterfall
monthlySold comps — $/sqft
last 12 mo · ≤1 miLoading sold comps…