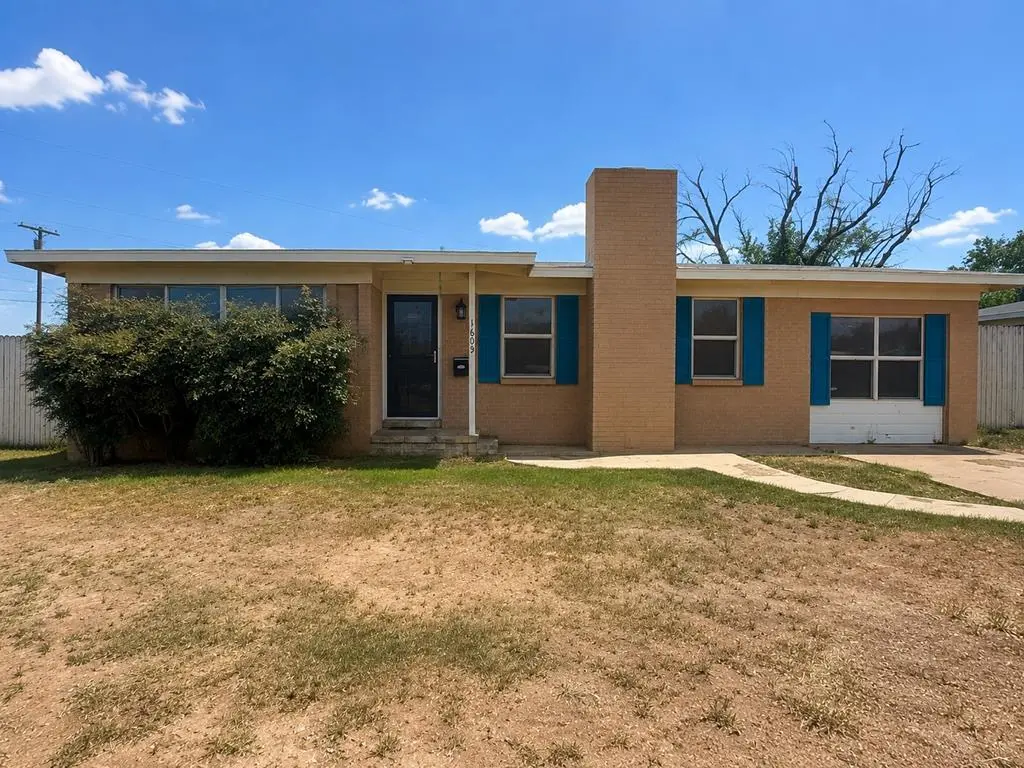
1605 Fargo Ave · Odessa, TX
Flood risk 1/10 · Minimal
- FEMA flood zone
- X (unshaded)
- Chance of flooding over 30 yrs
- 0.0%
- Est. flood insurance / yr
- $507 – $1,088
Fire risk 2/10 · Minimal
- Est. fire insurance / yr
- $1,222 – $2,270
Heat risk 6/10 · Moderate
- Hot days now (above 101°F)
- 7 days/yr
- Hot days in 30 yrs
- 22 days/yr
Wind risk 2/10 · Minimal
- Chance of severe wind over 30 yrs
- 3.0%
Air-quality risk 1/10 · Minimal
- Unhealthy air days now
- 0 days/yr
- Unhealthy air days in 30 yrs
- 0 days/yr
Risk factors via First Street. Map © Google.
Why this score? — see what drove the B- grade
The composite is a weighted blend of 9 inputs, each scored 0–100. Each bar is that input's sub-score; the figure is the points it added to the 100-point composite (weight × sub-score).
- Cash flow +24.8/30.0
- ARV discount +15.0/15.0
- DSCR +8.0/10.0
- 1% rule +5.9/10.0
- Livability +3.8/5.0
- Rent growth +2.8/5.0
- Condition / age +2.5/5.0
- Schools +2.2/10.0
- Appreciation +0.0/10.0
$159,900
🖨 Deal sheet 📄 Offer letter ✓ Due diligence
Listing remarks MLS
Cutest 2 bedroom 2 bath home ever!!!! Huge covered patio for entertaining. Tile flooring. Roof replaced September 2019.
Key facts
- 0.25 acre lot
- Built 1957
- Listed 2 days
Property features AI
Exterior
- Parking: Parking pad
- Security: Smoke detectors
- Utilities: Public water; Public sewer; Propane available
- Home design: Residential single-family home
- Construction: Brick veneer exterior; Composition roof; Pillar/post/pier foundation; Built in 2026
- Exterior features: Covered patio/porch; Landscaped lot; Paved road access; Solar
Interior
- Kitchen: Gas range; Microwave; Dishwasher
- Flooring: Tile
- Bathrooms: 2 full bathrooms
- Heating & cooling: Natural gas heating; Central electric air conditioning
- Interior features: Pantry; Blinds; Gas water heater; Has fireplace (located in den)
Neighborhood map
What this means for you Summary
Snapshot
- This is a 2-bed/2.0-bath single-family listed at $160k.
Deal economics
- At list price, monthly cash flow is $338 ($4k/yr) — positive.
- The deal already cash-flows at list — no discount required.
- Meets the 1% rule at list price ($2k rent vs $160k).
Location & tenants
- Location reads 75/100 on livability (#132 in TX, #3,928 nationally) — a middle-class / working-renter tenant base. Strengths: cost of living A+, housing A+, health & safety A+; Watch: commute D+, amenities D.
- Ector County ISD (urban): math 22% / reading 27% proficiency, ranked #707 of 826 in TX (top 86%) — low school quality limits family demand, transient renter base, plan for 1-2y turnover.
- Zoned schools: Gonzales El (math 37% / reading 27%, grade F, #2,268 of 4,322 statewide, top 55%, 497 students, 75% FRL); Nimitz Middle (math 29% / reading 36%, grade F, #947 of 1,662 statewide, top 58%, 1,303 students, 51% FRL); Permian H S (math 19% / reading 29%, grade F, #1,333 of 1,632 statewide, top 82%, 3,978 students, 51% FRL) — zoned schools at 59% FRL track the district average.
- Market conditions: Rents rising (+1.4%/yr); 263 active listings in the ZIP; 30 comparable units currently listed for rent nearby; rentals leasing fast (median 13d on market — plan ~1-2 weeks tenant-placement turnaround); solid renter incomes; 1,004 units permitted in Ector County in 2024 (0 in 5+ unit buildings).
Forward outlook
- Local home prices are declining (-3.0%/yr); year-one equity from $1k of loan paydown is wiped out by about $5k of value loss. Plan a longer hold.
- Ector County population projected at +78% by 2050 — long-run rental-demand tailwind backs the buy-and-hold thesis.
Negotiation context
- Only 3 days on market — expect competitive offers; lowballing is unlikely to land.
- 5 sale attempts since 20y ago with the ask held roughly flat each time — persistent listings suggest the price (not the market) is what's stuck; bring a comps-based counter.
Risks & watch-outs
- Watch-outs: built in 1957 — expect roof / HVAC / electrical / plumbing capex.
- Climate carrying-cost: extreme-heat days projected 7→22/yr by 2055 (HVAC capex compounding) — expect insurance premiums to compound above CPI over the hold.
Questions for the listing agent
- Built in 1957 — when were the roof, HVAC, electrical panel, plumbing, and water heater last replaced?
- Is there a deadline driving the sale (1031 exchange, divorce, estate, relocation)? That informs how much negotiation room exists.
- Schools are F-rated, which usually means shorter tenancies and higher turnover. Who's the typical renter profile here, and what's been the actual vacancy rate?
- What's the average days-on-market for RENTAL listings here right now (not sales)? A rising rental-DOM trend means longer vacancies and softer asking-rent achievability than the comps imply.
- What's the recent tenant-quality profile in this submarket — average credit score on applications, eviction rate, late-payment / NSF rate, and stable-employment percentage? A property-management company in the area should have these aggregated.
- How much new for-sale + rental construction is in the pipeline within 1–3 miles? Heavy new supply typically softens prices + rents 12–24 months out; constrained supply supports both.
Investment metrics
- 1% rule
- 1.09% ✓
- Cap rate
- 8.83%
- Cash-on-cash
- 9.07%
- DSCR
- 1.40
- GRM
- 7.6
CMA / ARV
- ARV (on-the-fly)
- $240,108
- Comps found
- 1
Show comp detail 1 sale within ~0.75 mi
| Address | Dist | Beds/Ba | Sqft | Sold | Price | $/sf | Match |
|---|---|---|---|---|---|---|---|
| 2601 Halifax Ave | 0.46mi | 3/2.0 (+1) | 1,460 (+14%) | 14mo | $273,000 | $187 | 39 |
Match score weights: distance 35% · size 25% · config 20% · recency 20%. Top-matched comps best support the ARV.
Projected returns pro-forma
-3.0% appreciation · 1.36% rent growth · sell at horizon
- IRR
- -4.4%
- Equity multiple
- 0.84×
- Total profit
- $-7,200
- Equity at exit
- $23,842
- IRR
- 3.4%
- Equity multiple
- 1.23×
- Total profit
- $10,182
- Equity at exit
- $13,825
Cash invested: $44,772 (down + closing). Projections, not guarantees.
Landlord ↔ Tenant lean methodology
- Overall (STATE)
- 87 Strongly Landlord-Friendly
- State Texas
- 87 Strongly Landlord-Friendly · R+5
- County
- — inherits STATE
- City
- — inherits STATE
ZIP-level market 79762
- Rents YoY
- 1.4%
- Active inventory
- 263
- Price-to-rent
- 7.6×
Monthly cashflow live
- Estimated rent
- $1,746 high interval (Pro) →
- Mortgage (P&I)
- −$839
- Tax from tax record
- −$136 /mo · $1,627/yr
- Insurance
- −$67
- HOA
- −$0
- Vacancy / Maint / Mgmt
- −$367
- Net cashflow
- $338
Break-even live
UW: 25.0% down · 7.5% · 30yr · 1.5% tax · 5.0% vac · 8.0% maint · 8.0% mgmt
Financing live
Cash to close
- Down payment
- $39,975
- Closing costs
- $4,797
- Reserves months
- —
- Total cash needed
- —
Loan-product check · same deal, 3 products live
Conventional
25% down · 7.5% · 30yr
- Down + closing
- —
- Monthly P&I
- —
- Monthly cashflow
- —
- DSCR
- —
- Eligible?
- —
Personal DTI + credit; lowest rate.
DSCR
20% down · 8.5% · 30yr
- Down + closing
- —
- Monthly P&I
- —
- Monthly cashflow
- —
- DSCR
- —
- Eligible?
- —
No personal income docs; deal must DSCR.
Hard money
10% down · 12.0% · 12mo
- Down + closing
- —
- Monthly P&I
- —
- Monthly cashflow
- —
- DSCR
- —
- Eligible?
- —
Short-term bridge; refi at stabilization.
Rent comps 30 comps
| Address | Beds | Baths | Sqft | Rent | $/sqft | DOM | Units | Dist |
|---|---|---|---|---|---|---|---|---|
| 2608 Cumberland Rd Odessa, TX | 2.0 | 2.0 | 1404 | $1,500 | $1.07 | 13d | 1 | 0.40mi |
| 2620 Cambridge St Odessa, TX | 3.0 | 2.0 | 1595 | $1,950 | $1.22 | 21d | 1 | 0.45mi |
| 2705 Cambridge St Odessa, TX | 3.0 | 2.0 | 1456 | $2,400 | $1.65 | 21d | 1 | 0.50mi |
| 2801 Redbud Ave Odessa, TX | 3.0 | 2.0 | 1558 | $1,800 | $1.16 | 13d | 1 | 0.58mi |
| 3616 E 30th St Odessa, TX | 3.0 | 2.0 | 1436 | $1,995 | $1.39 | 43d | 1 | 0.63mi |
| 2905 Byron Ave Odessa, TX | 3.0 | 2.0 | 1816 | $2,400 | $1.32 | 13d | 1 | 0.79mi |
| 2701 Pagewood Ave Odessa, TX | 2.0 | 2.0 | 1000 | $1,615 | $1.61 | 21d | 1 | 0.86mi |
| 2725 Pagewood Ave Unit 16 Odessa, TX | 1.0 | 1.0 | 1000 | $1,195 | $1.20 | 13d | 1 | 0.88mi |
| 2901 Nabors Ln Odessa, TX | 3.0 | 1.0 | 1374 | $1,800 | $1.31 | 21d | 1 | 0.90mi |
| 2901 Nabors Ln Odessa, TX | 3.0 | 1.0 | 1508 | $1,800 | $1.19 | 13d | 1 | 0.90mi |
| 2735 E 8th St Odessa, TX | 1.0–3.0 | 1.0–2.0 | 842 | $1,456 | $1.73 | 13d | 8 | 0.92mi |
| 3310 Tanglewood Ln Unit 1 Odessa, TX | 3.0 | 2.5 | 1732 | $2,200 | $1.27 | 21d | 1 | 0.98mi |
| 1513 E 11th St Odessa, TX | 3.0 | 2.0 | 1728 | $3,300 | $1.91 | 43d | 1 | 0.98mi |
| 3312 Tanglewood Ln Odessa, TX | 3.0 | 2.5 | 1664 | $2,000 | $1.20 | 43d | 1 | 0.99mi |
| 701 Hillcrest Ave Odessa, TX | 3.0 | 2.0 | 1344 | $1,400 | $1.04 | 43d | 1 | 1.01mi |
| 4600 Oakwood Dr Odessa, TX | 1.0–2.0 | 1.0–2.0 | 712 | $1,500 | $2.11 | 13d | 19 | 1.04mi |
| 3812 E Everglade Ave Odessa, TX | 3.0 | 2.0 | 1861 | $2,500 | $1.34 | 21d | 1 | 1.10mi |
| 1401 E 18th St Odessa, TX | 3.0 | 2.0 | 1690 | $2,000 | $1.18 | 13d | 1 | 1.14mi |
| 1409 E 23rd St Odessa, TX | 2.0 | 1.0 | 1032 | $2,400 | $2.33 | 43d | 1 | 1.15mi |
| 3939 Tanglewood Ln Odessa, TX | 1.0–3.0 | 1.0–2.0 | 825 | $1,372 | $1.66 | 13d | 9 | 1.21mi |
| 3824 Englewood Cir Odessa, TX | 2.0 | 1.5 | 1150 | $1,295 | $1.13 | 13d | 1 | 1.27mi |
| 4675 Oakwood Dr Odessa, TX | 1.0–2.0 | 1.0–2.0 | 875 | $1,550 | $1.77 | 13d | 7 | 1.32mi |
| 3902 Englewood Cir Odessa, TX | 2.0 | 1.5 | 1280 | $1,445 | $1.13 | 13d | 1 | 1.33mi |
| 3904 Englewood Cir Odessa, TX | 1.0 | 1.0 | 900 | $1,255 | $1.39 | 43d | 1 | 1.33mi |
| 3904 Englewood Cir Odessa, TX | 2.0 | 1.0 | 1280 | $1,445 | $1.13 | 13d | 1 | 1.33mi |
| 3907 Englewood Cir Odessa, TX | 2.0 | 1.5 | 1170 | $1,395 | $1.19 | 13d | 1 | 1.34mi |
| 3802 Englewood Cir Odessa, TX | 2.0 | 1.5 | 1150 | $1,295 | $1.13 | 13d | 1 | 1.35mi |
| 3926 Englewood Cir Odessa, TX | 1.0 | 1.0 | 900 | $1,250 | $1.39 | 21d | 1 | 1.36mi |
| 2702 S Colonial Dr Odessa, TX | 3.0 | 1.0 | 1490 | $1,500 | $1.01 | 13d | 1 | 1.43mi |
| 1326 French Ave Unit A Odessa, TX | 2.0 | 1.5 | 1600 | $2,000 | $1.25 | 43d | 1 | 1.50mi |
Listing history 4 events
-
2026-06-19days on market $159,900 Active 3 DOM
-
2026-06-18days on market $159,900 Active 2 DOM
-
2026-06-17remarks 246-char remark
-
2026-06-17$159,900 Active 1 DOM
ⓘ Source: listings_history table (triggers on properties + properties_extension) + one-shot
backfill from property_details.listing_events for pre-trigger history.
Tax reassessment forecast TX · Resets to sale price
- Current annual tax
- $1,627 · $136/mo
- Projected year-2 tax
- $2,926 · $244/mo
- Expected delta
- +$1,299/yr (+$108/mo · 79.8%)
ⓘ Screening estimate from a state-policy table — verify with the county assessor before closing.
Climate risk First Street
- Flood 1/10 Low FEMA zone X (unshaded) · 0% chance over 30 yrs
- Wildfire 2/10 Low
- Heat 6/10 Major 7 d/yr ≥101°F today · 22 d/yr by 30 yrs out
- Wind 2/10 Low 3% chance of damaging wind over 30 yrs
- Air quality 1/10 Low 0 unhealthy d/yr today · 0 by 30 yrs out
Nearby sold comps map
Loading sold comps map…
Walkable amenities ~0.75 mi
Loading nearby amenities…
Taxation est. · year 1
- Rental income
- $20,950
- − Mortgage interest
- −$8,957
- − Property taxes
- −$1,627
- − Insurance
- −$800
- − Repairs & maintenance
- −$1,676
- − Management
- −$1,676
- − Depreciation
- −$4,652
- Taxable income
- $1,563
- Est. tax owed @ 24.0%
- −$375
- After-tax cash flow
- $3,687/yr
For passive investors: Depreciation is non-cash, so a rental often shows a tax loss while cash-flowing — sheltering income. Rental losses are passive: they offset passive income freely, and up to $25,000/yr can offset ordinary (W-2) income if you actively participate and your MAGI is under $100k (phasing out to $0 by $150k); unused losses carry forward. On sale, claimed depreciation is recaptured at up to 25%, and gains may owe capital-gains tax (a 1031 exchange can defer both). Figures are a year-1 estimate at your 24.0% rate — not tax advice; consult a CPA.
Schools (NCES district)
- District
- Ector County ISD
- NCES district ID
- 4818000
- Math proficiency
- 22% ▼ -9.00%
- Reading proficiency
- 27% ▼ -4.00%
- Median HH income
- $52,740
- Composite
- 21.89/100
- National rank
- #8233
- State rank
- #707 of 826 in TX
Livability — Odessa
- Score
- 75/100
- State rank
- #132
- US rank
- #3928
Category grades
Schools grade is shown separately in the Schools card above.
Census & demographics
- Census place
- Odessa, TX
- County
- Ector County · 131,169 people
- City population
- 131,169
- Metro
- Odessa, TX
- Population (ZIP)
- 39,927
- Household income
- $75,272
- Rent vs Own
- Severe rent burden
- 1477.0
Population outlook (Ector County) Hauer SSP2
- Today (2025)
- 212,765 people
- By 2030
- 241,962 · +13.7%
- By 2040
- 306,582 · +44.1%
- By 2050
- 379,755 · +78.5%
- By 2075
- 568,991 · +167.4%
- By 2100
- 709,829 · +233.6%
Race, ethnicity, and origin ACS 2023
- Neighborhood character
- Diverse neighborhood (Simpson 0.58)
- Race & ethnicity
- Hispanic / Latino 52% White 38% Two or more races 22% Black 6% Asian 2% Native American 1%
- Hispanic origin (detail)
- Mexican 45% Cuban 3%
- Common ancestry
- Slovak 1% Lithuanian 1% Italian 1%
- Foreign-born
- 12% · Canada, Vietnam
- Languages at home
- 68% English-only · Spanish 30%
Political lean MEDSL · Ector
- 2024 margin
- Solid R (+52.9) · D 23.2% · R 76.1%
- 2008→2024 swing
- -4.9pp toward R · 2008: -48.0pp · 2024: -52.9pp
- All cycles
- 2024: R+52.9 2020: R+47.8 2016: R+40.6 2012: R+48.9 2008: R+48.0
Not yet ingested
- Civics
- —
Market trends
- HPI YoY
- ▼ -194.97%
- Current HPI
- 229.6022
- Rent YoY
- ▲ 1.36%
- Metro
- Odessa, TX
- State GDP YoY
- ▲ 3.95%
- F500 in state
- 110
Industry mix (Fortune 500 HQ in TX)
| Industry | F500 HQs | Revenue |
|---|---|---|
| Energy | 16 | $1,198B |
|
||
| Technology | 5 | $198B |
|
||
| Engineering / Construction | 4 | $72B |
|
||
| Energy Services | 3 | $60B |
|
||
| Utilities | 3 | $41B |
|
||
| Healthcare | 2 | $330B |
|
||
Price history
+113.5% since first listed14 events — show timeline
- 2026-06-16 Listed $159,900 ODMLS
- 2020-04-07 Sold (Public Records) — Public Records
- 2020-04-06 Sold (MLS) — ODMLS
- 2019-10-15 Listed $160,000 ODMLS
- 2014-04-15 Sold (Public Records) — Public Records
- 2014-04-09 Sold (MLS) — ODMLS
- 2013-12-17 Listed $123,000 ODMLS
- 2009-03-26 Sold (Public Records) — Public Records
- 2009-03-25 Sold (MLS) — ODMLS
- 2009-02-11 Listed $86,900 ODMLS
- 2006-06-27 Sold (Public Records) — Public Records
- 2006-06-26 Sold (MLS) — ODMLS
- 2006-05-02 Listed $74,900 ODMLS
- 2004-08-04 Sold (Public Records) — Public Records
Property tax history
-3.1%/yrLatest (2025): $1,627 · -36.5% YoY. Source: county tax records.
Cash-flow waterfall
monthlySold comps — $/sqft
last 12 mo · ≤1 miLoading sold comps…