 🏷️ Likely Rental
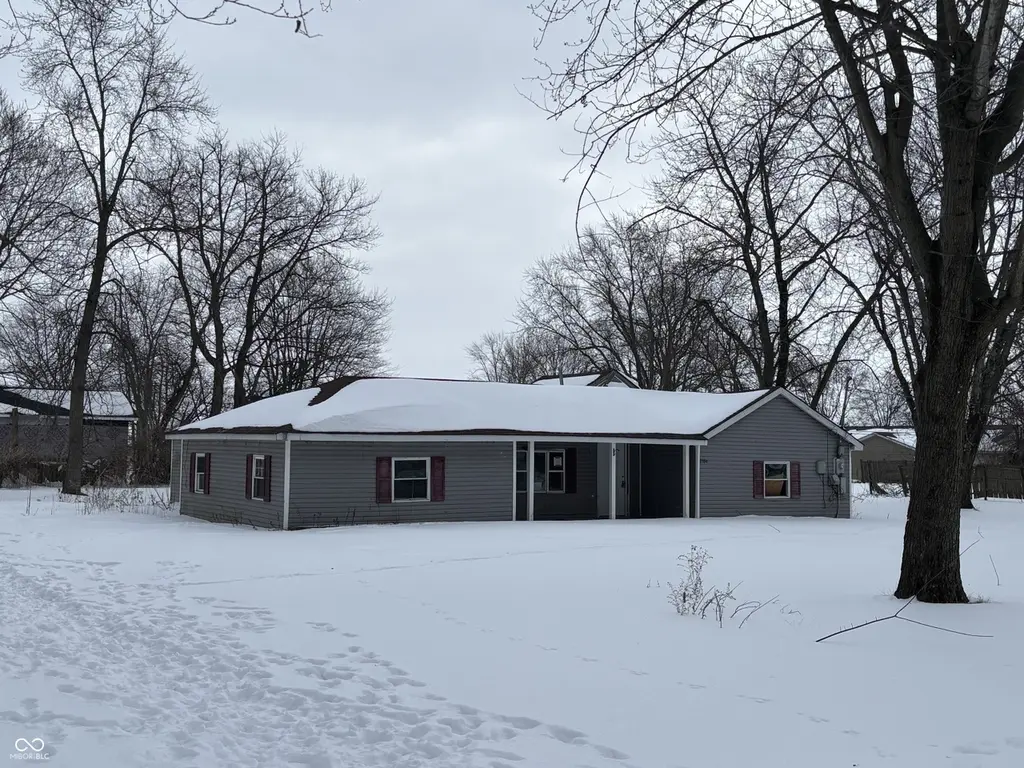
2104 Hunter Ave · New Castle, IN
Flood risk 1/10 · Minimal
- FEMA flood zone
- X (unshaded)
- Chance of flooding over 30 yrs
- 0.0%
- Est. flood insurance / yr
- $507 – $1,088
Fire risk 1/10 · Minimal
- Est. fire insurance / yr
- $717 – $1,331
Heat risk 3/10 · Minor
- Hot days now (above 99°F)
- 7 days/yr
- Hot days in 30 yrs
- 18 days/yr
Wind risk 2/10 · Minimal
- Chance of severe wind over 30 yrs
- 1.0%
Air-quality risk 2/10 · Minimal
- Unhealthy air days now
- 1 days/yr
- Unhealthy air days in 30 yrs
- 2 days/yr
Risk factors via First Street. Map © Google.
Why this score? — see what drove the B- grade
The composite is a weighted blend of 9 inputs, each scored 0–100. Each bar is that input's sub-score; the figure is the points it added to the 100-point composite (weight × sub-score).
- Cash flow +30.0/30.0
- DSCR +10.0/10.0
- 1% rule +9.5/10.0
- ARV discount +7.5/15.0
- Livability +3.8/5.0
- Rent growth +3.6/5.0
- Schools +2.7/10.0
- Condition / age +2.5/5.0
- Appreciation +0.0/10.0
$70,000
🖨 Deal sheet (PDF) 📄 Offer letter ✓ Due diligence
Listing remarks MLS
Attention investors: Opportunity alert! This partially completed single family home presents a strong opportunity to control final costs and maximize returns. The property is currently at the drywall stage, with core construction and layout already completed - saving months of build time. With major structural and mechanical components in place, the remaining work centers on interior finishes and final installations, making this an efficient project for a flip or long-term rental strategy. The modern layout is designed to meet current buyer and tenant preferences, supporting solid resale and rental potential.
Key facts
- Rental potential
- Modern layout
- Resale potential
Tags
Neighborhood map
What this means for you Summary
Snapshot
- This is a 3-bed/2.0-bath single-family listed at $70k.
Deal economics
- At list price, monthly cash flow is $341 ($4k/yr) — positive.
- The deal already cash-flows at list — no discount required.
- Meets the 1% rule at list price ($1k rent vs $70k).
- Recommended offer: $62k (12.0% below list) — sets the bar for market timing.
- Cap rate 12.1% vs local median 4.7% in New Castle — top-decile yield for the area; either an underpriced asset or a hidden risk that comps aren't pricing in. Stress-test before assuming the spread holds.
Location & tenants
- Location reads 75/100 on livability (#64 in IN, #4,219 nationally) — a middle-class / working-renter tenant base. Strengths: crime A+, cost of living A+, housing A+; Watch: amenities F, commute F, employment D-.
- New Castle Community School Corporation (town): math 30% / reading 35% proficiency, ranked #229 of 301 in IN (top 76%) — families likely to look elsewhere, expect single-tenant / working-renter base with shorter leases.
- Zoned schools: New Castle Middle School (math 20% / reading 31%, grade F, #243 of 330 statewide, top 74%, 666 students, 61% FRL).
- Market conditions: Rents rising fast (+4.6%/yr); 217 active listings in the ZIP; 3 comparable units currently listed for rent nearby; rentals leasing fast (median 4d on market — plan ~1-2 weeks tenant-placement turnaround); 47 units permitted in Henry County in 2024 (0 in 5+ unit buildings).
Forward outlook
- Local home prices are declining (-3.0%/yr); year-one equity from $484 of loan paydown is wiped out by about $2k of value loss. Plan a longer hold.
- Henry County population projected at -12% by 2050 — secular population decline; favor cash flow + early exit over multi-decade hold.
- At projected returns (-3.0% appreciation + 4.6% rent growth), your $20k cash investment doubles in ~6 years — after that, you're playing with house money.
Negotiation context
- It's been on market 128 days — a 12% lower offer ($62k) is reasonable based on typical stale-listing flexibility.
- 5 sale attempts since 22y ago; this cycle's ask has dropped $30k (30%) from the opening price — seller is motivated, your offer sets the floor, not the list.
- Current owner paid $24k; list at $70k implies a 193% gain — meaningful room to come down on a strong offer.
Risks & watch-outs
- Watch-outs: built in 1955 — expect roof / HVAC / electrical / plumbing capex.
Questions for the listing agent
- It's been on market 128 days. Have you received any prior offers? Is the seller open to a 12% concession, seller financing, or rate buy-down credit?
- Built in 1955 — when were the roof, HVAC, electrical panel, plumbing, and water heater last replaced?
- Why hasn't it sold? Are there any deal-killer items the seller is aware of (foundation, flood, title, zoning, code violations)?
- Is there a deadline driving the sale (1031 exchange, divorce, estate, relocation)? That informs how much negotiation room exists.
- Schools are D-rated, which usually means shorter tenancies and higher turnover. Who's the typical renter profile here, and what's been the actual vacancy rate?
- What's the average days-on-market for RENTAL listings here right now (not sales)? A rising rental-DOM trend means longer vacancies and softer asking-rent achievability than the comps imply.
- What's the recent tenant-quality profile in this submarket — average credit score on applications, eviction rate, late-payment / NSF rate, and stable-employment percentage? A property-management company in the area should have these aggregated.
- How much new for-sale + rental construction is in the pipeline within 1–3 miles? Heavy new supply typically softens prices + rents 12–24 months out; constrained supply supports both.
Investment metrics
- 1% rule
- 1.45% ✓
- Cap rate
- 12.14%
- Cash-on-cash
- 20.87%
- DSCR
- 1.93
- GRM
- 5.7
CMA / ARV
- ARV (median comp)
- $150,460
- List price
- $70,000
- Delta
- -53.48%
- Verdict
- UNDERPRICED
- Comps
- 20 within 1.0 mi
Show comp detail 12 sales within ~0.75 mi
| Address | Dist | Beds/Ba | Sqft | Sold | Price | $/sf | Match |
|---|---|---|---|---|---|---|---|
| 2601 Maple Dr | 0.30mi | 3/2.0 | 1,332 (+1%) | 5mo | $172,000 | $129 | 80 |
| 2302 I Ave | 0.45mi | 3/1.5 | 1,216 (-8%) | 6mo | $144,900 | $119 | 58 |
| 2514 S 23rd St | 0.41mi | 3/1.0 | 1,164 (-12%) | 2mo | $90,000 | $77 | 56 |
| 2537 S 23rd St | 0.47mi | 3/2.0 | 1,188 (-10%) | 13mo | $169,900 | $143 | 50 |
| 3031 Brentwood Rd | 0.69mi | 3/2.0 | 1,473 (+12%) | 2mo | $198,000 | $134 | 46 |
| 2721 Sunnyside Ave | 0.61mi | 2/1.0 (-1) | 1,300 (-2%) | 19mo | $85,000 | $65 | 44 |
| 2806 Greenview Ave | 0.53mi | 2/1.0 (-1) | 1,370 (+4%) | 21mo | $154,000 | $112 | 43 |
| 1213 S 25th St | 0.57mi | 2/1.0 (-1) | 1,284 (-3%) | 21mo | $109,000 | $85 | 42 |
| 2116 S 18th St | 0.65mi | 2/1.0 (-1) | 1,272 (-4%) | 15mo | $89,900 | $71 | 42 |
| 2202 S 19th St | 0.58mi | 3/1.0 | 1,200 (-9%) | 18mo | $126,000 | $105 | 39 |
| 1007 S 24th St | 0.73mi | 2/1.0 (-1) | 1,150 (-13%) | 6mo | $30,000 | $26 | 30 |
| 2403 C Ave | 0.74mi | 3/1.0 | 1,208 (-8%) | 21mo | $110,000 | $91 | 30 |
Match score weights: distance 35% · size 25% · config 20% · recency 20%. Top-matched comps best support the ARV.
Projected returns pro-forma
-3.0% appreciation · 4.59% rent growth · sell at horizon
- IRR
- 15.0%
- Equity multiple
- 1.61×
- Total profit
- $12,023
- Equity at exit
- $10,437
- IRR
- 24.8%
- Equity multiple
- 3.32×
- Total profit
- $45,437
- Equity at exit
- $6,052
Cash invested: $19,600 (down + closing). Projections, not guarantees.
Landlord ↔ Tenant lean methodology
- Overall (STATE)
- 90 Strongly Landlord-Friendly
- State Indiana
- 90 Strongly Landlord-Friendly · R+11
- County
- — inherits STATE
- City
- — inherits STATE
ZIP-level market 47362
- Home prices YoY
- -16.0%
- Rents YoY
- 4.6%
- Active inventory
- 217
- Price-to-rent
- 5.7×
Monthly cashflow live
- Estimated rent
- $1,016 medium interval (Pro) →
- Mortgage (P&I)
- −$367
- Tax from tax record
- −$66 /mo · $790/yr
- Insurance
- −$29
- HOA
- −$0
- Vacancy / Maint / Mgmt
- −$213
- Net cashflow
- $341
Break-even live
Sensitivity live
| Price | -10% $381 | -5% $361 | +0% $341 | +5% $321 | +10% $301 |
|---|---|---|---|---|---|
| Rent | -10% $261 | -5% $301 | +0% $341 | +5% $381 | +10% $421 |
| Rate | -1.0pp $376 | -0.5pp $359 | base $341 | +0.5pp $323 | +1.0pp $304 |
UW: 25.0% down · 7.5% · 30yr · 1.5% tax · 5.0% vac · 8.0% maint · 8.0% mgmt
Financing live
Cash to close
- Down payment
- $17,500
- Closing costs
- $2,100
- Reserves months
- —
- Total cash needed
- —
Loan-product check · same deal, 3 products live
Conventional
25% down · 7.5% · 30yr
- Down + closing
- —
- Monthly P&I
- —
- Monthly cashflow
- —
- DSCR
- —
- Eligible?
- —
Personal DTI + credit; lowest rate.
DSCR
20% down · 8.5% · 30yr
- Down + closing
- —
- Monthly P&I
- —
- Monthly cashflow
- —
- DSCR
- —
- Eligible?
- —
No personal income docs; deal must DSCR.
Hard money
10% down · 12.0% · 12mo
- Down + closing
- —
- Monthly P&I
- —
- Monthly cashflow
- —
- DSCR
- —
- Eligible?
- —
Short-term bridge; refi at stabilization.
Rent comps 3 comps
| Address | Beds | Baths | Sqft | Rent | $/sqft | DOM | Units | Dist |
|---|---|---|---|---|---|---|---|---|
| 1618 P Ave New Castle, IN | 3.0 | 1.5 | 1064 | $950 | $0.89 | 3d | 1 | 0.75mi |
| 940 S 15th St New Castle, IN | 1.0–2.0 | 1.0–1.5 | 816 | $1,075 | $1.32 | 0d | 2 | 1.09mi |
| 1519 A Ave New Castle, IN | 3.0 | 2.0 | 1790 | $855 | $0.48 | 45d | 1 | 1.17mi |
Listing history 29 events
-
2026-06-21days on market $70,000 Active 128 DOM
-
2026-06-19days on market $70,000 Active 126 DOM
-
2026-06-18price $70,000 Active 125 DOM
-
2026-06-18days on market $80,000 Active 125 DOM
-
2026-06-17days on market $80,000 Active 124 DOM
-
2026-06-16days on market $80,000 Active 123 DOM
-
2026-06-15days on market $80,000 Active 122 DOM
-
2026-06-14days on market $80,000 Active 120 DOM
-
2026-06-12days on market $80,000 Active 119 DOM
-
2026-06-09days on market $80,000 Active 116 DOM
-
2026-06-08days on market $80,000 Active 115 DOM
-
2026-06-07days on market $80,000 Active 114 DOM
-
2026-06-05days on market $80,000 Active 111 DOM
-
2026-06-03days on market $80,000 Active 110 DOM
-
2026-06-02days on market $80,000 Active 109 DOM
-
2026-06-01days on market $80,000 Active 108 DOM
-
2026-05-31days on market $80,000 Active 107 DOM
-
2026-05-30days on market $80,000 Active 106 DOM
-
2026-05-01price $80,000 619-char remark
Show marketing remark (619 chars)
Attention investors: Opportunity alert! This partially completed single family home presents a strong opportunity to control final costs and maximize returns. The property is currently at the drywall stage, with core construction and layout already completed - saving months of build time. With major structural and mechanical components in place, the remaining work centers on interior finishes and final installations, making this an efficient project for a flip or long-term rental strategy. The modern layout is designed to meet current buyer and tenant preferences, supporting solid resale and rental potential.
-
2026-03-16price $90,000 619-char remark
Show marketing remark (619 chars)
Attention investors: Opportunity alert! This partially completed single family home presents a strong opportunity to control final costs and maximize returns. The property is currently at the drywall stage, with core construction and layout already completed - saving months of build time. With major structural and mechanical components in place, the remaining work centers on interior finishes and final installations, making this an efficient project for a flip or long-term rental strategy. The modern layout is designed to meet current buyer and tenant preferences, supporting solid resale and rental potential.
-
2026-02-13$100,000 Active 619-char remark
Show marketing remark (619 chars)
Attention investors: Opportunity alert! This partially completed single family home presents a strong opportunity to control final costs and maximize returns. The property is currently at the drywall stage, with core construction and layout already completed - saving months of build time. With major structural and mechanical components in place, the remaining work centers on interior finishes and final installations, making this an efficient project for a flip or long-term rental strategy. The modern layout is designed to meet current buyer and tenant preferences, supporting solid resale and rental potential.
-
2022-05-10soldstatus $23,900
-
2022-05-06soldstatus $23,900 102-char remark
Show marketing remark (102 chars)
Large wooded lot with circular driveway. Former two car garage now interior square footage. Sold as-is
-
2022-03-19$24,900 102-char remark
Show marketing remark (102 chars)
Large wooded lot with circular driveway. Former two car garage now interior square footage. Sold as-is
-
2022-01-14$24,900
-
2015-08-12soldstatus $11,600
-
2015-04-15$21,000
-
2004-10-15soldstatus $10,500
-
2004-08-04$20,000
ⓘ Source: listings_history table (triggers on properties + properties_extension) + one-shot
backfill from property_details.listing_events for pre-trigger history.
Tax reassessment forecast IN · Partial reset (capped growth)
- Current annual tax
- $790 · $66/mo
- Projected year-2 tax
- $790 · $66/mo
- Expected delta
- $0/yr ($0/mo · 0.0%)
ⓘ Screening estimate from a state-policy table — verify with the county assessor before closing.
Climate risk First Street
- Flood 1/10 Low FEMA zone X (unshaded) · 0% chance over 30 yrs
- Wildfire 1/10 Low
- Heat 3/10 Moderate 7 d/yr ≥99°F today · 18 d/yr by 30 yrs out
- Wind 2/10 Low 100% chance of damaging wind over 30 yrs
- Air quality 2/10 Low 1 unhealthy d/yr today · 2 by 30 yrs out
Nearby sold comps map
Loading sold comps map…
Walkable amenities ~0.75 mi
Loading nearby amenities…
Taxation est. · year 1
- Rental income
- $12,197
- − Mortgage interest
- −$3,921
- − Property taxes
- −$790
- − Insurance
- −$350
- − Repairs & maintenance
- −$976
- − Management
- −$976
- − Depreciation
- −$2,036
- Taxable income
- $3,148
- Est. tax owed @ 24.0%
- −$756
- After-tax cash flow
- $3,335/yr
For passive investors: Depreciation is non-cash, so a rental often shows a tax loss while cash-flowing — sheltering income. Rental losses are passive: they offset passive income freely, and up to $25,000/yr can offset ordinary (W-2) income if you actively participate and your MAGI is under $100k (phasing out to $0 by $150k); unused losses carry forward. On sale, claimed depreciation is recaptured at up to 25%, and gains may owe capital-gains tax (a 1031 exchange can defer both). Figures are a year-1 estimate at your 24.0% rate — not tax advice; consult a CPA.
Schools (NCES district)
- District
- New Castle Community School Corporation
- NCES district ID
- 1807440
- Math proficiency
- 30% ▼ -13.00%
- Reading proficiency
- 35% ▼ -9.00%
- Median HH income
- $36,717
- Composite
- 26.99/100
- National rank
- #7067
- State rank
- #229 of 301 in IN
Livability — New Castle
- Score
- 75/100
- State rank
- #64
- US rank
- #4219
Category grades
Schools grade is shown separately in the Schools card above.
Census & demographics
- Census place
- New Castle, IN
- County
- Henry County · 29,337 people
- City population
- 29,337
- Metro
- New Castle, IN
- Population (ZIP)
- 29,337
- Household income
- $60,258
- Rent vs Own
- Severe rent burden
- 545.0
Population outlook (Henry County) Hauer SSP2
- Today (2025)
- 48,028 people
- By 2030
- 47,125 · -1.9%
- By 2040
- 44,820 · -6.7%
- By 2050
- 42,207 · -12.1%
- By 2075
- 35,814 · -25.4%
- By 2100
- 26,779 · -44.2%
Race, ethnicity, and origin ACS 2023
- Neighborhood character
- Predominantly White (90%)
- Race & ethnicity
- White 90% Two or more races 3% Black 3% Hispanic / Latino 3%
- Common ancestry
- Italian 2% Slovak 1% Lithuanian 1%
- Foreign-born
- 2% · Canada
- Languages at home
- 97% English-only · Spanish 2%
Political lean MEDSL · Henry
- 2024 margin
- Solid R (+47.7) · D 25.3% · R 73.0% · Other 1.7%
- 2008→2024 swing
- -43.8pp toward R · 2008: -3.9pp · 2024: -47.7pp
- All cycles
- 2024: R+47.7 2020: R+45.2 2016: R+43.7 2012: R+17.0 2008: R+3.9
Not yet ingested
- Civics
- —
Market trends
- HPI YoY
- ▼ -43.70%
- Current HPI
- 228.8885
- Rent YoY
- ▲ 4.59%
- Metro
- New Castle, IN
- State GDP YoY
- ▲ 2.90%
- F500 in state
- 18
Industry mix (Fortune 500 HQ in IN)
| Industry | F500 HQs | Revenue |
|---|---|---|
| Industrial Machinery | 2 | $37B |
|
||
| Healthcare | 1 | $177B |
|
||
| Pharmaceuticals | 1 | $45B |
|
||
| Metals / Steel | 1 | $18B |
|
||
| Agriculture | 1 | $17B |
|
||
| Packaging | 1 | $12B |
|
||
Price history
+300.0% since first listed11 events — show timeline
- 2026-05-01 Price Changed $80,000 MIBOR as Distributed by MLS Grid
- 2026-03-16 Price Changed $90,000 MIBOR as Distributed by MLS Grid
- 2026-02-13 Listed $100,000 MIBOR as Distributed by MLS Grid
- 2022-05-10 Sold (Public Records) $23,900 Public Records
- 2022-05-06 Sold (MLS) $23,900 MIBOR as Distributed by MLS Grid
- 2022-03-19 Listed $24,900 MIBOR as Distributed by MLS Grid
- 2022-01-14 Listed $24,900 IRMLS
- 2015-08-12 Sold (MLS) $11,600 MIBOR as Distributed by MLS Grid
- 2015-04-15 Listed $21,000 MIBOR as Distributed by MLS Grid
- 2004-10-15 Sold (MLS) $10,500 MIBOR as Distributed by MLS Grid
- 2004-08-04 Listed $20,000 MIBOR as Distributed by MLS Grid
Property tax history
-12.4%/yrLatest (2024): $790 · +7.9% YoY. Source: county tax records.
Cash-flow waterfall
monthlySold comps — $/sqft
last 12 mo · ≤1 miLoading sold comps…