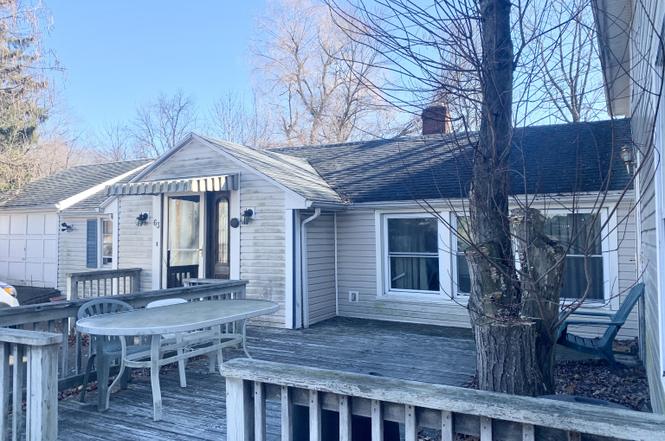
63 Sackett Point Rd · North Haven, CT
Flood risk No data
- FEMA flood zone
- —
- Chance of flooding over 30 yrs
- —
- Est. flood insurance / yr
- —
Fire risk No data
- Est. fire insurance / yr
- —
Heat risk No data
- Hot days now (above threshold)
- —
- Hot days in 30 yrs
- —
Wind risk No data
- Chance of severe wind over 30 yrs
- —
Air-quality risk No data
- Unhealthy air days now
- —
- Unhealthy air days in 30 yrs
- —
Risk factors via First Street. Map © Google.
Why this score? — see what drove the B- grade
The composite is a weighted blend of 9 inputs, each scored 0–100. Each bar is that input's sub-score; the figure is the points it added to the 100-point composite (weight × sub-score).
- Cash flow +24.7/30.0
- ARV discount +15.0/15.0
- DSCR +8.0/10.0
- 1% rule +7.0/10.0
- Schools +5.2/10.0
- Livability +3.9/5.0
- Rent growth +2.5/5.0
- Condition / age +2.5/5.0
- Appreciation +0.0/10.0
$289,000
🖨 Deal sheet (PDF) 📄 Offer letter ✓ Due diligence
Listing remarks
Single family home close to town with spacious bedrooms and living space. Plenty of storage and parking. Close to all forms of transportation, schools and shopping. SUBJECT TO PROBATE COURT APPROVAL. CASH or HARD MONEY ONLY! Come check it out today!!
Key facts
- 0.39 acre lot
- Built 1941
- Listed 18 days
Neighborhood map
What this means for you Summary
Snapshot
- This is a 4-bed/2.5-bath single-family listed at $289k.
Deal economics
- At list price, monthly cash flow is $607 ($7k/yr) — positive.
- The deal already cash-flows at list — no discount required.
- Meets the 1% rule at list price ($3k rent vs $289k).
- Recommended offer: $285k (1.5% below list) — sets the bar for market timing.
- Cap rate 8.8% vs local median 4.0% in North Haven — top-decile yield for the area; either an underpriced asset or a hidden risk that comps aren't pricing in. Stress-test before assuming the spread holds.
Location & tenants
- Location reads 78/100 on livability (#39 in CT, #2,723 nationally) — a middle-class / working-renter tenant base. Strengths: employment A+, housing A+, health & safety A+; Watch: amenities F, commute F, cost of living D-.
- North Haven School District (suburban): math 49% / reading 64% proficiency, ranked #55 of 153 in CT (top 36%) — acceptable for families but not a draw, mixed tenant base, ~2y average lease; only 8% free/reduced lunch — higher-income household profile.
- Zoned schools: North Haven Middle School (math 45% / reading 68%, grade B, #59 of 175 statewide, top 34%, 724 students, 22% FRL); North Haven High School (math 41% / reading 64%, grade C-, #79 of 194 statewide, top 40%, 921 students, 25% FRL) — zoned schools average 24% FRL vs 8% district-wide (15 pts higher); higher-poverty schools than district average — tighter screening recommended.
- Market conditions: 78 active listings in the ZIP; 3 comparable units currently listed for rent nearby; rentals at typical pace (median 21d on market — plan ~3-4 weeks tenant-placement turnaround); 1,059 units permitted in South Central Connecticut Planning Region in 2024 (779 in 5+ unit buildings).
Forward outlook
- Local home prices are declining (-3.0%/yr); year-one equity from $2k of loan paydown is wiped out by about $9k of value loss. Plan a longer hold.
Negotiation context
- It's been on market 18 days — a 2% lower offer ($285k) is reasonable based on typical stale-listing flexibility.
- 2 sale attempts with the ask held roughly flat each time — persistent listings suggest the price (not the market) is what's stuck; bring a comps-based counter.
Risks & watch-outs
- Watch-outs: built in 1941 — expect roof / HVAC / electrical / plumbing capex.
Questions for the listing agent
- Built in 1941 — when were the roof, HVAC, electrical panel, plumbing, and water heater last replaced?
- Is there a deadline driving the sale (1031 exchange, divorce, estate, relocation)? That informs how much negotiation room exists.
- Schools are A-rated — typically a magnet for longer-tenancy family renters. What's the average tenant stay here, and is there a school-zone premium baked into asking?
- What's the average days-on-market for RENTAL listings here right now (not sales)? A rising rental-DOM trend means longer vacancies and softer asking-rent achievability than the comps imply.
- What's the recent tenant-quality profile in this submarket — average credit score on applications, eviction rate, late-payment / NSF rate, and stable-employment percentage? A property-management company in the area should have these aggregated.
- How much new for-sale + rental construction is in the pipeline within 1–3 miles? Heavy new supply typically softens prices + rents 12–24 months out; constrained supply supports both.
Investment metrics
- 1% rule
- 1.20% ✓
- Cap rate
- 8.81%
- Cash-on-cash
- 9.00%
- DSCR
- 1.40
- GRM
- 6.9
CMA / ARV
- ARV (on-the-fly)
- $556,850
- Comps found
- 6
Show comp detail 6 sales within ~0.75 mi
| Address | Dist | Beds/Ba | Sqft | Sold | Price | $/sf | Match |
|---|---|---|---|---|---|---|---|
| 205 Maple Ave | 0.53mi | 3/2.5 (-1) | 2,614 (+1%) | 23mo | $685,000 | $262 | 50 |
| 10 Ball Rd | 0.75mi | 4/2.5 | 2,315 (-11%) | 1mo | $765,000 | $330 | 47 |
| 160 Spring Rd | 0.61mi | 3/2.5 (-1) | 2,808 (+8%) | 9mo | $541,000 | $193 | 45 |
| 122 Maple Ave | 0.67mi | 3/1.5 (-1) | 2,247 (-13%) | 2mo | $380,000 | $169 | 36 |
| 180 Manomet Ave | 0.66mi | 3/2.5 (-1) | 2,392 (-8%) | 22mo | $482,850 | $202 | 33 |
| 60 Tennyson Ave | 0.74mi | 4/2.0 | 2,280 (-12%) | 23mo | $490,000 | $215 | 24 |
Match score weights: distance 35% · size 25% · config 20% · recency 20%. Top-matched comps best support the ARV.
Projected returns pro-forma
-3.0% appreciation · 3.0% rent growth · sell at horizon
- IRR
- -2.6%
- Equity multiple
- 0.90×
- Total profit
- $-8,045
- Equity at exit
- $43,091
- IRR
- 7.1%
- Equity multiple
- 1.54×
- Total profit
- $43,316
- Equity at exit
- $24,987
Cash invested: $80,920 (down + closing). Projections, not guarantees.
Landlord ↔ Tenant lean methodology
- Overall (STATE)
- 27 Tenant-Leaning
- State Connecticut
- 27 Tenant-Leaning · D+7
- County
- — inherits STATE
- City
- — inherits STATE
ZIP-level market 06473
- Active inventory
- 78
- Price-to-rent
- 6.9×
Monthly cashflow live
- Estimated rent
- $3,470 medium interval (Pro) →
- Mortgage (P&I)
- −$1,516
- Tax from tax record
- −$498 /mo · $5,982/yr
- Insurance
- −$120
- HOA
- −$0
- Lot rent
- −$0
- Vacancy / Maint / Mgmt
- −$729
- Net cashflow
- $607
Break-even live
Sensitivity live
| Price | -10% $770 | -5% $689 | +0% $607 | +5% $525 | +10% $443 |
|---|---|---|---|---|---|
| Rent | -10% $333 | -5% $470 | +0% $607 | +5% $744 | +10% $881 |
| Rate | -1.0pp $752 | -0.5pp $680 | base $607 | +0.5pp $532 | +1.0pp $456 |
UW: 25.0% down · 7.5% · 30yr · 1.5% tax · 5.0% vac · 8.0% maint · 8.0% mgmt
Financing live
Cash to close
- Down payment
- $72,250
- Closing costs
- $8,670
- Reserves months
- —
- Total cash needed
- —
Loan-product check · same deal, 3 products live
Conventional
25% down · 7.5% · 30yr
- Down + closing
- —
- Monthly P&I
- —
- Monthly cashflow
- —
- DSCR
- —
- Eligible?
- —
Personal DTI + credit; lowest rate.
DSCR
20% down · 8.5% · 30yr
- Down + closing
- —
- Monthly P&I
- —
- Monthly cashflow
- —
- DSCR
- —
- Eligible?
- —
No personal income docs; deal must DSCR.
Hard money
10% down · 12.0% · 12mo
- Down + closing
- —
- Monthly P&I
- —
- Monthly cashflow
- —
- DSCR
- —
- Eligible?
- —
Short-term bridge; refi at stabilization.
Rent comps 3 comps
| Address | Beds | Baths | Sqft | Rent | $/sqft | DOM | Units | Dist |
|---|---|---|---|---|---|---|---|---|
| 52 Maple Ave North Haven, CT | 4.0 | 2.0 | 2162 | $3,200 | $1.48 | 46d | 1 | 0.98mi |
| 6 Lexington Gdns Unit NA North Haven, CT | 3.0 | 2.5 | 2590 | $4,295 | $1.66 | 5d | 1 | 1.11mi |
| 21 Saint John St Unit 1 North Haven, CT | 3.0 | 1.0 | 2832 | $2,750 | $0.97 | 21d | 1 | 1.28mi |
Listing history 5 events
-
2025-01-29status Under Contract
-
2025-01-27price $289,000
-
2025-01-27status Active
-
2025-01-23status Under Contract
-
2025-01-07$299,000 Active
ⓘ Source: listings_history table (triggers on properties + properties_extension) + one-shot
backfill from property_details.listing_events for pre-trigger history.
Tax reassessment forecast CT · Partial reset (capped growth)
- Current annual tax
- $5,982 · $498/mo
- Projected year-2 tax
- $6,083 · $507/mo
- Expected delta
- +$101/yr (+$8/mo · 1.7%)
ⓘ Screening estimate from a state-policy table — verify with the county assessor before closing.
Nearby sold comps map
Loading sold comps map…
Walkable amenities ~0.75 mi
Loading nearby amenities…
Taxation est. · year 1
- Rental income
- $41,640
- − Mortgage interest
- −$16,188
- − Property taxes
- −$5,982
- − Insurance
- −$1,445
- − Repairs & maintenance
- −$3,331
- − Management
- −$3,331
- − Depreciation
- −$8,407
- Taxable income
- $2,955
- Est. tax owed @ 24.0%
- −$709
- After-tax cash flow
- $6,573/yr
For passive investors: Depreciation is non-cash, so a rental often shows a tax loss while cash-flowing — sheltering income. Rental losses are passive: they offset passive income freely, and up to $25,000/yr can offset ordinary (W-2) income if you actively participate and your MAGI is under $100k (phasing out to $0 by $150k); unused losses carry forward. On sale, claimed depreciation is recaptured at up to 25%, and gains may owe capital-gains tax (a 1031 exchange can defer both). Figures are a year-1 estimate at your 24.0% rate — not tax advice; consult a CPA.
Schools (NCES district)
- District
- North Haven School District
- NCES district ID
- 0903030
- Math proficiency
- 49% ▼ -12.00%
- Reading proficiency
- 64% ▼ -8.00%
- Median HH income
- $85,727
- Composite
- 51.53/100
- National rank
- #1714
- State rank
- #55 of 153 in CT
Livability — North Haven
- Score
- 78/100
- State rank
- #39
- US rank
- #2723
Category grades
Schools grade is shown separately in the Schools card above.
Census & demographics
- Census place
- North Haven, CT
- City population
- 24,527
- Population (ZIP)
- 24,527
Population outlook (South Central Connecticut County) Hauer SSP2
- By 2040
- 608,362
Race, ethnicity, and origin ACS 2023
- Neighborhood character
- Predominantly White (79%)
- Race & ethnicity
- White 79% Hispanic / Latino 7% Asian 7% Two or more races 6% Black 4%
- Hispanic origin (detail)
- Mexican 1% Puerto Rican 4%
- Common ancestry
- Romanian 7% Lithuanian 2% Scotch-Irish 1%
- Foreign-born
- 11% · China, South Korea, Canada
- Languages at home
- 86% English-only · Other Indo-European 4% Spanish 3% Chinese 2%
Political lean MEDSL · South Central Connecticut
- 2024 margin
- Strong D (+20.1) · D 59.0% · R 38.9% · Other 2.1%
- All cycles
- 2024: D+20.1
Not yet ingested
- Civics
- —
Market trends
- HPI YoY
- ▼ -294.57%
- Current HPI
- 168.0717
- Rent YoY
- —
- Metro
- —
- State GDP YoY
- ▲ 1.06%
- F500 in state
- 38
Industry mix (Fortune 500 HQ in CT)
| Industry | F500 HQs | Revenue |
|---|---|---|
| Industrial Machinery | 4 | $38B |
|
||
| Insurance | 3 | $71B |
|
||
| Financial Services | 2 | $25B |
|
||
| Transportation / Logistics | 2 | $18B |
|
||
| Healthcare | 1 | $247B |
|
||
| Telecommunications | 1 | $55B |
|
||
Price history
-3.3% since first listed5 events — show timeline
- 2025-01-29 Pending — Smart MLS
- 2025-01-27 Price Changed $289,000 Smart MLS
- 2025-01-27 Relisted — Smart MLS
- 2025-01-23 Pending — Smart MLS
- 2025-01-07 Listed $299,000 Smart MLS
Property tax history
+0.5%/yrLatest (2023): $5,982 · +6.3% YoY. Source: county tax records.
Cash-flow waterfall
monthlySold comps — $/sqft
last 12 mo · ≤1 miLoading sold comps…