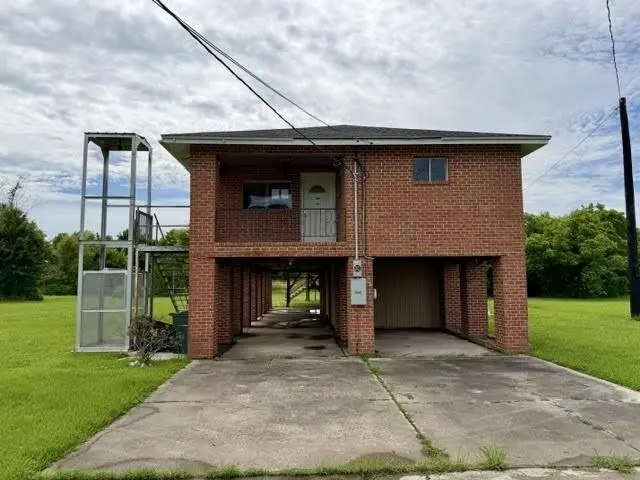
850 Crochetville Rd · Montegut, LA
Flood risk 9/10 · Severe
- FEMA flood zone
- AE
- Chance of flooding over 30 yrs
- 0.79%
- Est. flood insurance / yr
- $1,737 – $8,500
Fire risk 1/10 · Minimal
- Est. fire insurance / yr
- $1,269 – $2,357
Heat risk 9/10 · Severe
- Hot days now (above 107°F)
- 7 days/yr
- Hot days in 30 yrs
- 21 days/yr
Wind risk 9/10 · Severe
- Chance of severe wind over 30 yrs
- 99.0%
Air-quality risk 1/10 · Minimal
- Unhealthy air days now
- 0 days/yr
- Unhealthy air days in 30 yrs
- 0 days/yr
Risk factors via First Street. Map © Google.
Why this score? — see what drove the B+ grade
The composite is a weighted blend of 9 inputs, each scored 0–100. Each bar is that input's sub-score; the figure is the points it added to the 100-point composite (weight × sub-score).
- Cash flow +30.0/30.0
- 1% rule +10.0/10.0
- DSCR +10.0/10.0
- ARV discount +7.5/15.0
- Appreciation +6.9/10.0
- Livability +3.4/5.0
- Schools +3.3/10.0
- Rent growth +2.5/5.0
- Condition / age +2.5/5.0
$63,900
🖨 Deal sheet 📄 Offer letter ✓ Due diligence
Listing remarks MLS
HUD OWNED PROPERTY CASE # 221-642952. SOLD AS-IS WITH NO REPAIRS PRIOR TO CLOSING NO EXCEPTION. Go to www.HUDHOMESTORE.gov for more details or to see other HUD Owned properties. $100 down payment for eligible owner occupants using FHA financing. Spacious elevated brick home containing large under house covered parking and storage. Contains covered porch overlooking Bayou, screened patio, and exterior elevator. Open concept floor plan.
Key facts
- Covered porch
- Screened patio
- Covered parking
Tags
Property features AI
Exterior
- Parking: Carport
- Utilities: Public water; Septic tank sewer
- Home design: Residential single-family detached home
- Construction: Brick construction; Pillar/post/pier foundation; Built prior to or in existing records (year not provided)
- Exterior features: Shingle roof; Waterfront property on a river; Level topography/lot
Interior
- Bathrooms: 2 full bathrooms
- Heating & cooling: Central heating; Central air conditioning
- Interior features: Central heating; Central air conditioning
Neighborhood map
What this means for you Summary
Snapshot
- This is a 3-bed/2.0-bath single-family listed at $64k.
Deal economics
- At list price, monthly cash flow is $86 ($1k/yr) — positive.
- The deal already cash-flows at list — no discount required.
- Meets the 1% rule at list price ($1k rent vs $64k).
- Recommended offer: $63k (1.5% below list) — sets the bar for market timing.
Location & tenants
- Location reads 67/100 on livability (#110 in LA) — a middle-class / working-renter tenant base. Strengths: cost of living A+, housing A+, crime B; Watch: employment C-, amenities F, commute F.
- Terrebonne Parish (other): math 32% / reading 46% proficiency, ranked #23 of 98 in LA (top 24%) — families likely to look elsewhere, expect single-tenant / working-renter base with shorter leases; 62% free/reduced lunch — lower-income household profile, screen leases tightly.
- Market conditions: 42 active listings in the ZIP; 300 units permitted in Terrebonne Parish in 2024 (0 in 5+ unit buildings).
Forward outlook
- In year one you build about $3k of equity ($442 loan paydown + $2k appreciation (3.8% local appreciation)).
- At projected returns (3.8% appreciation + 3.0% rent growth), your $18k cash investment doubles in ~5 years — after that, you're playing with house money.
Negotiation context
- It's been on market 16 days — a 2% lower offer ($63k) is reasonable based on typical stale-listing flexibility.
- 3 sale attempts since 19y ago with the ask held roughly flat each time — persistent listings suggest the price (not the market) is what's stuck; bring a comps-based counter.
Risks & watch-outs
- Watch-outs: flood insurance adds $427/mo.
- Climate carrying-cost: in FEMA flood zone AE (mandatory federal flood insurance); severe wind risk, 99% chance of damaging wind over 30y; extreme-heat days projected 7→21/yr by 2055 (HVAC capex compounding) — expect insurance premiums to compound above CPI over the hold.
Questions for the listing agent
- Built in 1973 — when were the roof, HVAC, electrical panel, plumbing, and water heater last replaced?
- What's the actual annual flood-insurance premium (NFIP or private), and is the property in a SFHA with mandatory coverage?
- Is there a deadline driving the sale (1031 exchange, divorce, estate, relocation)? That informs how much negotiation room exists.
- Schools are B-rated — typically a magnet for longer-tenancy family renters. What's the average tenant stay here, and is there a school-zone premium baked into asking?
- What's the average days-on-market for RENTAL listings here right now (not sales)? A rising rental-DOM trend means longer vacancies and softer asking-rent achievability than the comps imply.
- What's the recent tenant-quality profile in this submarket — average credit score on applications, eviction rate, late-payment / NSF rate, and stable-employment percentage? A property-management company in the area should have these aggregated.
- How much new for-sale + rental construction is in the pipeline within 1–3 miles? Heavy new supply typically softens prices + rents 12–24 months out; constrained supply supports both.
Investment metrics
- 1% rule
- 1.88% ✓
- Cap rate
- 15.92%
- Cash-on-cash
- 34.37%
- DSCR
- 2.53
- GRM
- 4.4
CMA / ARV
No comps found within radius.
Projected returns pro-forma
3.75% appreciation · 3.0% rent growth · sell at horizon
- IRR
- 15.0%
- Equity multiple
- 1.90×
- Total profit
- $16,033
- Equity at exit
- $31,487
- IRR
- 16.4%
- Equity multiple
- 3.61×
- Total profit
- $46,704
- Equity at exit
- $50,785
Cash invested: $17,892 (down + closing). Projections, not guarantees.
Landlord ↔ Tenant lean methodology
- Overall (STATE)
- 90 Strongly Landlord-Friendly
- State Louisiana
- 90 Strongly Landlord-Friendly · R+12
- County
- — inherits STATE
- City
- — inherits STATE
ZIP-level market 70377
- Home prices YoY
- 3.6%
- Active inventory
- 42
- Price-to-rent
- 4.4×
Monthly cashflow live
- Estimated rent
- $1,204 medium interval (Pro) →
- Mortgage (P&I)
- −$335
- Tax from tax record
- −$77 /mo · $925/yr
- Insurance
- −$27
- Flood insurance flood zone
- −$427 /mo · $5,118/yr
- HOA
- −$0
- Vacancy / Maint / Mgmt
- −$253
- Net cashflow
- $86
Break-even live
UW: 25.0% down · 7.5% · 30yr · 1.5% tax · 5.0% vac · 8.0% maint · 8.0% mgmt
Financing live
Cash to close
- Down payment
- $15,975
- Closing costs
- $1,917
- Reserves months
- —
- Total cash needed
- —
Loan-product check · same deal, 3 products live
Conventional
25% down · 7.5% · 30yr
- Down + closing
- —
- Monthly P&I
- —
- Monthly cashflow
- —
- DSCR
- —
- Eligible?
- —
Personal DTI + credit; lowest rate.
DSCR
20% down · 8.5% · 30yr
- Down + closing
- —
- Monthly P&I
- —
- Monthly cashflow
- —
- DSCR
- —
- Eligible?
- —
No personal income docs; deal must DSCR.
Hard money
10% down · 12.0% · 12mo
- Down + closing
- —
- Monthly P&I
- —
- Monthly cashflow
- —
- DSCR
- —
- Eligible?
- —
Short-term bridge; refi at stabilization.
Listing history 13 events
-
2026-06-19days on market $63,900 Active 16 DOM
-
2026-06-18days on market $63,900 Active 15 DOM
-
2026-06-17days on market $63,900 Active 14 DOM
-
2026-06-16days on market $63,900 Active 13 DOM
-
2026-06-15days on market $63,900 Active 12 DOM
-
2026-06-14days on market $63,900 Active 10 DOM
-
2026-06-13days on market $63,900 Active 9 DOM
-
2026-06-10days on market $63,900 Active 7 DOM
-
2026-06-09days on market $63,900 Active 6 DOM
-
2026-06-08days on market $63,900 Active 5 DOM
-
2026-06-07days on market $63,900 Active 4 DOM
-
2026-06-05remarks 440-char remark
-
2026-06-05$63,900 Active 1 DOM
ⓘ Source: listings_history table (triggers on properties + properties_extension) + one-shot
backfill from property_details.listing_events for pre-trigger history.
Tax reassessment forecast LA · Resets to sale price
- Current annual tax
- $925 · $77/mo
- Projected year-2 tax
- $925 · $77/mo
- Expected delta
- $0/yr ($0/mo · 0.0%)
ⓘ Screening estimate from a state-policy table — verify with the county assessor before closing.
Climate risk First Street
- Flood 9/10 Extreme FEMA zone AE · 79% chance over 30 yrs
- Wildfire 1/10 Low
- Heat 9/10 Extreme 7 d/yr ≥107°F today · 21 d/yr by 30 yrs out
- Wind 9/10 Extreme 99% chance of damaging wind over 30 yrs
- Air quality 1/10 Low 0 unhealthy d/yr today · 0 by 30 yrs out
Nearby sold comps map
Loading sold comps map…
Walkable amenities ~0.75 mi
Loading nearby amenities…
Taxation est. · year 1
- Rental income
- $14,449
- − Mortgage interest
- −$3,579
- − Property taxes
- −$925
- − Insurance
- −$5,438
- − Repairs & maintenance
- −$1,156
- − Management
- −$1,156
- − Depreciation
- −$1,859
- Taxable income
- $336
- Est. tax owed @ 24.0%
- −$81
- After-tax cash flow
- $950/yr
For passive investors: Depreciation is non-cash, so a rental often shows a tax loss while cash-flowing — sheltering income. Rental losses are passive: they offset passive income freely, and up to $25,000/yr can offset ordinary (W-2) income if you actively participate and your MAGI is under $100k (phasing out to $0 by $150k); unused losses carry forward. On sale, claimed depreciation is recaptured at up to 25%, and gains may owe capital-gains tax (a 1031 exchange can defer both). Figures are a year-1 estimate at your 24.0% rate — not tax advice; consult a CPA.
Schools (NCES district)
- District
- Terrebonne Parish
- NCES district ID
- 2201740
- Math proficiency
- 32% ▼ -36.00%
- Reading proficiency
- 46% ▼ -30.00%
- Median HH income
- $47,612
- Composite
- 33.38/100
- National rank
- #5480
- State rank
- #23 of 98 in LA
Livability — Montegut
- Score
- 67/100
- State rank
- #110
- US rank
- #10885
Category grades
Schools grade is shown separately in the Schools card above.
Census & demographics
- Census place
- Montegut, LA
- Population (ZIP)
- 3,386
Population outlook (Terrebonne County) Hauer SSP2
- Today (2025)
- 118,724 people
- By 2030
- 120,321 · +1.3%
- By 2040
- 121,894 · +2.7%
- By 2050
- 121,119 · +2.0%
- By 2075
- 117,270 · -1.2%
- By 2100
- 107,544 · -9.4%
Race, ethnicity, and origin ACS 2023
- Neighborhood character
- Predominantly White (81%)
- Race & ethnicity
- White 81% Native American 14% Two or more races 3%
- Common ancestry
- Lithuanian 25% Serbian 2% Slovak 1%
- Foreign-born
- 2% · Canada
- Languages at home
- 87% English-only · French/Haitian/Cajun 13%
Political lean MEDSL · Terrebonne
- 2024 margin
- Solid R (+51.8) · D 23.5% · R 75.3% · Other 1.2%
- 2008→2024 swing
- -11.0pp toward R · 2008: -40.9pp · 2024: -51.8pp
- All cycles
- 2024: R+51.8 2020: R+50.0 2016: R+48.4 2012: R+41.2 2008: R+40.9
Not yet ingested
- Civics
- —
Market trends
- HPI YoY
- ▲ 3.75%
- Current HPI
- 108.1467
- Rent YoY
- —
- Metro
- —
- State GDP YoY
- ▲ 3.29%
- F500 in state
- 10
Industry mix (Fortune 500 HQ in LA)
| Industry | F500 HQs | Revenue |
|---|---|---|
| Telecommunications | 2 | $23B |
|
||
| Utilities | 1 | $12B |
|
||
| Wholesale / Distribution | 1 | $5B |
|
||
| Advertising | 1 | $2B |
|
||
Price history
+14.1% since first listed10 events — show timeline
- 2026-06-02 Listed $63,900 AcadianaMLS
- 2026-06-02 Listed $63,900 GBRMLS
- 2011-08-15 Sold (Public Records) $75,200 Public Records
- 2008-04-04 Sold (Public Records) $24,000 Public Records
- 2008-01-02 Sold (Public Records) — Public Records
- 2007-10-03 Listed $29,900 AcadianaMLS
- 2007-09-28 Sold (Public Records) — Public Records
- 2007-07-11 Sold (Public Records) — Public Records
- 2007-06-13 Sold (Public Records) — Public Records
- 1986-08-28 Sold (Public Records) $56,000 Public Records
Property tax history
+2.0%/yrLatest (2025): $925 · -1.5% YoY. Source: county tax records.
Cash-flow waterfall
monthlySold comps — $/sqft
last 12 mo · ≤1 miLoading sold comps…