 6-Plex
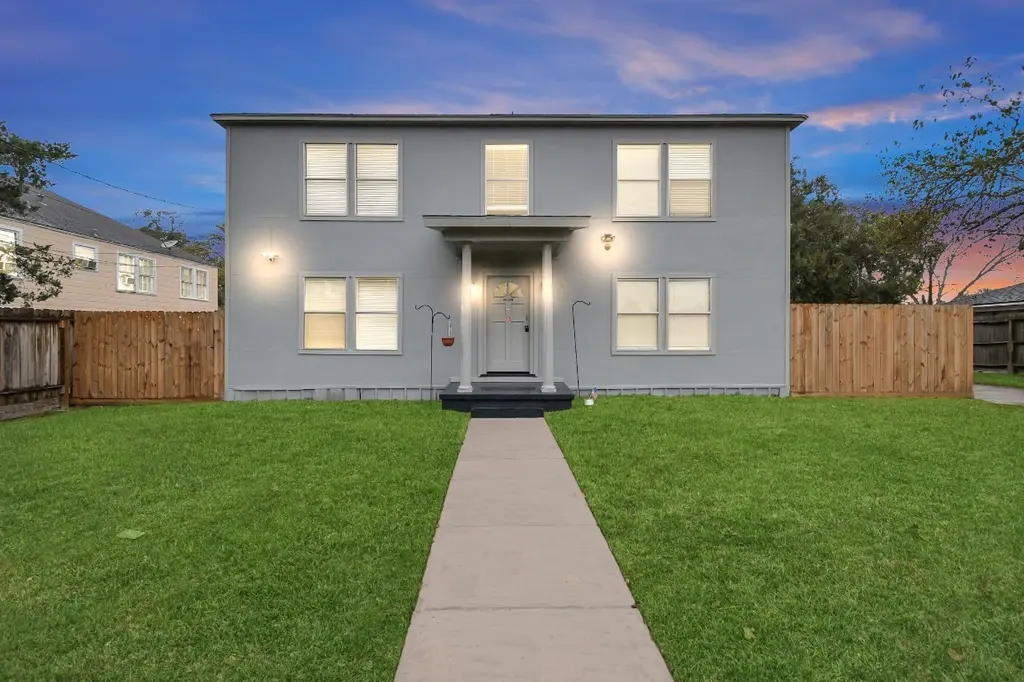
116 Marian St · Baytown, TX
Flood risk 1/10 · Minimal
- FEMA flood zone
- X (unshaded)
- Chance of flooding over 30 yrs
- 0.0%
- Est. flood insurance / yr
- $507 – $1,088
Fire risk 1/10 · Minimal
- Est. fire insurance / yr
- $1,222 – $2,270
Heat risk 10/10 · Severe
- Hot days now (above 110°F)
- 7 days/yr
- Hot days in 30 yrs
- 25 days/yr
Wind risk 9/10 · Severe
- Chance of severe wind over 30 yrs
- 99.0%
Air-quality risk 2/10 · Minimal
- Unhealthy air days now
- 1 days/yr
- Unhealthy air days in 30 yrs
- 2 days/yr
Risk factors via First Street. Map © Google.
Why this score? — see what drove the B+ grade
The composite is a weighted blend of 9 inputs, each scored 0–100. Each bar is that input's sub-score; the figure is the points it added to the 100-point composite (weight × sub-score).
- Cash flow +30.0/30.0
- ARV discount +11.7/15.0
- 1% rule +10.0/10.0
- DSCR +10.0/10.0
- Condition / age +4.0/5.0
- Livability +3.5/5.0
- Schools +3.2/10.0
- Rent growth +2.8/5.0
- Appreciation +0.0/10.0
$479,000
🖨 Deal sheet 📄 Offer letter ✓ Due diligence
Multi-family units
County records classify this as Multi-Family (5+ Unit). Listing-text estimate: 6 units. confirmed
5+ unit building — per-unit beds/baths from public records are typically unavailable; the breakdown below (if shown) is an estimate from the listing text.
Listing remarks MLS
Fantastic investment opportunity in Bay Town! This 6-unit apartment complex features updated units with appliances included. County valuation exceeds the asking price, highlighting its value. Long-term tenants, some for over four years. Ideal for oil and gas workers with prime location. Well-maintained property with on-site management, recently painted exteriors, and renovated interiors. Opportunity to convert and add two efficiency units in the existing building !! Drive-by only, do not disturb tenants. Approval required for viewing. Reach out for more details and rent rolls. Photos of Three units are attached
Key facts
- 0.25 acre lot
- Built 1950
- Listed 43 days
Neighborhood map
What this means for you Summary
Snapshot
- This is a 6 × 6-bed/6.0-bath units multifamily listed at $479k. Condition is rated good.
Deal economics
- At list price, monthly cash flow is $5k ($57k/yr) — positive. Per door: $789/mo.
- The deal already cash-flows at list — no discount required.
- Meets the 1% rule at list price ($10k rent vs $479k).
- Recommended offer: $465k (3.0% below list) — sets the bar for market timing.
- Cap rate 18.1% vs local median 4.2% in Baytown — top-decile yield for the area; either an underpriced asset or a hidden risk that comps aren't pricing in. Stress-test before assuming the spread holds.
Location & tenants
- Location reads 69/100 on livability (#412 in TX) — a middle-class / working-renter tenant base. Strengths: cost of living A+, housing A+; Watch: schools D+, employment D+, crime F.
- Goose Creek CISD (urban): math 37% / reading 36% proficiency, ranked #473 of 826 in TX (top 57%) — families likely to look elsewhere, expect single-tenant / working-renter base with shorter leases; 61% free/reduced lunch — lower-income household profile, screen leases tightly.
- Market conditions: Rents rising (+1.3%/yr); 271 active listings in the ZIP; 29,883 units permitted in Harris County in 2024 (8,621 in 5+ unit buildings).
- At $10,181/mo this rent would consume 225% of the median local household income ($54k/yr) (locally 1559% of renters already pay >50% of income on rent) — very limited rent-growth headroom before tenants either downsize or default.
Forward outlook
- Local home prices are declining (-3.0%/yr); year-one equity from $3k of loan paydown is wiped out by about $14k of value loss. Plan a longer hold.
- Harris County population projected at +47% by 2050 — long-run rental-demand tailwind backs the buy-and-hold thesis.
- At projected returns (-3.0% appreciation + 1.3% rent growth), your $134k cash investment doubles in ~3 years — after that, you're playing with house money.
Negotiation context
- It's been on market 43 days — a 3% lower offer ($465k) is reasonable based on typical stale-listing flexibility.
- 2 sale attempts since 2y ago with the ask held roughly flat each time — persistent listings suggest the price (not the market) is what's stuck; bring a comps-based counter.
Risks & watch-outs
- Watch-outs: built in 1950 — expect roof / HVAC / electrical / plumbing capex.
- Climate carrying-cost: severe wind risk, 99% chance of damaging wind over 30y; extreme-heat days projected 7→25/yr by 2055 (HVAC capex compounding) — expect insurance premiums to compound above CPI over the hold.
Questions for the listing agent
- It's been on market 43 days. Have you received any prior offers? Is the seller open to a 3% concession, seller financing, or rate buy-down credit?
- Can we see the unit-by-unit rent roll, current vacancy, and any below-market leases? What's the average tenancy length?
- What capital expenditures (roof, boiler, parking lot, exteriors) have been made in the last 5 years, and what's planned in the next 2?
- Built in 1950 — when were the roof, HVAC, electrical panel, plumbing, and water heater last replaced?
- Is there a deadline driving the sale (1031 exchange, divorce, estate, relocation)? That informs how much negotiation room exists.
- Schools are D-rated, which usually means shorter tenancies and higher turnover. Who's the typical renter profile here, and what's been the actual vacancy rate?
- Crime grade is F in this area — have there been break-ins, vandalism, or insurance claims at this property in the last 3 years? What carrier currently insures it and at what premium?
- What's the average days-on-market for RENTAL listings here right now (not sales)? A rising rental-DOM trend means longer vacancies and softer asking-rent achievability than the comps imply.
- What's the recent tenant-quality profile in this submarket — average credit score on applications, eviction rate, late-payment / NSF rate, and stable-employment percentage? A property-management company in the area should have these aggregated.
- How much new apartment / multifamily construction is in the pipeline within 1–3 miles? Heavy new supply (>2% of stock underway) typically softens rents 12–24 months out; light construction supports rent growth.
Investment metrics
- 1% rule
- 2.13% ✓
- Cap rate
- 18.15%
- Cash-on-cash
- 42.34%
- DSCR
- 2.88
- GRM
- 3.9
CMA / ARV
- ARV (median comp)
- $528,562
- List price
- $479,000
- Delta
- -9.38%
- Verdict
- FAIR
- Comps
- 2 within 1.0 mi
Projected returns pro-forma
-3.0% appreciation · 1.3% rent growth · sell at horizon
- IRR
- 37.1%
- Equity multiple
- 2.54×
- Total profit
- $206,840
- Equity at exit
- $71,420
- IRR
- 42.9%
- Equity multiple
- 4.74×
- Total profit
- $500,965
- Equity at exit
- $41,415
Cash invested: $134,120 (down + closing). Projections, not guarantees.
Landlord ↔ Tenant lean methodology
- Overall (STATE)
- 87 Strongly Landlord-Friendly
- State Texas
- 87 Strongly Landlord-Friendly · R+5
- County
- — inherits STATE
- City
- — inherits STATE
ZIP-level market 77520
- Rents YoY
- 1.3%
- Active inventory
- 271
- Price-to-rent
- 23.5×
Monthly cashflow live
- Estimated rent
- $10,181 medium interval (Pro) →
- Mortgage (P&I)
- −$2,512
- Tax est. 1.5%
- −$599 /mo · $7,185/yr
- Insurance
- −$200
- HOA
- −$0
- Vacancy / Maint / Mgmt
- −$2,138
- Net cashflow
- $4,733
Break-even live
6-unit breakdown (identical units grouped — click to expand)
| Units | Beds | Baths | Est. rent |
|---|---|---|---|
| 6× units | 6 | 6 | $10,182 |
| #1 | 6 | 6 | $1,697 |
| #2 | 6 | 6 | $1,697 |
| #3 | 6 | 6 | $1,697 |
| #4 | 6 | 6 | $1,697 |
| #5 | 6 | 6 | $1,697 |
| #6 | 6 | 6 | $1,697 |
| Total (6 units) | $10,181 | ||
UW: 25.0% down · 7.5% · 30yr · 1.5% tax · 5.0% vac · 8.0% maint · 8.0% mgmt
Financing live
Cash to close
- Down payment
- $119,750
- Closing costs
- $14,370
- Reserves months
- —
- Total cash needed
- —
Loan-product check · same deal, 3 products live
Conventional
25% down · 7.5% · 30yr
- Down + closing
- —
- Monthly P&I
- —
- Monthly cashflow
- —
- DSCR
- —
- Eligible?
- —
Personal DTI + credit; lowest rate.
DSCR
20% down · 8.5% · 30yr
- Down + closing
- —
- Monthly P&I
- —
- Monthly cashflow
- —
- DSCR
- —
- Eligible?
- —
No personal income docs; deal must DSCR.
Hard money
10% down · 12.0% · 12mo
- Down + closing
- —
- Monthly P&I
- —
- Monthly cashflow
- —
- DSCR
- —
- Eligible?
- —
Short-term bridge; refi at stabilization.
Listing history 15 events
-
2026-06-18days on market $479,000 Active 43 DOM
-
2026-06-17days on market $479,000 Active 42 DOM
-
2026-06-16days on market $479,000 Active 41 DOM
-
2026-06-15days on market $479,000 Active 40 DOM
-
2026-06-13days on market $479,000 Active 38 DOM
-
2026-06-09days on market $479,000 Active 34 DOM
-
2026-06-07days on market $479,000 Active 32 DOM
-
2026-06-04days on market $479,000 Active 29 DOM
-
2026-06-03days on market $479,000 Active 28 DOM
-
2026-06-02days on market $479,000 Active 27 DOM
-
2026-06-01days on market $479,000 Active 26 DOM
-
2026-05-31days on market $479,000 Active 25 DOM
-
2026-05-06$479,000 Active 620-char remark
Show marketing remark (620 chars)
Fantastic investment opportunity in Bay Town! This 6-unit apartment complex features updated units with appliances included. County valuation exceeds the asking price, highlighting its value. Long-term tenants, some for over four years. Ideal for oil and gas workers with prime location. Well-maintained property with on-site management, recently painted exteriors, and renovated interiors. Opportunity to convert and add two efficiency units in the existing building !! Drive-by only, do not disturb tenants. Approval required for viewing. Reach out for more details and rent rolls. Photos of Three units are attached
-
2025-09-02historical
-
2024-12-14$599,000 Active
ⓘ Source: listings_history table (triggers on properties + properties_extension) + one-shot
backfill from property_details.listing_events for pre-trigger history.
Climate risk First Street
- Flood 1/10 Low FEMA zone X (unshaded) · 0% chance over 30 yrs
- Wildfire 1/10 Low
- Heat 10/10 Extreme 7 d/yr ≥110°F today · 25 d/yr by 30 yrs out
- Wind 9/10 Extreme 99% chance of damaging wind over 30 yrs
- Air quality 2/10 Low 1 unhealthy d/yr today · 2 by 30 yrs out
Nearby sold comps map
Loading sold comps map…
Walkable amenities ~0.75 mi
Loading nearby amenities…
Taxation est. · year 1
- Rental income
- $122,172
- − Mortgage interest
- −$26,831
- − Property taxes
- −$7,185
- − Insurance
- −$2,395
- − Repairs & maintenance
- −$9,774
- − Management
- −$9,774
- − Depreciation
- −$13,935
- Taxable income
- $52,278
- Est. tax owed @ 24.0%
- −$12,547
- After-tax cash flow
- $44,246/yr
For passive investors: Depreciation is non-cash, so a rental often shows a tax loss while cash-flowing — sheltering income. Rental losses are passive: they offset passive income freely, and up to $25,000/yr can offset ordinary (W-2) income if you actively participate and your MAGI is under $100k (phasing out to $0 by $150k); unused losses carry forward. On sale, claimed depreciation is recaptured at up to 25%, and gains may owe capital-gains tax (a 1031 exchange can defer both). Figures are a year-1 estimate at your 24.0% rate — not tax advice; consult a CPA.
Condition & rehab AI · 12 photos
This 6-unit apartment complex in Baytown, TX, is in good condition with recent updates and renovations. It offers a great investment opportunity with potential for expansion and improvements.
Value-add opportunities
- Both Painting exterior and interior walls — Enhances curb appeal and interior aesthetics.
- Both Landscaping improvements — Enhances curb appeal and adds value to the property.
- Both Addition of two efficiency units — Expands rental potential and increases income stream.
- Both Upgrading HVAC system — Improves comfort and energy efficiency, attracting tenants and buyers.
- Both Kitchen and bathroom updates — Modernizes spaces and enhances functionality, attracting tenants and buyers.
Renovation cost estimate screening
Value-add ROI direction
- Both Painting exterior and interior walls — Enhances curb appeal and interior aesthetics. ↑
- Both Landscaping improvements — Enhances curb appeal and adds value to the property. ↑
- Both Addition of two efficiency units — Expands rental potential and increases income stream. ↑
- Both Upgrading HVAC system — Improves comfort and energy efficiency, attracting tenants and buyers. ↑
- Both Kitchen and bathroom updates — Modernizes spaces and enhances functionality, attracting tenants and buyers. ↑
ⓘ Cost ranges are severity-bucket heuristics (US national rule-of-thumb). Get contractor quotes + a written scope before underwriting a rehab budget.
Schools (NCES district)
- District
- Goose Creek CISD
- NCES district ID
- 4821150
- Math proficiency
- 37% ▼ -11.00%
- Reading proficiency
- 36% ▼ -4.00%
- Median HH income
- $52,468
- Composite
- 31.84/100
- National rank
- #5877
- State rank
- #473 of 826 in TX
Livability — Baytown
- Score
- 69/100
- State rank
- #412
- US rank
- #8494
Category grades
Schools grade is shown separately in the Schools card above.
Census & demographics
- Census place
- Baytown, TX
- County
- Harris County · 4,702,590 people
- City population
- 135,579
- Metro
- Houston-The Woodlands-Sugar Land, TX
- Population (ZIP)
- 36,355
- Household income
- $54,278
- Rent vs Own
- Severe rent burden
- 1559.0
Population outlook (Harris County) Hauer SSP2
- Today (2025)
- 5,571,493 people
- By 2030
- 6,089,821 · +9.3%
- By 2040
- 7,142,806 · +28.2%
- By 2050
- 8,185,864 · +46.9%
- By 2075
- 10,574,329 · +89.8%
- By 2100
- 12,109,958 · +117.4%
Race, ethnicity, and origin ACS 2023
- Neighborhood character
- Diverse neighborhood (Simpson 0.60)
- Race & ethnicity
- Hispanic / Latino 55% White 30% Two or more races 19% Black 10% Asian 2%
- Hispanic origin (detail)
- Mexican 48%
- Common ancestry
- Italian 1% Lithuanian 1% Romanian 1%
- Foreign-born
- 21% · Canada, Vietnam
- Languages at home
- 55% English-only · Spanish 43% Other Asian/Pacific 1% Other Indo-European 1%
Political lean MEDSL · Harris
- 2024 margin
- Lean D (+5.5) · D 52.0% · R 46.4% · Other 1.6%
- 2008→2024 swing
- +3.9pp toward D · 2008: 1.6pp · 2024: 5.5pp
- All cycles
- 2024: D+5.5 2020: D+13.3 2016: D+12.4 2012: D+0.1 2008: D+1.6
Not yet ingested
- Civics
- —
Market trends
- HPI YoY
- ▼ -143.36%
- Current HPI
- 262.066
- Rent YoY
- ▲ 1.30%
- Metro
- Houston-The Woodlands-Sugar Land, TX
- State GDP YoY
- ▲ 3.95%
- F500 in state
- 110
Industry mix (Fortune 500 HQ in TX)
| Industry | F500 HQs | Revenue |
|---|---|---|
| Energy | 16 | $1,198B |
|
||
| Technology | 5 | $198B |
|
||
| Engineering / Construction | 4 | $72B |
|
||
| Energy Services | 3 | $60B |
|
||
| Utilities | 3 | $41B |
|
||
| Healthcare | 2 | $330B |
|
||
Price history
-20.0% since first listed3 events — show timeline
- 2026-05-06 Listed $479,000 HARMLS
- 2025-09-02 Listing Removed — HARMLS
- 2024-12-14 Listed $599,000 HARMLS
Cash-flow waterfall
monthlySold comps — $/sqft
last 12 mo · ≤1 miLoading sold comps…