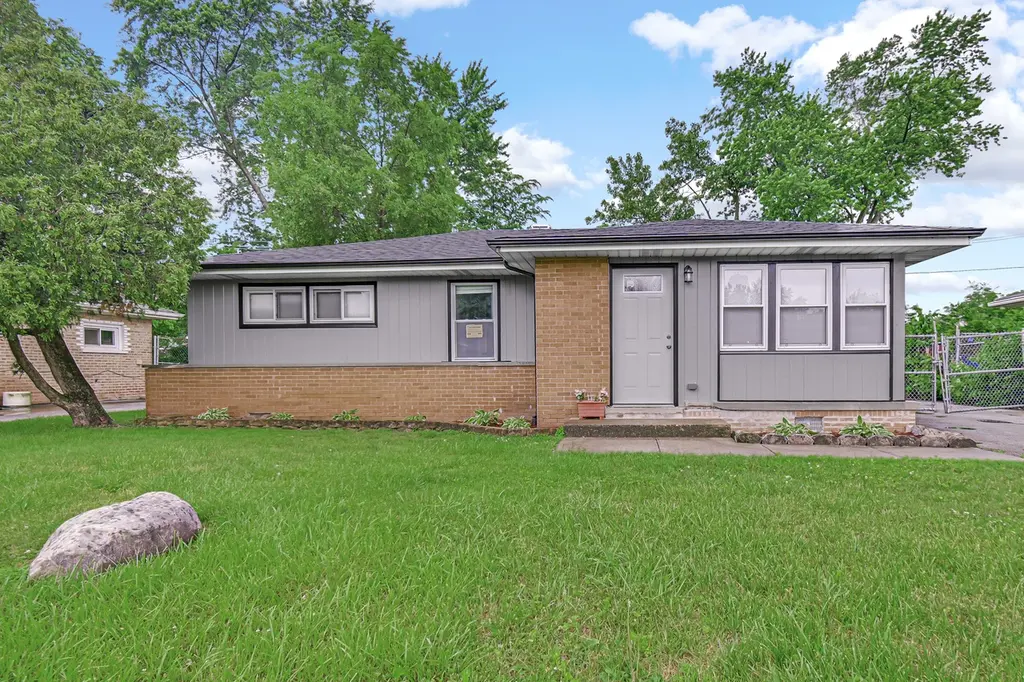
16158 Plymouth Dr · Markham, IL
Flood risk 1/10 · Minimal
- FEMA flood zone
- X (unshaded)
- Chance of flooding over 30 yrs
- 0.0%
- Est. flood insurance / yr
- $473 – $860
Fire risk 1/10 · Minimal
- Est. fire insurance / yr
- $804 – $1,492
Heat risk 3/10 · Minor
- Hot days now (above 101°F)
- 7 days/yr
- Hot days in 30 yrs
- 15 days/yr
Wind risk 2/10 · Minimal
- Chance of severe wind over 30 yrs
- —
Air-quality risk 3/10 · Minor
- Unhealthy air days now
- 4 days/yr
- Unhealthy air days in 30 yrs
- 4 days/yr
Risk factors via First Street. Map © Google.
Why this score? — see what drove the C grade
The composite is a weighted blend of 9 inputs, each scored 0–100. Each bar is that input's sub-score; the figure is the points it added to the 100-point composite (weight × sub-score).
- Cash flow +22.2/30.0
- Appreciation +10.0/10.0
- DSCR +7.1/10.0
- 1% rule +5.6/10.0
- Livability +3.8/5.0
- Rent growth +2.5/5.0
- Condition / age +2.5/5.0
- Schools +1.5/10.0
- ARV discount +0.0/15.0
$219,999
🖨 Deal sheet (PDF) 📄 Offer letter ✓ Due diligence
Listing remarks
This Newly Constructed, 3 Bedroom Ranch, with Charming Curb Appeal is Ready For One Lucky Buyer to Call Home! Rebuilt from the Ground Up, Enjoy Peace of Mind with Brand New Roof, All New Windows, New Doors, New Electric, New Plumbing, Brand New HVAC, Brand New Hot Water Heater, New Air Ducts, New Custom Kitchen with Stylish Quartz Countertops and Built in Breakfast Bar, with Stainless Steel Appliances. Enjoy a New Custom Bath with Stylish Iron Lighting and Faux Marble Tile. The 2nd Half Bath has been added for Convenience! Enjoy the additional Laundry, Outdoor Storage Shed, and Fully Fenced In Yard to Round Out This Homes Beautiful Features! Custom Light Fixtures throughout and Featured on
Key facts
- New plumbing
- New doors
- New hvac
Tags
Property features AI
Finance
- Other: Lot dimensions approximately 40 x 180; Lot size less than 0.25 acre
- HOA & community: No master association fees required
Exterior
- Parking: Three parking spaces; Asphalt driveway/parking
- Utilities: Water source: Lake Michigan; Public sewer
- Home design: Detached single-family home; One-story; Fee simple ownership; Rebuilt/rehab completed in 2026
- Construction: Brick construction; Asphalt roof; Built roughly 61–70 years ago; Built before 1978
- Exterior features: School bus service; Interstate access
Interior
- Kitchen: Kitchen on main level (17 x 10) with luxury vinyl flooring
- Bedrooms: Master bedroom on main level (13 x 11) with hardwood flooring; Bedroom on main level (12 x 11) with hardwood flooring; Bedroom on main level (11 x 10) with hardwood flooring
- Flooring: Hardwood flooring in living areas and bedrooms; Luxury vinyl flooring in kitchen and laundry
- Bathrooms: One full bathroom; One half bathroom
- Heating & cooling: Natural gas heating; Central air conditioning
- Interior features: First-floor bedroom; Five total rooms
- Laundry & utility: Main-level laundry (4 x 7) with luxury vinyl flooring
Neighborhood map
What this means for you Summary
Snapshot
- This is a 3-bed/1.0-bath single-family listed at $220k.
Deal economics
- At list price, monthly cash flow is $358 ($4k/yr) — positive.
- The deal already cash-flows at list — no discount required.
- Meets the 1% rule at list price ($2k rent vs $220k).
Location & tenants
- Location reads 76/100 on livability (#186 in IL, #3,539 nationally) — a middle-class / working-renter tenant base. Strengths: commute A+, cost of living A+, housing A+; Watch: crime D, amenities D, employment D.
- Bremen Chsd 228 (suburban): math 15% / reading 17% proficiency, ranked #468 of 620 in IL (top 76%) — low school quality limits family demand, transient renter base, plan for 1-2y turnover.
- Zoned schools: Highlands Elem School (math 8% / reading 12%, grade F, #1,517 of 2,056 statewide, top 78%, 327 students, 0% FRL); Prairie-Hills Junior High School (math 7% / reading 10%, grade F, #605 of 665 statewide, top 91%, 825 students, 0% FRL); Hillcrest High School (math 4% / reading 4%, grade F, #657 of 693 statewide, top 95%, 1,314 students, 0% FRL).
- Market conditions: 66 active listings in the ZIP; 7 comparable units currently listed for rent nearby; rentals leasing fast (median 0d on market — plan ~1-2 weeks tenant-placement turnaround); 6,272 units permitted in Cook County in 2024 (4,658 in 5+ unit buildings).
Forward outlook
- In year one you build about $24k of equity ($2k loan paydown + $22k appreciation (10.0% local appreciation)).
- At projected returns (10.0% appreciation + 3.0% rent growth), your $62k cash investment doubles in ~3 years — after that, you're playing with house money.
- By year 2, paydown + projected appreciation supports a ~$38k cash-out refi (75% LTV) — recoverable capital for the next deal without selling this one.
Negotiation context
- Only 3 days on market — expect competitive offers; lowballing is unlikely to land.
Risks & watch-outs
- Watch-outs: built in 1957 — expect roof / HVAC / electrical / plumbing capex.
Questions for the listing agent
- Built in 1957 — when were the roof, HVAC, electrical panel, plumbing, and water heater last replaced?
- Is there a deadline driving the sale (1031 exchange, divorce, estate, relocation)? That informs how much negotiation room exists.
- Schools are F-rated, which usually means shorter tenancies and higher turnover. Who's the typical renter profile here, and what's been the actual vacancy rate?
- Crime grade is D in this area — have there been break-ins, vandalism, or insurance claims at this property in the last 3 years? What carrier currently insures it and at what premium?
- What's the average days-on-market for RENTAL listings here right now (not sales)? A rising rental-DOM trend means longer vacancies and softer asking-rent achievability than the comps imply.
- What's the recent tenant-quality profile in this submarket — average credit score on applications, eviction rate, late-payment / NSF rate, and stable-employment percentage? A property-management company in the area should have these aggregated.
- How much new for-sale + rental construction is in the pipeline within 1–3 miles? Heavy new supply typically softens prices + rents 12–24 months out; constrained supply supports both.
Investment metrics
- 1% rule
- 1.06% ✓
- Cap rate
- 8.25%
- Cash-on-cash
- 6.98%
- DSCR
- 1.31
- GRM
- 7.8
CMA / ARV
- ARV (on-the-fly)
- $158,587
- Comps found
- 12
Show comp detail 12 sales within ~0.75 mi
| Address | Dist | Beds/Ba | Sqft | Sold | Price | $/sf | Match |
|---|---|---|---|---|---|---|---|
| 16165 Oxford Dr | 0.15mi | 3/1.0 | 1,061 (-4%) | 3mo | $154,900 | $146 | 83 |
| 16309 Plymouth Dr | 0.17mi | 3/1.0 | 1,051 (-5%) | 2mo | $170,000 | $162 | 82 |
| 2926 Sussex Ave | 0.21mi | 3/1.0 | 1,048 (-6%) | 2mo | $129,900 | $124 | 80 |
| 16364 California Ave | 0.26mi | 3/1.5 | 1,133 (+2%) | 5mo | $160,000 | $141 | 78 |
| 2956 Sherwood Ave | 0.32mi | 3/1.0 | 1,048 (-6%) | 5mo | $149,900 | $143 | 72 |
| 3027 Wilshire Ave | 0.30mi | 3/1.0 | 1,025 (-8%) | 3mo | $155,000 | $151 | 71 |
| 16358 Plymouth Dr | 0.25mi | 3/1.0 | 993 (-10%) | 2mo | $138,999 | $140 | 69 |
| 16155 Kedzie Pkwy | 0.47mi | 3/1.0 | 1,048 (-6%) | 1mo | $215,000 | $205 | 68 |
| 16614 Plymouth Dr | 0.54mi | 3/1.5 | 1,117 (+1%) | 5mo | $75,000 | $67 | 68 |
| 3048 Sherwood Ave | 0.38mi | 2/1.0 (-1) | 1,048 (-6%) | 2mo | $161,000 | $154 | 66 |
| 2732 Circle Dr | 0.25mi | 3/1.5 | 1,269 (+14%) | 3mo | $125,000 | $99 | 59 |
| 16501 Oxford Dr S | 0.41mi | 3/1.0 | 975 (-12%) | 3mo | $105,000 | $108 | 58 |
Match score weights: distance 35% · size 25% · config 20% · recency 20%. Top-matched comps best support the ARV.
Projected returns pro-forma
10.0% appreciation · 3.0% rent growth · sell at horizon
- IRR
- 29.4%
- Equity multiple
- 3.32×
- Total profit
- $142,659
- Equity at exit
- $198,193
- IRR
- 25.5%
- Equity multiple
- 7.53×
- Total profit
- $402,187
- Equity at exit
- $427,410
Cash invested: $61,600 (down + closing). Projections, not guarantees.
Landlord ↔ Tenant lean methodology
- Overall (STATE)
- 43 Moderately Tenant-Leaning
- State Illinois
- 43 Moderately Tenant-Leaning · D+7
- County
- — inherits STATE
- City
- — inherits STATE
ZIP-level market 60428
- Home prices YoY
- 8.5%
- Active inventory
- 66
- Price-to-rent
- 7.8×
Monthly cashflow live
- Estimated rent
- $2,337 high interval (Pro) →
- Mortgage (P&I)
- −$1,154
- Tax from tax record
- −$242 /mo · $2,908/yr
- Insurance
- −$92
- HOA
- −$0
- Vacancy / Maint / Mgmt
- −$491
- Net cashflow
- $358
Break-even live
Sensitivity live
| Price | -10% $483 | -5% $421 | +0% $358 | +5% $296 | +10% $234 |
|---|---|---|---|---|---|
| Rent | -10% $174 | -5% $266 | +0% $358 | +5% $451 | +10% $543 |
| Rate | -1.0pp $469 | -0.5pp $414 | base $358 | +0.5pp $301 | +1.0pp $243 |
UW: 25.0% down · 7.5% · 30yr · 1.5% tax · 5.0% vac · 8.0% maint · 8.0% mgmt
Financing live
Cash to close
- Down payment
- $55,000
- Closing costs
- $6,600
- Reserves months
- —
- Total cash needed
- —
Loan-product check · same deal, 3 products live
Conventional
25% down · 7.5% · 30yr
- Down + closing
- —
- Monthly P&I
- —
- Monthly cashflow
- —
- DSCR
- —
- Eligible?
- —
Personal DTI + credit; lowest rate.
DSCR
20% down · 8.5% · 30yr
- Down + closing
- —
- Monthly P&I
- —
- Monthly cashflow
- —
- DSCR
- —
- Eligible?
- —
No personal income docs; deal must DSCR.
Hard money
10% down · 12.0% · 12mo
- Down + closing
- —
- Monthly P&I
- —
- Monthly cashflow
- —
- DSCR
- —
- Eligible?
- —
Short-term bridge; refi at stabilization.
Rent comps 7 comps
| Address | Beds | Baths | Sqft | Rent | $/sqft | DOM | Units | Dist |
|---|---|---|---|---|---|---|---|---|
| 16752 Artesian Ave Hazel Crest, IL | 3.0 | 1.0 | 867 | $2,500 | $2.88 | 0d | 1 | 0.87mi |
| 16751 Crane Ave Hazel Crest, IL | 3.0 | 1.0 | 1200 | $1,800 | $1.50 | 0d | 1 | 1.03mi |
| 16901 Orchard Ridge Ave Hazel Crest, IL | 4.0 | 2.0 | 1406 | $2,700 | $1.92 | 0d | 1 | 1.10mi |
| 2308 170th St Hazel Crest, IL | 3.0 | 2.0 | 1020 | $2,400 | $2.35 | 0d | 1 | 1.20mi |
| 2173 171st St Hazel Crest, IL | 3.0 | 1.5 | 1159 | $2,350 | $2.03 | 0d | 1 | 1.42mi |
| 16125 Marshfield Ave Markham, IL | 3.0 | 1.0 | 1043 | $2,400 | $2.30 | 0d | 1 | 1.46mi |
| 2107 171st St Unit 2107 Hazel Crest, IL | 3.0 | 1.5 | 1158 | $2,300 | $1.99 | 0d | 1 | 1.48mi |
Listing history 3 events
-
2026-06-21days on market $219,999 Active 3 DOM
-
2026-06-18remarks 699-char remark
-
2026-06-18$219,999 Active 1 DOM
ⓘ Source: listings_history table (triggers on properties + properties_extension) + one-shot
backfill from property_details.listing_events for pre-trigger history.
Tax reassessment forecast IL · Partial reset (capped growth)
- Current annual tax
- $2,908 · $242/mo
- Projected year-2 tax
- $3,951 · $329/mo
- Expected delta
- +$1,043/yr (+$87/mo · 35.9%)
ⓘ Screening estimate from a state-policy table — verify with the county assessor before closing.
Climate risk First Street
- Flood 1/10 Low FEMA zone X (unshaded) · 0% chance over 30 yrs
- Wildfire 1/10 Low
- Heat 3/10 Moderate 7 d/yr ≥101°F today · 15 d/yr by 30 yrs out
- Wind 2/10 Low
- Air quality 3/10 Moderate 4 unhealthy d/yr today · 4 by 30 yrs out
Nearby sold comps map
Loading sold comps map…
Walkable amenities ~0.75 mi
Loading nearby amenities…
Taxation est. · year 1
- Rental income
- $28,042
- − Mortgage interest
- −$12,323
- − Property taxes
- −$2,908
- − Insurance
- −$1,100
- − Repairs & maintenance
- −$2,243
- − Management
- −$2,243
- − Depreciation
- −$6,400
- Taxable income
- $824
- Est. tax owed @ 24.0%
- −$198
- After-tax cash flow
- $4,103/yr
For passive investors: Depreciation is non-cash, so a rental often shows a tax loss while cash-flowing — sheltering income. Rental losses are passive: they offset passive income freely, and up to $25,000/yr can offset ordinary (W-2) income if you actively participate and your MAGI is under $100k (phasing out to $0 by $150k); unused losses carry forward. On sale, claimed depreciation is recaptured at up to 25%, and gains may owe capital-gains tax (a 1031 exchange can defer both). Figures are a year-1 estimate at your 24.0% rate — not tax advice; consult a CPA.
Schools (NCES district)
- District
- Bremen Chsd 228
- NCES district ID
- 1707050
- Math proficiency
- 15% ▼ -4.00%
- Reading proficiency
- 17% ▼ -5.00%
- Median HH income
- $57,625
- Composite
- 15.32/100
- National rank
- #9327
- State rank
- #468 of 620 in IL
Livability — Markham
- Score
- 76/100
- State rank
- #186
- US rank
- #3539
Category grades
Schools grade is shown separately in the Schools card above.
Census & demographics
- Census place
- Markham, IL
- City population
- 10,980
- Population (ZIP)
- 10,980
Population outlook (Cook County) Hauer SSP2
- Today (2025)
- 5,347,519 people
- By 2030
- 5,357,703 · +0.2%
- By 2040
- 5,324,924 · -0.4%
- By 2050
- 5,230,762 · -2.2%
- By 2075
- 4,785,735 · -10.5%
- By 2100
- 4,188,836 · -21.7%
Race, ethnicity, and origin ACS 2023
- Neighborhood character
- Predominantly Black (69%)
- Race & ethnicity
- Black 69% Hispanic / Latino 17% White 11% Two or more races 4%
- Hispanic origin (detail)
- Mexican 16%
- Common ancestry
- Romanian 1% Lithuanian 1% Iranian 1%
- Foreign-born
- 8% · Canada
- Languages at home
- 86% English-only · Spanish 14%
Political lean MEDSL · Cook
- 2024 margin
- Solid D (+42.0) · D 70.4% · R 28.4% · Other 1.2%
- 2008→2024 swing
- -11.4pp toward R · 2008: 53.4pp · 2024: 42.0pp
- All cycles
- 2024: D+42.0 2020: D+50.3 2016: D+53.0 2012: D+49.4 2008: D+53.4
Not yet ingested
- Civics
- —
Market trends
- HPI YoY
- ▲ 23.63%
- Current HPI
- 302.333
- Rent YoY
- —
- Metro
- —
- State GDP YoY
- ▲ 1.59%
- F500 in state
- 60
Industry mix (Fortune 500 HQ in IL)
| Industry | F500 HQs | Revenue |
|---|---|---|
| Insurance | 4 | $201B |
|
||
| Consumer Goods | 4 | $87B |
|
||
| Industrial Machinery | 3 | $64B |
|
||
| Healthcare | 2 | $55B |
|
||
| Retail / Pharmacy | 1 | $148B |
|
||
| Agriculture / Food | 1 | $86B |
|
||
Price history
1 event — show timeline
- 2026-06-17 Listed $219,999 MRED as Distributed by MLS Grid
Property tax history
+7.2%/yrLatest (2023): $2,908 · +33245.1% YoY. Source: county tax records.
Cash-flow waterfall
monthlySold comps — $/sqft
last 12 mo · ≤1 miLoading sold comps…