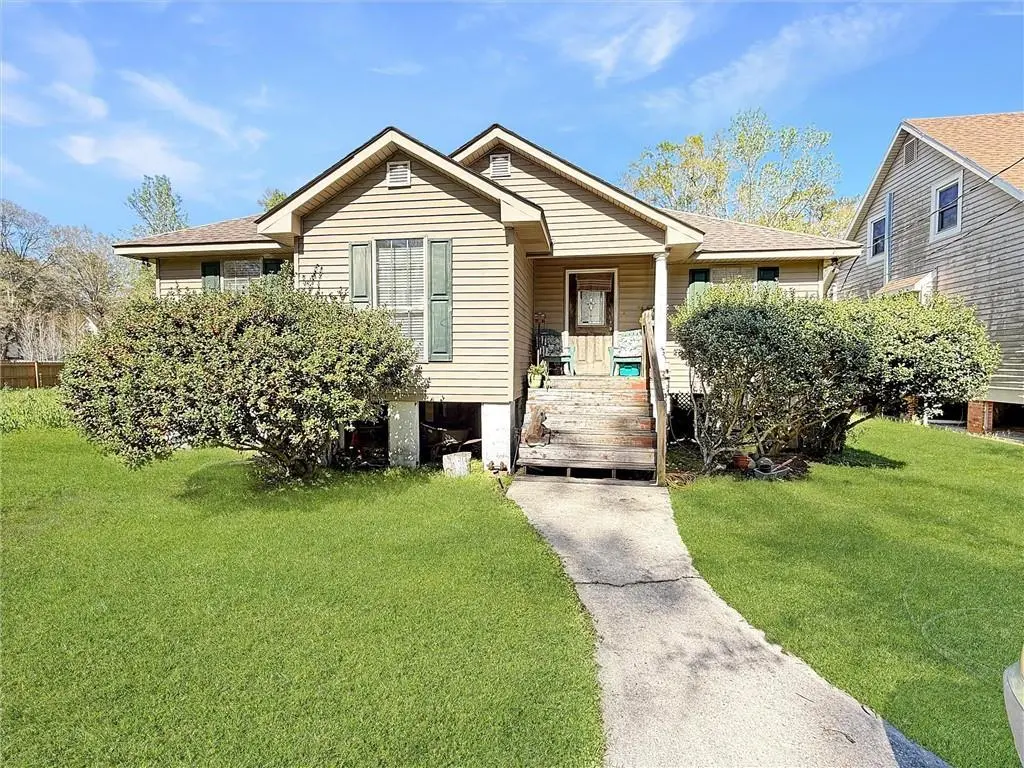
34141 Myrtle Ct · Slidell, LA
Flood risk 10/10 · Severe
- FEMA flood zone
- AE
- Chance of flooding over 30 yrs
- 0.99%
- Est. flood insurance / yr
- $1,737 – $8,500
Fire risk 4/10 · Minor
- Est. fire insurance / yr
- $1,269 – $2,357
Heat risk 10/10 · Severe
- Hot days now (above 108°F)
- 7 days/yr
- Hot days in 30 yrs
- 21 days/yr
Wind risk 9/10 · Severe
- Chance of severe wind over 30 yrs
- 99.0%
Air-quality risk 2/10 · Minimal
- Unhealthy air days now
- 1 days/yr
- Unhealthy air days in 30 yrs
- 2 days/yr
Risk factors via First Street. Map © Google.
Why this score? — see what drove the B+ grade
The composite is a weighted blend of 9 inputs, each scored 0–100. Each bar is that input's sub-score; the figure is the points it added to the 100-point composite (weight × sub-score).
- Cash flow +30.0/30.0
- ARV discount +15.0/15.0
- DSCR +10.0/10.0
- 1% rule +9.4/10.0
- Schools +4.3/10.0
- Rent growth +4.0/5.0
- Livability +3.5/5.0
- Condition / age +2.5/5.0
- Appreciation +0.0/10.0
$135,000
🖨 Deal sheet 📄 Offer letter ✓ Due diligence
Listing remarks MLS
Cute property with great investment potential! With a little TLC and some sprucing up, this home could be a great opportunity for investors or buyers looking to add their personal touch. The home features 3 bedrooms and 2 bathrooms, including a spacious primary suite with his-and-hers closets, a relaxing garden tub, and a separate free-standing shower. The property also offers a decent-sized backyard with room to enjoy the outdoors. A solid opportunity to add value and make it your own!
Key facts
- Parking
- Built 2005
- Listed 92 days
Neighborhood map
What this means for you Summary
Snapshot
- This is a 3-bed/2.0-bath single-family listed at $135k.
Deal economics
- At list price, monthly cash flow is $267 ($3k/yr) — positive.
- The deal already cash-flows at list — no discount required.
- Meets the 1% rule at list price ($2k rent vs $135k).
- Recommended offer: $123k (9.0% below list) — sets the bar for market timing.
- Cap rate 12.5% vs local median 5.9% in Slidell — top-decile yield for the area; either an underpriced asset or a hidden risk that comps aren't pricing in. Stress-test before assuming the spread holds.
Location & tenants
- Location reads 70/100 on livability (#57 in LA) — a middle-class / working-renter tenant base. Strengths: cost of living A+, housing A+, health & safety A+; Watch: amenities F, commute F.
- St. Tammany Parish (suburban): math 43% / reading 55% proficiency, ranked #11 of 98 in LA (top 11%) — families likely to look elsewhere, expect single-tenant / working-renter base with shorter leases.
- Market conditions: Rents rising fast (+5.9%/yr); 241 active listings in the ZIP; 3 comparable units currently listed for rent nearby; rentals at typical pace (median 24d on market — plan ~3-4 weeks tenant-placement turnaround); 1,064 units permitted in St. Tammany Parish in 2024 (0 in 5+ unit buildings).
- This rent runs 37% of the median local income ($63k/yr) — at the standard rent-burdened threshold; future hikes will face affordability resistance.
Forward outlook
- Local home prices are declining (-3.0%/yr); year-one equity from $933 of loan paydown is wiped out by about $4k of value loss. Plan a longer hold.
- St. Tammany County population projected at +27% by 2050 — long-run rental-demand tailwind backs the buy-and-hold thesis.
- At projected returns (-3.0% appreciation + 5.9% rent growth), your $38k cash investment doubles in ~9 years — after that, you're playing with house money.
Negotiation context
- It's been on market 92 days — a 9% lower offer ($123k) is reasonable based on typical stale-listing flexibility.
- 8 sale attempts since 18y ago with the ask held roughly flat each time — persistent listings suggest the price (not the market) is what's stuck; bring a comps-based counter.
Risks & watch-outs
- Watch-outs: flood insurance adds $427/mo.
- Climate carrying-cost: in FEMA flood zone AE (mandatory federal flood insurance); severe wind risk, 99% chance of damaging wind over 30y; extreme-heat days projected 7→21/yr by 2055 (HVAC capex compounding) — expect insurance premiums to compound above CPI over the hold.
Questions for the listing agent
- It's been on market 92 days. Have you received any prior offers? Is the seller open to a 9% concession, seller financing, or rate buy-down credit?
- What's the actual annual flood-insurance premium (NFIP or private), and is the property in a SFHA with mandatory coverage?
- Why hasn't it sold? Are there any deal-killer items the seller is aware of (foundation, flood, title, zoning, code violations)?
- Is there a deadline driving the sale (1031 exchange, divorce, estate, relocation)? That informs how much negotiation room exists.
- Schools are B-rated — typically a magnet for longer-tenancy family renters. What's the average tenant stay here, and is there a school-zone premium baked into asking?
- What's the average days-on-market for RENTAL listings here right now (not sales)? A rising rental-DOM trend means longer vacancies and softer asking-rent achievability than the comps imply.
- What's the recent tenant-quality profile in this submarket — average credit score on applications, eviction rate, late-payment / NSF rate, and stable-employment percentage? A property-management company in the area should have these aggregated.
- How much new for-sale + rental construction is in the pipeline within 1–3 miles? Heavy new supply typically softens prices + rents 12–24 months out; constrained supply supports both.
Investment metrics
- 1% rule
- 1.44% ✓
- Cap rate
- 12.46%
- Cash-on-cash
- 22.03%
- DSCR
- 1.98
- GRM
- 5.8
CMA / ARV
- ARV (median comp)
- $217,262
- List price
- $135,000
- Delta
- -37.86%
- Verdict
- UNDERPRICED
- Comps
- 20 within 1.0 mi
Show comp detail 12 sales within ~0.75 mi
| Address | Dist | Beds/Ba | Sqft | Sold | Price | $/sf | Match |
|---|---|---|---|---|---|---|---|
| 34076 Tupelo Ln | 0.25mi | 3/2.0 | 1,450 (+2%) | 1mo | $223,500 | $154 | 84 |
| 34092 Longleaf Ln | 0.14mi | 3/2.0 | 1,436 (+1%) | 15mo | $170,000 | $118 | 79 |
| 34019 Longleaf Ln | 0.27mi | 3/2.0 | 1,345 (-5%) | 13mo | $192,500 | $143 | 68 |
| 34056 Stanley St | 0.14mi | 3/2.0 | 1,624 (+15%) | 1mo | $195,000 | $120 | 68 |
| 34159 Tupelo Ln | 0.19mi | 3/1.0 | 1,318 (-7%) | 11mo | $150,000 | $114 | 66 |
| 58423 Holly Dr | 0.23mi | 3/2.0 | 1,507 (+6%) | 16mo | $210,433 | $140 | 65 |
| 58382 Holly Dr | 0.15mi | 3/2.0 | 1,542 (+9%) | 16mo | $215,000 | $139 | 65 |
| 58091 Saint Genevieve Ln | 0.36mi | 3/2.0 | 1,253 (-12%) | 2mo | $210,000 | $168 | 62 |
| 34050 Live Oak Ln | 0.27mi | 3/1.0 | 1,297 (-8%) | 10mo | $53,000 | $41 | 61 |
| 34117 Live Oak Ln | 0.18mi | 3/2.5 | 1,570 (+11%) | 14mo | $220,000 | $140 | 60 |
| 58275 Harbor Rd | 0.72mi | 3/2.0 | 1,344 (-5%) | 9mo | $157,000 | $117 | 51 |
| 103 Coin Du Lestin Dr | 0.65mi | 3/2.0 | 1,512 (+7%) | 15mo | $230,000 | $152 | 46 |
Match score weights: distance 35% · size 25% · config 20% · recency 20%. Top-matched comps best support the ARV.
Projected returns pro-forma
-3.0% appreciation · 5.91% rent growth · sell at horizon
- IRR
- 0.8%
- Equity multiple
- 1.03×
- Total profit
- $1,230
- Equity at exit
- $20,129
- IRR
- 13.9%
- Equity multiple
- 2.31×
- Total profit
- $49,399
- Equity at exit
- $11,672
Cash invested: $37,800 (down + closing). Projections, not guarantees.
Landlord ↔ Tenant lean methodology
- Overall (STATE)
- 90 Strongly Landlord-Friendly
- State Louisiana
- 90 Strongly Landlord-Friendly · R+12
- County
- — inherits STATE
- City
- — inherits STATE
ZIP-level market 70460
- Rents YoY
- 5.9%
- Active inventory
- 241
- Price-to-rent
- 5.8×
Monthly cashflow live
- Estimated rent
- $1,939 medium interval (Pro) →
- Mortgage (P&I)
- −$708
- Tax from tax record
- −$74 /mo · $885/yr
- Insurance
- −$56
- Flood insurance flood zone
- −$427 /mo · $5,118/yr
- HOA
- −$0
- Vacancy / Maint / Mgmt
- −$407
- Net cashflow
- $267
Break-even live
UW: 25.0% down · 7.5% · 30yr · 1.5% tax · 5.0% vac · 8.0% maint · 8.0% mgmt
Financing live
Cash to close
- Down payment
- $33,750
- Closing costs
- $4,050
- Reserves months
- —
- Total cash needed
- —
Loan-product check · same deal, 3 products live
Conventional
25% down · 7.5% · 30yr
- Down + closing
- —
- Monthly P&I
- —
- Monthly cashflow
- —
- DSCR
- —
- Eligible?
- —
Personal DTI + credit; lowest rate.
DSCR
20% down · 8.5% · 30yr
- Down + closing
- —
- Monthly P&I
- —
- Monthly cashflow
- —
- DSCR
- —
- Eligible?
- —
No personal income docs; deal must DSCR.
Hard money
10% down · 12.0% · 12mo
- Down + closing
- —
- Monthly P&I
- —
- Monthly cashflow
- —
- DSCR
- —
- Eligible?
- —
Short-term bridge; refi at stabilization.
Rent comps 3 comps
| Address | Beds | Baths | Sqft | Rent | $/sqft | DOM | Units | Dist |
|---|---|---|---|---|---|---|---|---|
| 34081 Stanley St Slidell, LA | 3.0 | 2.5 | 1832 | $1,950 | $1.06 | 1d | 1 | 0.11mi |
| 2322 Mallard St Slidell, LA | 3.0 | 2.0 | 1400 | $1,600 | $1.14 | 43d | 1 | 1.24mi |
| 2402 Pelican St Slidell, LA | 3.0 | 2.0 | 1400 | $1,700 | $1.21 | 23d | 1 | 1.44mi |
Listing history 24 events
-
2026-06-18days on market $135,000 Active 92 DOM
-
2026-06-17days on market $135,000 Active 91 DOM
-
2026-06-16days on market $135,000 Active 90 DOM
-
2026-06-15days on market $135,000 Active 89 DOM
-
2026-06-13days on market $135,000 Active 87 DOM
-
2026-06-10days on market $135,000 Active 84 DOM
-
2026-06-09days on market $135,000 Active 83 DOM
-
2026-06-08days on market $135,000 Active 82 DOM
-
2026-06-07days on market $135,000 Active 81 DOM
-
2026-06-03days on market $135,000 Active 77 DOM
-
2026-06-02days on market $135,000 Active 76 DOM
-
2026-06-01days on market $135,000 Active 75 DOM
-
2026-05-31days on market $135,000 Active 74 DOM
-
2026-03-16$135,000 Active 491-char remark
Show marketing remark (491 chars)
Cute property with great investment potential! With a little TLC and some sprucing up, this home could be a great opportunity for investors or buyers looking to add their personal touch. The home features 3 bedrooms and 2 bathrooms, including a spacious primary suite with his-and-hers closets, a relaxing garden tub, and a separate free-standing shower. The property also offers a decent-sized backyard with room to enjoy the outdoors. A solid opportunity to add value and make it your own!
-
2010-06-24soldstatus $120,000
-
2009-08-28$125,000
-
2009-08-28$125,000
-
2009-02-27$135,000
-
2009-02-27$135,000
-
2008-03-11$139,900
-
2008-03-11$139,900
-
2006-03-17soldstatus $68,000
-
2004-11-05soldstatus $17,500
ⓘ Source: listings_history table (triggers on properties + properties_extension) + one-shot
backfill from property_details.listing_events for pre-trigger history.
Tax reassessment forecast LA · Resets to sale price
- Current annual tax
- $885 · $74/mo
- Projected year-2 tax
- $885 · $74/mo
- Expected delta
- $0/yr ($0/mo · 0.0%)
ⓘ Screening estimate from a state-policy table — verify with the county assessor before closing.
Climate risk First Street
- Flood 10/10 Extreme FEMA zone AE · 99% chance over 30 yrs
- Wildfire 4/10 Moderate
- Heat 10/10 Extreme 7 d/yr ≥108°F today · 21 d/yr by 30 yrs out
- Wind 9/10 Extreme 99% chance of damaging wind over 30 yrs
- Air quality 2/10 Low 1 unhealthy d/yr today · 2 by 30 yrs out
Nearby sold comps map
Loading sold comps map…
Walkable amenities ~0.75 mi
Loading nearby amenities…
Taxation est. · year 1
- Rental income
- $23,269
- − Mortgage interest
- −$7,562
- − Property taxes
- −$885
- − Insurance
- −$5,794
- − Repairs & maintenance
- −$1,862
- − Management
- −$1,862
- − Depreciation
- −$3,927
- Taxable income
- $1,378
- Est. tax owed @ 24.0%
- −$331
- After-tax cash flow
- $2,878/yr
For passive investors: Depreciation is non-cash, so a rental often shows a tax loss while cash-flowing — sheltering income. Rental losses are passive: they offset passive income freely, and up to $25,000/yr can offset ordinary (W-2) income if you actively participate and your MAGI is under $100k (phasing out to $0 by $150k); unused losses carry forward. On sale, claimed depreciation is recaptured at up to 25%, and gains may owe capital-gains tax (a 1031 exchange can defer both). Figures are a year-1 estimate at your 24.0% rate — not tax advice; consult a CPA.
Schools (NCES district)
- District
- St. Tammany Parish
- NCES district ID
- 2201650
- Math proficiency
- 43% ▼ -32.00%
- Reading proficiency
- 55% ▼ -26.00%
- Median HH income
- $61,752
- Composite
- 43.04/100
- National rank
- #3098
- State rank
- #11 of 98 in LA
Livability — Slidell
- Score
- 70/100
- State rank
- #57
- US rank
- #7673
Category grades
Schools grade is shown separately in the Schools card above.
Census & demographics
- County
- Saint Tammany Parish · 228,296 people
- City population
- 95,511
- Metro
- New Orleans-Metairie, LA
- Population (ZIP)
- 21,669
- Household income
- $62,565
- Rent vs Own
- Severe rent burden
- 318.0
Population outlook (St. Tammany County) Hauer SSP2
- Today (2025)
- 286,725 people
- By 2030
- 304,175 · +6.1%
- By 2040
- 336,203 · +17.3%
- By 2050
- 364,590 · +27.2%
- By 2075
- 433,362 · +51.1%
- By 2100
- 470,333 · +64.0%
Race, ethnicity, and origin ACS 2023
- Neighborhood character
- Diverse neighborhood (Simpson 0.62)
- Race & ethnicity
- White 53% Black 29% Two or more races 11% Hispanic / Latino 10% Pacific Islander 2%
- Hispanic origin (detail)
- Mexican 3%
- Common ancestry
- Lithuanian 13% Slovak 1% Italian 1%
- Foreign-born
- 5% · Canada
- Languages at home
- 92% English-only · Spanish 6%
Political lean MEDSL · St. Tammany
- 2024 margin
- Solid R (+43.8) · D 27.3% · R 71.1% · Other 1.6%
- 2008→2024 swing
- +9.6pp toward D · 2008: -53.4pp · 2024: -43.8pp
- All cycles
- 2024: R+43.8 2020: R+44.2 2016: R+50.8 2012: R+52.2 2008: R+53.4
Not yet ingested
- Civics
- —
Market trends
- HPI YoY
- ▼ -93.87%
- Current HPI
- 130.56
- Rent YoY
- ▲ 5.91%
- Metro
- New Orleans-Metairie, LA
- State GDP YoY
- ▲ 3.29%
- F500 in state
- 10
Industry mix (Fortune 500 HQ in LA)
| Industry | F500 HQs | Revenue |
|---|---|---|
| Telecommunications | 2 | $23B |
|
||
| Utilities | 1 | $12B |
|
||
| Wholesale / Distribution | 1 | $5B |
|
||
| Advertising | 1 | $2B |
|
||
Price history
+671.4% since first listed11 events — show timeline
- 2026-03-16 Listed $135,000 GSREIN
- 2026-03-16 Listed $135,000 AcadianaMLS
- 2010-06-24 Sold (MLS) $120,000 GSREIN
- 2009-08-28 Listed $125,000 GSREIN
- 2009-08-28 Listed $125,000 AcadianaMLS
- 2009-02-27 Listed $135,000 GSREIN
- 2009-02-27 Listed $135,000 AcadianaMLS
- 2008-03-11 Listed $139,900 GSREIN
- 2008-03-11 Listed $139,900 AcadianaMLS
- 2006-03-17 Sold (Public Records) $68,000 Public Records
- 2004-11-05 Sold (Public Records) $17,500 Public Records
Property tax history
-5.2%/yrLatest (2025): $885 · -3.8% YoY. Source: county tax records.
Cash-flow waterfall
monthlySold comps — $/sqft
last 12 mo · ≤1 miLoading sold comps…