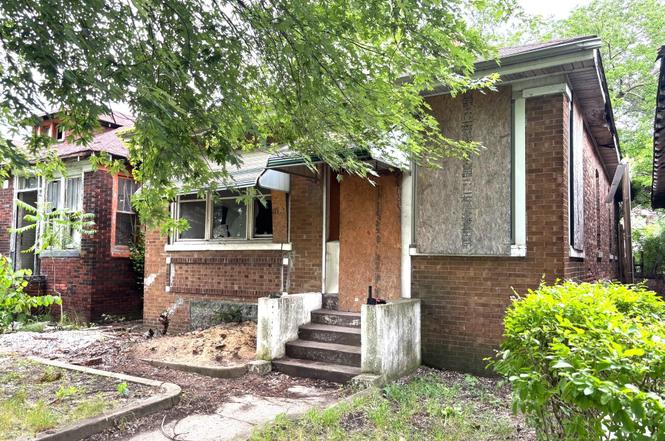
1060 Jackson St · Gary, IN
Flood risk 4/10 · Minor
- FEMA flood zone
- X (unshaded)
- Chance of flooding over 30 yrs
- 0.22%
- Est. flood insurance / yr
- $473 – $860
Fire risk 3/10 · Minor
- Est. fire insurance / yr
- $717 – $1,331
Heat risk 3/10 · Minor
- Hot days now (above 102°F)
- 7 days/yr
- Hot days in 30 yrs
- 15 days/yr
Wind risk 2/10 · Minimal
- Chance of severe wind over 30 yrs
- 1.0%
Air-quality risk 4/10 · Minor
- Unhealthy air days now
- 6 days/yr
- Unhealthy air days in 30 yrs
- 7 days/yr
Risk factors via First Street. Map © Google.
Why this score? — see what drove the B- grade
The composite is a weighted blend of 9 inputs, each scored 0–100. Each bar is that input's sub-score; the figure is the points it added to the 100-point composite (weight × sub-score).
- Cash flow +30.0/30.0
- 1% rule +10.0/10.0
- DSCR +10.0/10.0
- ARV discount +5.0/15.0
- Livability +3.7/5.0
- Rent growth +2.5/5.0
- Condition / age +2.5/5.0
- Appreciation +1.4/10.0
- Schools +0.5/10.0
$39,500
🖨 Deal sheet 📄 Offer letter ✓ Due diligence
Listing remarks
Attention Buyers - come unlock the potential of this 3 bed, 1 bath fixer upper. Whether you're looking for your next flip, rental, or sweat equity home, this property delivers. The after renovation value, revitalization in the area and long term returns make this property an ideal investment. This property has solid bones and bursting with opportunity. Bring your vision. Build your equity. Make your move. Sold As Is.
Key facts
- 3,615 sq ft lot
- Built 1920
- Listed 3 days
Property features AI
Exterior
- Parking: Additional paved parking; On-street parking; Alley access
- Utilities: Electricity available; Public water; Public sewer; Natural gas available
- Home design: Brick construction; Shingle roof; Built in 1920
- Construction: Brick exterior; Shingle roof; Unfinished basement
- Exterior features: Enclosed front porch; Partial fencing; Neighborhood view
Interior
- Kitchen: No appliances included
- Bedrooms: Primary bedroom; Bedroom 2; Bedroom 3
- Flooring: Hardwood; Vinyl
- Bathrooms: 1 full bathroom; 1 half bathroom
- Heating & cooling: Forced air heating; No cooling
- Interior features: Eat-in kitchen; Pantry; Unfinished basement
- Laundry & utility: Laundry in lower level
Neighborhood map
What this means for you Summary
Snapshot
- This is a 3-bed/1.5-bath single-family listed at $40k.
Deal economics
- At list price, monthly cash flow is $654 ($8k/yr) — positive.
- The deal already cash-flows at list — no discount required.
- Meets the 1% rule at list price ($1k rent vs $40k).
- Cap rate 26.2% vs local median 9.1% in Gary — top-decile yield for the area; either an underpriced asset or a hidden risk that comps aren't pricing in. Stress-test before assuming the spread holds.
Location & tenants
- Location reads 73/100 on livability (#105 in IN) — a middle-class / working-renter tenant base. Strengths: commute A+, cost of living A+, housing A+; Watch: schools F, crime F, employment F.
- Gary Community School Corporation (urban): math 3% / reading 11% proficiency, ranked #299 of 301 in IN (top 99%) — low school quality limits family demand, transient renter base, plan for 1-2y turnover; 80% free/reduced lunch — lower-income household profile, screen leases tightly.
- Market conditions: 46 active listings in the ZIP; 25 comparable units currently listed for rent nearby; rentals leasing fast (median 1d on market — plan ~1-2 weeks tenant-placement turnaround); lower-income renter base — watch delinquency; 1,642 units permitted in Lake County in 2024 (14 in 5+ unit buildings).
- This rent runs 44% of the median local income ($34k/yr) — at the standard rent-burdened threshold; future hikes will face affordability resistance.
Forward outlook
- Local home prices are declining (-3.0%/yr); year-one equity from $273 of loan paydown is wiped out by about $1k of value loss. Plan a longer hold.
- Lake County population projected to shrink 7% by 2050 — rents likely to lag national; underwrite the cash flow, not the appreciation.
- At projected returns (-3.0% appreciation + 3.0% rent growth), your $11k cash investment doubles in ~2 years — after that, you're playing with house money.
Negotiation context
- Only 3 days on market — expect competitive offers; lowballing is unlikely to land.
- 7 sale attempts since 23y ago with the ask held roughly flat each time — persistent listings suggest the price (not the market) is what's stuck; bring a comps-based counter.
Risks & watch-outs
- Watch-outs: property tax is 2.5% of price; built in 1920 — expect roof / HVAC / electrical / plumbing capex.
Questions for the listing agent
- Built in 1920 — when were the roof, HVAC, electrical panel, plumbing, and water heater last replaced?
- Property tax is high relative to price — has the assessment been appealed recently, and will the sale trigger a re-assessment?
- Is there a deadline driving the sale (1031 exchange, divorce, estate, relocation)? That informs how much negotiation room exists.
- Schools are F-rated, which usually means shorter tenancies and higher turnover. Who's the typical renter profile here, and what's been the actual vacancy rate?
- Crime grade is F in this area — have there been break-ins, vandalism, or insurance claims at this property in the last 3 years? What carrier currently insures it and at what premium?
- What's the average days-on-market for RENTAL listings here right now (not sales)? A rising rental-DOM trend means longer vacancies and softer asking-rent achievability than the comps imply.
- What's the recent tenant-quality profile in this submarket — average credit score on applications, eviction rate, late-payment / NSF rate, and stable-employment percentage? A property-management company in the area should have these aggregated.
- How much new for-sale + rental construction is in the pipeline within 1–3 miles? Heavy new supply typically softens prices + rents 12–24 months out; constrained supply supports both.
Investment metrics
- 1% rule
- 3.08% ✓
- Cap rate
- 26.18%
- Cash-on-cash
- 71.01%
- DSCR
- 4.16
- GRM
- 2.7
CMA / ARV
- ARV (on-the-fly)
- $37,422
- Comps found
- 12
Show comp detail 12 sales within ~0.75 mi
| Address | Dist | Beds/Ba | Sqft | Sold | Price | $/sf | Match |
|---|---|---|---|---|---|---|---|
| 1067 Polk St | 0.26mi | 3/1.5 | 1,088 (-4%) | 7mo | $116,000 | $107 | 75 |
| 1313 Harrison St | 0.23mi | 3/1.0 | 1,262 (+11%) | 2mo | $35,000 | $28 | 67 |
| 1361 Harrison Blvd | 0.33mi | 3/1.0 | 1,293 (+14%) | 1mo | $30,000 | $23 | 59 |
| 768 Tyler St | 0.37mi | 4/1.0 (+1) | 1,248 (+10%) | 1mo | $22,000 | $18 | 58 |
| 1561 Tyler St | 0.45mi | 3/1.0 | 1,008 (-11%) | 0mo | $12,000 | $12 | 58 |
| 668 Harrison St | 0.45mi | 3/1.5 | 1,008 (-11%) | 10mo | $40,000 | $40 | 53 |
| 1151 Delaware St | 0.66mi | 3/1.0 | 1,057 (-7%) | 9mo | $34,500 | $33 | 49 |
| 1620 Tyler St | 0.49mi | 3/1.0 | 1,280 (+13%) | 9mo | $17,500 | $14 | 46 |
| 1140 Delaware St | 0.62mi | 3/1.0 | 1,235 (+9%) | 13mo | $101,800 | $82 | 44 |
| 759 Grant St | 0.71mi | 3/1.0 | 1,248 (+10%) | 6mo | $100,000 | $80 | 43 |
| 1720 Fillmore St | 0.60mi | 3/1.0 | 1,280 (+13%) | 13mo | $40,000 | $31 | 38 |
| 1975 Jefferson St | 0.73mi | 3/2.0 | 1,247 (+10%) | 14mo | $181,120 | $145 | 36 |
Match score weights: distance 35% · size 25% · config 20% · recency 20%. Top-matched comps best support the ARV.
Projected returns pro-forma
-3.0% appreciation · 3.0% rent growth · sell at horizon
- IRR
- 70.6%
- Equity multiple
- 4.19×
- Total profit
- $35,322
- Equity at exit
- $5,890
- IRR
- 74.6%
- Equity multiple
- 8.65×
- Total profit
- $84,592
- Equity at exit
- $3,415
Cash invested: $11,060 (down + closing). Projections, not guarantees.
Landlord ↔ Tenant lean methodology
- Overall (STATE)
- 90 Strongly Landlord-Friendly
- State Indiana
- 90 Strongly Landlord-Friendly · R+11
- County
- — inherits STATE
- City
- — inherits STATE
ZIP-level market 46402
- Home prices YoY
- -2.8%
- Active inventory
- 46
- Price-to-rent
- 2.7×
Monthly cashflow live
- Estimated rent
- $1,217 high interval (Pro) →
- Mortgage (P&I)
- −$207
- Tax from tax record
- −$83 /mo · $1,001/yr
- Insurance
- −$16
- HOA
- −$0
- Vacancy / Maint / Mgmt
- −$256
- Net cashflow
- $654
Break-even live
UW: 25.0% down · 7.5% · 30yr · 1.5% tax · 5.0% vac · 8.0% maint · 8.0% mgmt
Financing live
Cash to close
- Down payment
- $9,875
- Closing costs
- $1,185
- Reserves months
- —
- Total cash needed
- —
Loan-product check · same deal, 3 products live
Conventional
25% down · 7.5% · 30yr
- Down + closing
- —
- Monthly P&I
- —
- Monthly cashflow
- —
- DSCR
- —
- Eligible?
- —
Personal DTI + credit; lowest rate.
DSCR
20% down · 8.5% · 30yr
- Down + closing
- —
- Monthly P&I
- —
- Monthly cashflow
- —
- DSCR
- —
- Eligible?
- —
No personal income docs; deal must DSCR.
Hard money
10% down · 12.0% · 12mo
- Down + closing
- —
- Monthly P&I
- —
- Monthly cashflow
- —
- DSCR
- —
- Eligible?
- —
Short-term bridge; refi at stabilization.
Rent comps 25 comps
| Address | Beds | Baths | Sqft | Rent | $/sqft | DOM | Units | Dist |
|---|---|---|---|---|---|---|---|---|
| 1572 Polk St Gary, IN | 3.0 | 1.0 | 1500 | $1,250 | $0.83 | 1d | 1 | 0.53mi |
| 1521 Pierce St Unit 1 Gary, IN | 2.0 | 1.0 | 800 | $850 | $1.06 | 1d | 1 | 0.54mi |
| 672 Connecticut St Apt 1S Gary, IN | 3.0 | 1.0 | 1247 | $875 | $0.70 | 15d | 1 | 0.61mi |
| 501 Madison St Gary, IN | 1.0–4.0 | 1.0 | 883 | $1,362 | $1.54 | 1d | 11 | 0.61mi |
| 840 W 19th Ave Gary, IN | 2.0 | 1.0 | 1035 | $1,150 | $1.11 | 19d | 1 | 0.63mi |
| 1316 Delaware St Unit 2 Gary, IN | 2.0 | 1.0 | 700 | $950 | $1.36 | 20d | 1 | 0.64mi |
| 1329 Delaware St Gary, IN | 2.0 | 1.0 | 1100 | $1,100 | $1.00 | 43d | 1 | 0.68mi |
| 411 Pierce St Gary, IN | 3.0 | 1.0 | 874 | $1,395 | $1.60 | 22d | 1 | 0.83mi |
| 2022 Massachusetts St Gary, IN | 2.0 | 1.0 | 965 | $1,000 | $1.04 | 1d | 1 | 0.89mi |
| 2061 Maryland St Gary, IN | 2.0 | 1.0 | 975 | $950 | $0.97 | 43d | 1 | 1.09mi |
| 844 Tennessee St Gary, IN | 3.0 | 1.5 | 1000 | $1,500 | $1.50 | 43d | 1 | 1.13mi |
| 317 Garfield St Gary, IN | 3.0 | 1.0 | 936 | $1,495 | $1.60 | 43d | 1 | 1.14mi |
| 358 Arthur St Unit 2 Gary, IN | 2.0 | 1.0 | 800 | $1,250 | $1.56 | 1d | 1 | 1.17mi |
| 1030 E 6th Ave Gary, IN | 3.0 | 1.5 | 1400 | $1,600 | $1.14 | 1d | 1 | 1.17mi |
| 2361 Pierce St Unit 2 Gary, IN | 3.0 | 1.0 | 860 | $900 | $1.05 | 1d | 1 | 1.24mi |
| 2306 W 5th Ave Gary, IN | 2.0–3.0 | 1.0 | 937 | $1,299 | $1.39 | 1d | 2 | 1.30mi |
| 2306 W 5th Ave Apt 3 Gary, IN | 3.0 | 1.0 | 1025 | $1,299 | $1.27 | 1d | 1 | 1.30mi |
| 2300 Maryland St Gary, IN | 2.0 | 1.0 | 900 | $1,000 | $1.11 | 19d | 1 | 1.30mi |
| 2336 Delaware St Gary, IN | 3.0 | 1.0 | 816 | $1,100 | $1.35 | 1d | 1 | 1.31mi |
| 1595 Ellsworth St Unit 1 Gary, IN | 2.0 | 1.0 | 868 | $1,100 | $1.27 | 1d | 1 | 1.34mi |
| 1595 Ellsworth St Gary, IN | 2.0 | 1.0 | 868 | $1,100 | $1.27 | 2d | 1 | 1.34mi |
| 2315 Industrial Blvd Gary, IN | 2.0 | 1.0 | 989 | $950 | $0.96 | 3d | 1 | 1.37mi |
| 2315 Industrial Blvd Gary, IN | 2.0 | 1.0 | 989 | $950 | $0.96 | 1d | 1 | 1.37mi |
| 2315 Industrial Blvd Unit B Gary, IN | 3.0 | 1.0 | 989 | $1,150 | $1.16 | 1d | 1 | 1.37mi |
| 2572-76 Van Buren Pl Gary, IN | 2.0 | 1.0 | 700 | $1,025 | $1.46 | 1d | 1 | 1.45mi |
Listing history 4 events
-
2026-06-18days on market $39,500 Active 3 DOM
-
2026-06-17days on market $39,500 Active 2 DOM
-
2026-06-15remarks 420-char remark
-
2026-06-15$39,500 Active 1 DOM
ⓘ Source: listings_history table (triggers on properties + properties_extension) + one-shot
backfill from property_details.listing_events for pre-trigger history.
Tax reassessment forecast IN · Partial reset (capped growth)
- Current annual tax
- $1,001 · $83/mo
- Projected year-2 tax
- $1,001 · $83/mo
- Expected delta
- $0/yr ($0/mo · 0.0%)
ⓘ Screening estimate from a state-policy table — verify with the county assessor before closing.
Climate risk First Street
- Flood 4/10 Moderate FEMA zone X (unshaded) · 22% chance over 30 yrs
- Wildfire 3/10 Moderate
- Heat 3/10 Moderate 7 d/yr ≥102°F today · 15 d/yr by 30 yrs out
- Wind 2/10 Low 100% chance of damaging wind over 30 yrs
- Air quality 4/10 Moderate 6 unhealthy d/yr today · 7 by 30 yrs out
Nearby sold comps map
Loading sold comps map…
Walkable amenities ~0.75 mi
Loading nearby amenities…
Taxation est. · year 1
- Rental income
- $14,605
- − Mortgage interest
- −$2,213
- − Property taxes
- −$1,001
- − Insurance
- −$198
- − Repairs & maintenance
- −$1,168
- − Management
- −$1,168
- − Depreciation
- −$1,149
- Taxable income
- $7,708
- Est. tax owed @ 24.0%
- −$1,850
- After-tax cash flow
- $6,004/yr
For passive investors: Depreciation is non-cash, so a rental often shows a tax loss while cash-flowing — sheltering income. Rental losses are passive: they offset passive income freely, and up to $25,000/yr can offset ordinary (W-2) income if you actively participate and your MAGI is under $100k (phasing out to $0 by $150k); unused losses carry forward. On sale, claimed depreciation is recaptured at up to 25%, and gains may owe capital-gains tax (a 1031 exchange can defer both). Figures are a year-1 estimate at your 24.0% rate — not tax advice; consult a CPA.
Schools (NCES district)
- District
- Gary Community School Corporation
- NCES district ID
- 1803870
- Math proficiency
- 3% ▼ -10.00%
- Reading proficiency
- 11% ▼ -6.00%
- Median HH income
- $27,739
- Composite
- 4.98/100
- National rank
- #10039
- State rank
- #299 of 301 in IN
Livability — Gary
- Score
- 73/100
- State rank
- #105
- US rank
- #5592
Category grades
Schools grade is shown separately in the Schools card above.
Census & demographics
- Census place
- Gary, IN
- County
- Lake County · 422,878 people
- City population
- 63,701
- Metro
- Chicago-Naperville-Elgin, IL-IN-WI
- Population (ZIP)
- 5,836
- Household income
- $33,529
- Rent vs Own
- Severe rent burden
- 336.0
Population outlook (Lake County) Hauer SSP2
- Today (2025)
- 484,026 people
- By 2030
- 478,091 · -1.2%
- By 2040
- 462,974 · -4.3%
- By 2050
- 449,894 · -7.1%
- By 2075
- 436,169 · -9.9%
- By 2100
- 426,607 · -11.9%
Race, ethnicity, and origin ACS 2023
- Neighborhood character
- Predominantly Black (87%)
- Race & ethnicity
- Black 87% Two or more races 5% White 5% Hispanic / Latino 4%
- Common ancestry
- Romanian 1% Ukrainian 1%
- Foreign-born
- 1% · Canada
- Languages at home
- 98% English-only · Spanish 1% Arabic 1%
Political lean MEDSL · Lake
- 2024 margin
- Lean D (+5.6) · D 52.1% · R 46.5% · Other 1.5%
- 2008→2024 swing
- -28.6pp toward R · 2008: 34.3pp · 2024: 5.6pp
- All cycles
- 2024: D+5.6 2020: D+15.1 2016: D+20.6 2012: D+31.0 2008: D+34.3
Not yet ingested
- Civics
- —
Market trends
- HPI YoY
- ▼ -7.21%
- Current HPI
- 250.2464
- Rent YoY
- —
- Metro
- Chicago-Naperville-Elgin, IL-IN-WI
- State GDP YoY
- ▲ 2.90%
- F500 in state
- 18
Industry mix (Fortune 500 HQ in IN)
| Industry | F500 HQs | Revenue |
|---|---|---|
| Industrial Machinery | 2 | $37B |
|
||
| Healthcare | 1 | $177B |
|
||
| Pharmaceuticals | 1 | $45B |
|
||
| Metals / Steel | 1 | $18B |
|
||
| Agriculture | 1 | $17B |
|
||
| Packaging | 1 | $12B |
|
||
Price history
-28.2% since first listed11 events — show timeline
- 2026-06-15 Listed $39,500 NIRA MLS as Distributed by MLS Grid
- 2010-07-17 Listing Removed — NIRA MLS as Distributed by MLS Grid
- 2009-01-16 Listed $14,900 NIRA MLS as Distributed by MLS Grid
- 2008-12-05 Listing Removed — NIRA MLS as Distributed by MLS Grid
- 2008-06-04 Listed $75,000 NIRA MLS as Distributed by MLS Grid
- 2007-04-09 Listed $18,900 NIRA MLS as Distributed by MLS Grid
- 2004-10-29 Listing Removed — NIRA MLS as Distributed by MLS Grid
- 2004-07-28 Listed $20,500 NIRA MLS as Distributed by MLS Grid
- 2004-07-28 Listed $20,500 NIRA MLS as Distributed by MLS Grid
- 2004-03-19 Listing Removed — NIRA MLS as Distributed by MLS Grid
- 2003-09-18 Listed $55,000 NIRA MLS as Distributed by MLS Grid
Property tax history
-9.9%/yrLatest (2024): $1,001 · +2.6% YoY. Source: county tax records.
Cash-flow waterfall
monthlySold comps — $/sqft
last 12 mo · ≤1 miLoading sold comps…