 Duplex
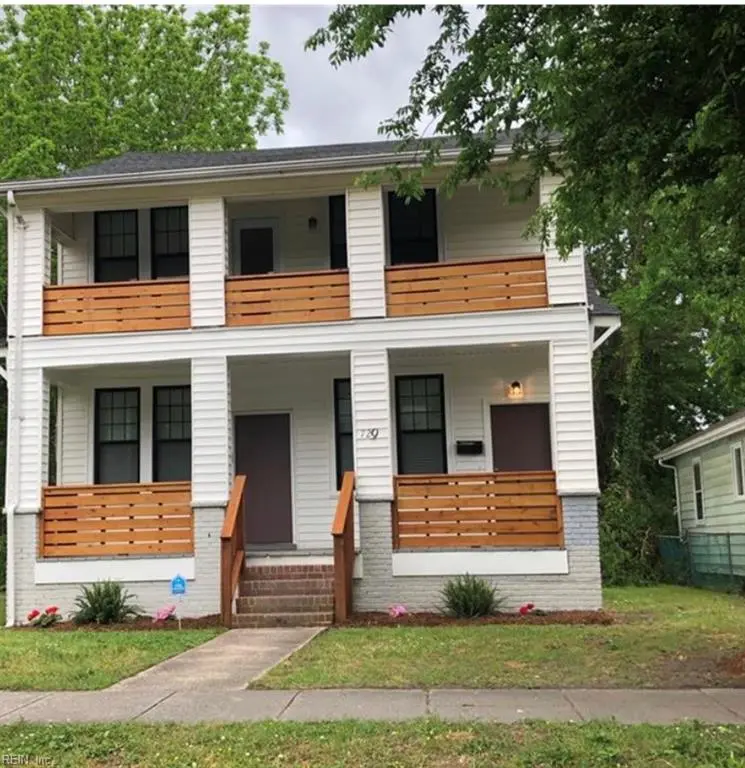
729 W 28th St · Norfolk, VA
Flood risk 4/10 · Minor
- FEMA flood zone
- X (unshaded)
- Chance of flooding over 30 yrs
- 0.13%
- Est. flood insurance / yr
- $507 – $1,088
Fire risk 1/10 · Minimal
- Est. fire insurance / yr
- $666 – $1,236
Heat risk 9/10 · Severe
- Hot days now (above 106°F)
- 7 days/yr
- Hot days in 30 yrs
- 16 days/yr
Wind risk 8/10 · Major
- Chance of severe wind over 30 yrs
- 80.0%
Air-quality risk 3/10 · Minor
- Unhealthy air days now
- 2 days/yr
- Unhealthy air days in 30 yrs
- 5 days/yr
Risk factors via First Street. Map © Google.
Why this score? — see what drove the B- grade
The composite is a weighted blend of 9 inputs, each scored 0–100. Each bar is that input's sub-score; the figure is the points it added to the 100-point composite (weight × sub-score).
- Cash flow +23.4/30.0
- ARV discount +15.0/15.0
- DSCR +7.5/10.0
- 1% rule +5.3/10.0
- Livability +4.2/5.0
- Rent growth +4.0/5.0
- Schools +3.5/10.0
- Condition / age +2.5/5.0
- Appreciation +0.0/10.0
$365,000
🖨 Deal sheet 📄 Offer letter ✓ Due diligence
Multi-family units
County records classify this as Multi-Family (2-4 Unit). Listing-text estimate: 2 units. confirmed
Listing remarks
Fully renovated duplex located in the historic Park Place neighborhood, offering strong investment appeal with both units currently leased. Each unit features updated flooring, fresh paint, and a modern kitchen with stainless steel appliances, granite countertops, white cabinetry, and in-unit washer and dryer. The property offers functional layouts and is positioned in a high-demand rental area with convenient access to major employment centers, shopping, and dining. This duplex is part of a six-property investment portfolio, presenting a rare opportunity to acquire multiple income-producing assets to be sold as a package
Key facts
- Renovated duplex
- Updated flooring
- Modern kitchen
Tags
Property features AI
Finance
- Financial info: Shows existing leases: Unit 1 lease expires 10/26/2026; Unit 2 lease expires 04/20/2026
Exterior
- Parking: Off-street parking
- Utilities: Separate electric meters; City/county water; City/county sewer; Electric water heater
- Home design: Duplex (over/under configuration); Simple ownership; Crawl foundation
- Construction: Asphalt shingle roof
- Exterior features: Vinyl siding; Off-street parking for each unit
Interior
- Kitchen: Each unit with a kitchen; Dishwasher in each unit
- Bedrooms: Unit 1: 3 bedrooms; Unit 2: 3 bedrooms
- Flooring: Carpet in both units
- Bathrooms: Unit 1: 1 bathroom; Unit 2: 1 bathroom
- Heating & cooling: Forced hot air heating in both units; Central air conditioning in both units
- Interior features: Window treatments; Utility closet
- Laundry & utility: Washer hookup in each unit; Dryer hookup in each unit
Neighborhood map
What this means for you Summary
Snapshot
- This is a 2 × 3-bed/1.0-bath units multifamily listed at $365k.
Deal economics
- At list price, monthly cash flow is $678 ($8k/yr) — positive. Per door: $339/mo.
- The deal already cash-flows at list — no discount required.
- Meets the 1% rule at list price ($4k rent vs $365k).
- Recommended offer: $354k (3.0% below list) — sets the bar for market timing.
- Cap rate 8.5% vs local median 4.0% in Norfolk — top-decile yield for the area; either an underpriced asset or a hidden risk that comps aren't pricing in. Stress-test before assuming the spread holds.
Location & tenants
- Location reads 83/100 on livability (#43 in VA, #1,026 nationally) — a professional / high-income tenant draw. Strengths: amenities A+, commute A+, health & safety A+; Watch: employment C-, crime F.
- Norfolk City Public School District (urban): math 27% / reading 56% proficiency, ranked #118 of 131 in VA (top 90%) — families likely to look elsewhere, expect single-tenant / working-renter base with shorter leases.
- Zoned schools: James Monroe Elementary (math 8% / reading 22%, grade F, #1,098 of 1,108 statewide, top 100%, 270 students, 100% FRL); Matthew Fontaine Maury High (math 46% / reading 90%, grade B, #180 of 319 statewide, top 57%, 1,697 students, 96% FRL) — zoned schools average 98% FRL vs 59% district-wide (39 pts higher); higher-poverty schools than district average — tighter screening recommended.
- Market conditions: Rents rising fast (+6.0%/yr); 100 active listings in the ZIP; 5 comparable units currently listed for rent nearby; rentals at typical pace (median 24d on market — plan ~3-4 weeks tenant-placement turnaround); 40% of comp listings sitting > 30 days — soft ceiling on asking rent; 438 units permitted in Norfolk city in 2024 (273 in 5+ unit buildings).
- At $3,761/mo this rent would consume 60% of the median local household income ($75k/yr) (locally 861% of renters already pay >50% of income on rent) — very limited rent-growth headroom before tenants either downsize or default.
Forward outlook
- Local home prices are declining (-3.0%/yr); year-one equity from $3k of loan paydown is wiped out by about $11k of value loss. Plan a longer hold.
- At projected returns (-3.0% appreciation + 6.0% rent growth), your $102k cash investment doubles in ~10 years — after that, you're playing with house money.
Negotiation context
- It's been on market 33 days — a 3% lower offer ($354k) is reasonable based on typical stale-listing flexibility.
- 5 sale attempts since 2y ago with the ask held roughly flat each time — persistent listings suggest the price (not the market) is what's stuck; bring a comps-based counter.
- Current owner paid $150k; list at $365k implies a 143% gain — meaningful room to come down on a strong offer.
Risks & watch-outs
- Watch-outs: built in 1921 — expect roof / HVAC / electrical / plumbing capex.
- Climate carrying-cost: severe wind risk, 80% chance of damaging wind over 30y; extreme-heat days projected 7→16/yr by 2055 (HVAC capex compounding) — expect insurance premiums to compound above CPI over the hold.
Questions for the listing agent
- It's been on market 33 days. Have you received any prior offers? Is the seller open to a 3% concession, seller financing, or rate buy-down credit?
- Can we see the unit-by-unit rent roll, current vacancy, and any below-market leases? What's the average tenancy length?
- What capital expenditures (roof, boiler, parking lot, exteriors) have been made in the last 5 years, and what's planned in the next 2?
- Built in 1921 — when were the roof, HVAC, electrical panel, plumbing, and water heater last replaced?
- Is there a deadline driving the sale (1031 exchange, divorce, estate, relocation)? That informs how much negotiation room exists.
- Schools are A-rated — typically a magnet for longer-tenancy family renters. What's the average tenant stay here, and is there a school-zone premium baked into asking?
- Crime grade is F in this area — have there been break-ins, vandalism, or insurance claims at this property in the last 3 years? What carrier currently insures it and at what premium?
- What's the average days-on-market for RENTAL listings here right now (not sales)? A rising rental-DOM trend means longer vacancies and softer asking-rent achievability than the comps imply.
- What's the recent tenant-quality profile in this submarket — average credit score on applications, eviction rate, late-payment / NSF rate, and stable-employment percentage? A property-management company in the area should have these aggregated.
- How much new apartment / multifamily construction is in the pipeline within 1–3 miles? Heavy new supply (>2% of stock underway) typically softens rents 12–24 months out; light construction supports rent growth.
Investment metrics
- 1% rule
- 1.03% ✓
- Cap rate
- 8.52%
- Cash-on-cash
- 7.96%
- DSCR
- 1.35
- GRM
- 8.1
CMA / ARV
- ARV (on-the-fly)
- $575,423
- Comps found
- 2
Show comp detail 2 sales within ~0.75 mi
| Address | Dist | Beds/Ba | Sqft | Sold | Price | $/sf | Match |
|---|---|---|---|---|---|---|---|
| 858 W 37th St | 0.34mi | 6/3.0 | 2,200 (-2%) | 4mo | $435,000 | $198 | 74 |
| 825 Spotswood Ave | 0.53mi | 5/2.0 (-1) | 2,100 (-6%) | 8mo | $540,000 | $257 | 53 |
Match score weights: distance 35% · size 25% · config 20% · recency 20%. Top-matched comps best support the ARV.
Projected returns pro-forma
-3.0% appreciation · 5.98% rent growth · sell at horizon
- IRR
- -1.1%
- Equity multiple
- 0.96×
- Total profit
- $-4,456
- Equity at exit
- $54,423
- IRR
- 11.3%
- Equity multiple
- 2.00×
- Total profit
- $102,017
- Equity at exit
- $31,559
Cash invested: $102,200 (down + closing). Projections, not guarantees.
Landlord ↔ Tenant lean methodology
- Overall (STATE)
- 55 Moderately Landlord-Leaning
- State Virginia
- 55 Moderately Landlord-Leaning · D+2
- County
- — inherits STATE
- City
- — inherits STATE
ZIP-level market 23508
- Rents YoY
- 6.0%
- Active inventory
- 100
- Price-to-rent
- 16.2×
Monthly cashflow live
- Estimated rent
- $3,761 high interval (Pro) →
- Mortgage (P&I)
- −$1,914
- Tax from tax record
- −$227 /mo · $2,728/yr
- Insurance
- −$152
- HOA
- −$0
- Vacancy / Maint / Mgmt
- −$790
- Net cashflow
- $678
Break-even live
2-unit breakdown (identical units grouped — click to expand)
| Units | Beds | Baths | Est. rent |
|---|---|---|---|
| 2× units | 3 | 1 | $3,760 |
| #1 | 3 | 1 | $1,880 |
| #2 | 3 | 1 | $1,880 |
| Total (2 units) | $3,761 | ||
UW: 25.0% down · 7.5% · 30yr · 1.5% tax · 5.0% vac · 8.0% maint · 8.0% mgmt
Financing live
Cash to close
- Down payment
- $91,250
- Closing costs
- $10,950
- Reserves months
- —
- Total cash needed
- —
Loan-product check · same deal, 3 products live
Conventional
25% down · 7.5% · 30yr
- Down + closing
- —
- Monthly P&I
- —
- Monthly cashflow
- —
- DSCR
- —
- Eligible?
- —
Personal DTI + credit; lowest rate.
DSCR
20% down · 8.5% · 30yr
- Down + closing
- —
- Monthly P&I
- —
- Monthly cashflow
- —
- DSCR
- —
- Eligible?
- —
No personal income docs; deal must DSCR.
Hard money
10% down · 12.0% · 12mo
- Down + closing
- —
- Monthly P&I
- —
- Monthly cashflow
- —
- DSCR
- —
- Eligible?
- —
Short-term bridge; refi at stabilization.
Rent comps 5 comps
| Address | Beds | Baths | Sqft | Rent | $/sqft | DOM | Units | Dist |
|---|---|---|---|---|---|---|---|---|
| 219 W 27th St Norfolk, VA | 5.0 | 3.5 | 2268 | $2,900 | $1.28 | 24d | 1 | 0.52mi |
| 4220 Bowdens Ferry Rd Unit A Norfolk, VA | 6.0 | 3.0 | 1800 | $2,574 | $1.43 | 44d | 1 | 0.81mi |
| 632 Redgate Ave Norfolk, VA | 5.0 | 3.5 | 2943 | $3,300 | $1.12 | 24d | 1 | 0.88mi |
| 1530 W 40th St Norfolk, VA | 6.0 | 2.5 | 2640 | $3,100 | $1.17 | 11d | 1 | 1.06mi |
| 766 A Ave Norfolk, VA | 5.0 | 2.0 | 1544 | $1,400 | $0.91 | 44d | 1 | 1.23mi |
Listing history 16 events
-
2026-04-22status Under Contract
-
2026-03-26status Active
-
2026-03-25historical
-
2026-03-18$365,000 Active
-
2025-11-10historical $1,475
-
2025-09-25$1,475
-
2025-09-21historical $1,475
-
2025-09-12$1,475
-
2025-03-03historical $1,475
-
2025-02-05price $1,475
-
2025-01-04price $1,500
-
2024-12-21$1,550
-
2017-10-27soldstatus $150,000
-
2001-08-24soldstatus $50,000
-
2001-08-24soldstatus $90,000
-
1991-08-30soldstatus $415,200
ⓘ Source: listings_history table (triggers on properties + properties_extension) + one-shot
backfill from property_details.listing_events for pre-trigger history.
Tax reassessment forecast VA · Resets to sale price
- Current annual tax
- $2,728 · $227/mo
- Projected year-2 tax
- $2,993 · $249/mo
- Expected delta
- +$265/yr (+$22/mo · 9.7%)
ⓘ Screening estimate from a state-policy table — verify with the county assessor before closing.
Climate risk First Street
- Flood 4/10 Moderate FEMA zone X (unshaded) · 13% chance over 30 yrs
- Wildfire 1/10 Low
- Heat 9/10 Extreme 7 d/yr ≥106°F today · 16 d/yr by 30 yrs out
- Wind 8/10 Severe 80% chance of damaging wind over 30 yrs
- Air quality 3/10 Moderate 2 unhealthy d/yr today · 5 by 30 yrs out
Nearby sold comps map
Loading sold comps map…
Walkable amenities ~0.75 mi
Loading nearby amenities…
Taxation est. · year 1
- Rental income
- $45,132
- − Mortgage interest
- −$20,446
- − Property taxes
- −$2,728
- − Insurance
- −$1,825
- − Repairs & maintenance
- −$3,611
- − Management
- −$3,611
- − Depreciation
- −$10,618
- Taxable income
- $2,294
- Est. tax owed @ 24.0%
- −$551
- After-tax cash flow
- $7,581/yr
For passive investors: Depreciation is non-cash, so a rental often shows a tax loss while cash-flowing — sheltering income. Rental losses are passive: they offset passive income freely, and up to $25,000/yr can offset ordinary (W-2) income if you actively participate and your MAGI is under $100k (phasing out to $0 by $150k); unused losses carry forward. On sale, claimed depreciation is recaptured at up to 25%, and gains may owe capital-gains tax (a 1031 exchange can defer both). Figures are a year-1 estimate at your 24.0% rate — not tax advice; consult a CPA.
Schools (NCES district)
- District
- Norfolk City Public School District
- NCES district ID
- 5102670
- Math proficiency
- 27% ▼ -44.00%
- Reading proficiency
- 56% ▼ -10.00%
- Median HH income
- $44,358
- Composite
- 35.08/100
- National rank
- #5026
- State rank
- #118 of 131 in VA
Livability — Norfolk
- Score
- 83/100
- State rank
- #43
- US rank
- #1026
Category grades
Schools grade is shown separately in the Schools card above.
Census & demographics
- Census place
- Norfolk, VA
- County
- Norfolk City · 214,042 people
- City population
- 214,042
- Metro
- Virginia Beach-Norfolk-Newport News, VA-NC
- Population (ZIP)
- 19,432
- Household income
- $74,885
- Rent vs Own
- Severe rent burden
- 861.0
Population outlook (Norfolk County) Hauer SSP2
- Today (2025)
- 249,032 people
- By 2030
- 252,347 · +1.3%
- By 2040
- 253,644 · +1.9%
- By 2050
- 251,913 · +1.2%
- By 2075
- 245,281 · -1.5%
- By 2100
- 219,548 · -11.8%
Race, ethnicity, and origin ACS 2023
- Neighborhood character
- Diverse neighborhood (Simpson 0.64)
- Race & ethnicity
- White 49% Black 33% Two or more races 9% Hispanic / Latino 7% Asian 4%
- Hispanic origin (detail)
- Mexican 2% Puerto Rican 2% Cuban 2%
- Common ancestry
- Lithuanian 2% Slovak 2% Romanian 1%
- Foreign-born
- 6% · Canada, China
- Languages at home
- 90% English-only · Spanish 3% Other Indo-European 3% French/Haitian/Cajun 1%
Political lean MEDSL · Norfolk
- 2024 margin
- Solid D (+41.5) · D 70.0% · R 28.5% · Other 1.6%
- 2008→2024 swing
- -1.4pp toward R · 2008: 43.0pp · 2024: 41.5pp
- All cycles
- 2024: D+41.5 2020: D+45.6 2016: D+42.0 2012: D+44.0 2008: D+43.0
Not yet ingested
- Civics
- —
Market trends
- HPI YoY
- ▼ -401.24%
- Current HPI
- 312.9923
- Rent YoY
- ▲ 5.98%
- Metro
- Virginia Beach-Norfolk-Newport News, VA-NC
- State GDP YoY
- ▲ 2.40%
- F500 in state
- 50
Industry mix (Fortune 500 HQ in VA)
| Industry | F500 HQs | Revenue |
|---|---|---|
| Aerospace / Defense | 4 | $236B |
|
||
| Technology / Defense | 3 | $32B |
|
||
| Financial Services | 2 | $176B |
|
||
| Utilities | 2 | $27B |
|
||
| Insurance | 2 | $25B |
|
||
| Technology | 2 | $15B |
|
||
Price history
-12.1% since first listed16 events — show timeline
- 2026-04-22 Pending — REINMLS
- 2026-03-26 Relisted — REINMLS
- 2026-03-25 Listing Removed — REINMLS
- 2026-03-18 Listed $365,000 REINMLS
- 2025-11-10 Rental Removed $1,475 APPFOLIO
- 2025-09-25 Listed for Rent $1,475 APPFOLIO
- 2025-09-21 Rental Removed $1,475 APPFOLIO
- 2025-09-12 Listed for Rent $1,475 APPFOLIO
- 2025-03-03 Rental Removed $1,475 APPFOLIO
- 2025-02-05 Price Changed $1,475 APPFOLIO
- 2025-01-04 Price Changed $1,500 APPFOLIO
- 2024-12-21 Listed for Rent $1,550 APPFOLIO
- 2017-10-27 Sold (Public Records) $150,000 Public Records
- 2001-08-24 Sold (Public Records) $90,000 Public Records
- 2001-08-24 Sold (Public Records) $50,000 Public Records
- 1991-08-30 Sold (Public Records) $415,200 Public Records
Property tax history
+4.7%/yrLatest (2025): $2,728 · +2.8% YoY. Source: county tax records.
Cash-flow waterfall
monthlySold comps — $/sqft
last 12 mo · ≤1 miLoading sold comps…