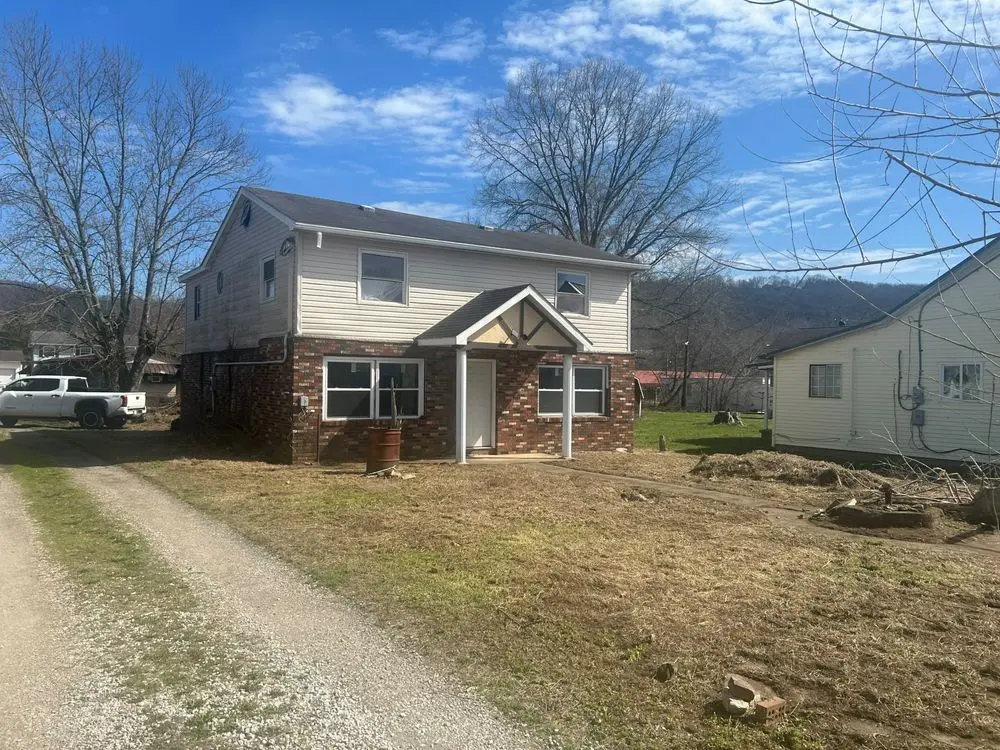
706 Magnolia Ave · Moundsville, WV
Flood risk 10/10 · Severe
- FEMA flood zone
- X (shaded)
- Chance of flooding over 30 yrs
- 0.99%
- Est. flood insurance / yr
- $507 – $1,088
Fire risk 1/10 · Minimal
- Est. fire insurance / yr
- $787 – $1,461
Heat risk 4/10 · Minor
- Hot days now (above 99°F)
- 8 days/yr
- Hot days in 30 yrs
- 20 days/yr
Wind risk 1/10 · Minimal
- Chance of severe wind over 30 yrs
- —
Air-quality risk 2/10 · Minimal
- Unhealthy air days now
- 1 days/yr
- Unhealthy air days in 30 yrs
- 3 days/yr
Risk factors via First Street. Map © Google.
Why this score? — see what drove the B- grade
The composite is a weighted blend of 9 inputs, each scored 0–100. Each bar is that input's sub-score; the figure is the points it added to the 100-point composite (weight × sub-score).
- Cash flow +30.0/30.0
- 1% rule +10.0/10.0
- DSCR +10.0/10.0
- ARV discount +7.5/15.0
- Livability +3.3/5.0
- Schools +2.7/10.0
- Rent growth +2.5/5.0
- Condition / age +2.5/5.0
- Appreciation +0.0/10.0
$68,000
🖨 Deal sheet (PDF) 📄 Offer letter ✓ Due diligence
Listing remarks MLS
This home was subject to a fire which resulted in damage to the first floor. This damage was estimated by insurance at $70k to repair including labor. The do-it-yourself'er could save a substantial amount. Level lot and large home with 4 bedrooms and 2 baths make this a great home or investment rental property.
Key facts
- Big porch
- Hardwood potential
- 4,792 sq ft lot
Tags
Property features AI
Exterior
- Home design: House
- Exterior features: Lot approximately 4,792 sq ft
Neighborhood map
What this means for you Summary
Snapshot
- This is a 3-bed/1.0-bath single-family listed at $68k.
Deal economics
- At list price, monthly cash flow is $340 ($4k/yr) — positive.
- The deal already cash-flows at list — no discount required.
- Meets the 1% rule at list price ($1k rent vs $68k).
- Recommended offer: $67k (1.5% below list) — sets the bar for market timing.
- Cap rate 13.5% vs local median 4.7% in Moundsville — top-decile yield for the area; either an underpriced asset or a hidden risk that comps aren't pricing in. Stress-test before assuming the spread holds.
Location & tenants
- Location reads 66/100 on livability (#105 in WV) — a middle-class / working-renter tenant base. Strengths: cost of living A+, housing A-, health & safety A-; Watch: amenities F, commute F, employment F.
- Marshall County Schools (suburban): math 28% / reading 36% proficiency, ranked #21 of 55 in WV (top 38%) — families likely to look elsewhere, expect single-tenant / working-renter base with shorter leases.
- Zoned schools: Mcninch Primary School (340 students, 0% FRL); Moundsville Middle School (math 16% / reading 27%, grade F, #97 of 109 statewide, top 91%, 409 students, 0% FRL); John Marshall High School (math 22% / reading 49%, grade F, #41 of 110 statewide, top 37%, 1,046 students, 0% FRL) — zoned schools average 0% FRL vs 42% district-wide (42 pts lower); this property's tenant base skews higher-income than the district average.
- Market conditions: 78 active listings in the ZIP; 6 units permitted in Marshall County in 2024 (0 in 5+ unit buildings).
Forward outlook
- Local home prices are declining (-3.0%/yr); year-one equity from $470 of loan paydown is wiped out by about $2k of value loss. Plan a longer hold.
- Marshall County population projected at -19% by 2050 — secular population decline; favor cash flow + early exit over multi-decade hold.
- At projected returns (-3.0% appreciation + 3.0% rent growth), your $19k cash investment doubles in ~6 years — after that, you're playing with house money.
Negotiation context
- It's been on market 15 days — a 2% lower offer ($67k) is reasonable based on typical stale-listing flexibility.
- 2 sale attempts since 8y ago with the ask held roughly flat each time — persistent listings suggest the price (not the market) is what's stuck; bring a comps-based counter.
- Current owner paid $13k; list at $68k implies a 411% gain — meaningful room to come down on a strong offer.
Risks & watch-outs
- Watch-outs: flood insurance adds $66/mo; built in 1940 — expect roof / HVAC / electrical / plumbing capex.
- Climate carrying-cost: severe flood risk — expect insurance premiums to compound above CPI over the hold.
Questions for the listing agent
- Built in 1940 — when were the roof, HVAC, electrical panel, plumbing, and water heater last replaced?
- What's the actual annual flood-insurance premium (NFIP or private), and is the property in a SFHA with mandatory coverage?
- Is there a deadline driving the sale (1031 exchange, divorce, estate, relocation)? That informs how much negotiation room exists.
- Schools are D-rated, which usually means shorter tenancies and higher turnover. Who's the typical renter profile here, and what's been the actual vacancy rate?
- What's the average days-on-market for RENTAL listings here right now (not sales)? A rising rental-DOM trend means longer vacancies and softer asking-rent achievability than the comps imply.
- What's the recent tenant-quality profile in this submarket — average credit score on applications, eviction rate, late-payment / NSF rate, and stable-employment percentage? A property-management company in the area should have these aggregated.
- How much new for-sale + rental construction is in the pipeline within 1–3 miles? Heavy new supply typically softens prices + rents 12–24 months out; constrained supply supports both.
Investment metrics
- 1% rule
- 1.52% ✓
- Cap rate
- 13.47%
- Cash-on-cash
- 25.63%
- DSCR
- 2.14
- GRM
- 5.5
CMA / ARV
- ARV (on-the-fly)
- $152,848
- Comps found
- 12
Show comp detail 12 sales within ~0.75 mi
| Address | Dist | Beds/Ba | Sqft | Sold | Price | $/sf | Match |
|---|---|---|---|---|---|---|---|
| 316 Thorn Ave | 0.56mi | 4/1.0 (+1) | 1,870 (+0%) | 3mo | $172,000 | $92 | 66 |
| 2213 4th St | 0.22mi | 3/2.0 | 2,082 (+12%) | 3mo | $220,000 | $106 | 63 |
| 1510 Fifth St | 0.39mi | 3/2.0 | 1,698 (-9%) | 8mo | $250,000 | $147 | 56 |
| 1603 3rd St | 0.38mi | 3/1.0 | 1,608 (-14%) | 5mo | $175,000 | $109 | 55 |
| 105 Cedar Ave | 0.65mi | 3/1.0 | 1,756 (-6%) | 10mo | $110,000 | $63 | 52 |
| 1707 Virginia St | 0.42mi | 3/3.0 | 2,121 (+14%) | 3mo | $165,000 | $78 | 47 |
| 1804 First St | 0.68mi | 3/1.0 | 1,624 (-13%) | 1mo | $124,000 | $76 | 46 |
| 1312 7th St | 0.48mi | 4/2.0 (+1) | 2,054 (+10%) | 10mo | $234,000 | $114 | 43 |
| 1109 4th St | 0.64mi | 3/1.5 | 1,654 (-11%) | 8mo | $122,000 | $74 | 43 |
| 1208 Center St | 0.69mi | 4/1.0 (+1) | 2,035 (+9%) | 6mo | $38,000 | $19 | 42 |
| 1009 7th St | 0.66mi | 4/1.5 (+1) | 2,056 (+10%) | 4mo | $167,835 | $82 | 42 |
| 1309 Center St | 0.65mi | 3/2.0 | 1,600 (-14%) | 7mo | $127,100 | $79 | 36 |
Match score weights: distance 35% · size 25% · config 20% · recency 20%. Top-matched comps best support the ARV.
Projected returns pro-forma
-3.0% appreciation · 3.0% rent growth · sell at horizon
- IRR
- 14.0%
- Equity multiple
- 1.56×
- Total profit
- $10,667
- Equity at exit
- $10,139
- IRR
- 22.8%
- Equity multiple
- 2.96×
- Total profit
- $37,270
- Equity at exit
- $5,879
Cash invested: $19,040 (down + closing). Projections, not guarantees.
Landlord ↔ Tenant lean methodology
- Overall (STATE)
- 83 Strongly Landlord-Friendly
- State West Virginia
- 83 Strongly Landlord-Friendly · R+22
- County
- — inherits STATE
- City
- — inherits STATE
ZIP-level market 26041
- Home prices YoY
- -24.8%
- Active inventory
- 78
- Price-to-rent
- 5.5×
Monthly cashflow live
- Estimated rent
- $1,035 medium interval (Pro) →
- Mortgage (P&I)
- −$357
- Tax from tax record
- −$26 /mo · $313/yr
- Insurance
- −$28
- Flood insurance flood zone
- −$66 /mo · $798/yr
- HOA
- −$0
- Vacancy / Maint / Mgmt
- −$217
- Net cashflow
- $340
Break-even live
Sensitivity live
| Price | -10% $379 | -5% $359 | +0% $340 | +5% $321 | +10% $302 |
|---|---|---|---|---|---|
| Rent | -10% $258 | -5% $299 | +0% $340 | +5% $381 | +10% $422 |
| Rate | -1.0pp $374 | -0.5pp $357 | base $340 | +0.5pp $323 | +1.0pp $305 |
UW: 25.0% down · 7.5% · 30yr · 1.5% tax · 5.0% vac · 8.0% maint · 8.0% mgmt
Financing live
Cash to close
- Down payment
- $17,000
- Closing costs
- $2,040
- Reserves months
- —
- Total cash needed
- —
Loan-product check · same deal, 3 products live
Conventional
25% down · 7.5% · 30yr
- Down + closing
- —
- Monthly P&I
- —
- Monthly cashflow
- —
- DSCR
- —
- Eligible?
- —
Personal DTI + credit; lowest rate.
DSCR
20% down · 8.5% · 30yr
- Down + closing
- —
- Monthly P&I
- —
- Monthly cashflow
- —
- DSCR
- —
- Eligible?
- —
No personal income docs; deal must DSCR.
Hard money
10% down · 12.0% · 12mo
- Down + closing
- —
- Monthly P&I
- —
- Monthly cashflow
- —
- DSCR
- —
- Eligible?
- —
Short-term bridge; refi at stabilization.
Listing history 11 events
-
2026-06-19days on market $68,000 Active 15 DOM
-
2026-06-18days on market $68,000 Active 14 DOM
-
2026-06-17days on market $68,000 Active 13 DOM
-
2026-06-16days on market $68,000 Active 12 DOM
-
2026-06-15days on market $68,000 Active 11 DOM
-
2026-06-14days on market $68,000 Active 9 DOM
-
2026-06-12days on market $68,000 Active 8 DOM
-
2026-06-09days on market $68,000 Active 5 DOM
-
2026-06-08days on market $68,000 Active 4 DOM
-
2026-06-07remarks 550-char remark
-
2026-06-07$68,000 Active 3 DOM
ⓘ Source: listings_history table (triggers on properties + properties_extension) + one-shot
backfill from property_details.listing_events for pre-trigger history.
Tax reassessment forecast WV · Resets to sale price
- Current annual tax
- $313 · $26/mo
- Projected year-2 tax
- $401 · $33/mo
- Expected delta
- +$89/yr (+$7/mo · 28.3%)
ⓘ Screening estimate from a state-policy table — verify with the county assessor before closing.
Climate risk First Street
- Flood 10/10 Extreme FEMA zone X (shaded) · 99% chance over 30 yrs
- Wildfire 1/10 Low
- Heat 4/10 Moderate 8 d/yr ≥99°F today · 20 d/yr by 30 yrs out
- Wind 1/10 Low
- Air quality 2/10 Low 1 unhealthy d/yr today · 3 by 30 yrs out
Nearby sold comps map
Loading sold comps map…
Walkable amenities ~0.75 mi
Loading nearby amenities…
Taxation est. · year 1
- Rental income
- $12,420
- − Mortgage interest
- −$3,809
- − Property taxes
- −$313
- − Insurance
- −$1,138
- − Repairs & maintenance
- −$994
- − Management
- −$994
- − Depreciation
- −$1,978
- Taxable income
- $3,195
- Est. tax owed @ 24.0%
- −$767
- After-tax cash flow
- $3,315/yr
For passive investors: Depreciation is non-cash, so a rental often shows a tax loss while cash-flowing — sheltering income. Rental losses are passive: they offset passive income freely, and up to $25,000/yr can offset ordinary (W-2) income if you actively participate and your MAGI is under $100k (phasing out to $0 by $150k); unused losses carry forward. On sale, claimed depreciation is recaptured at up to 25%, and gains may owe capital-gains tax (a 1031 exchange can defer both). Figures are a year-1 estimate at your 24.0% rate — not tax advice; consult a CPA.
Schools (NCES district)
- District
- Marshall County Schools
- NCES district ID
- 5400750
- Math proficiency
- 28% ▼ -6.00%
- Reading proficiency
- 36% ▼ -4.00%
- Median HH income
- $40,289
- Composite
- 26.91/100
- National rank
- #7086
- State rank
- #21 of 55 in WV
Livability — Moundsville
- Score
- 66/100
- State rank
- #105
- US rank
- #11553
Category grades
Schools grade is shown separately in the Schools card above.
Census & demographics
- Census place
- Moundsville, WV
- County
- Marshall · 16,750 people
- Metro
- Wheeling, WV-OH
- Population (ZIP)
- 15,706
- Household income
- $55,545
- Rent vs Own
- Severe rent burden
- 7.4
Population outlook (Marshall County) Hauer SSP2
- Today (2025)
- 30,387 people
- By 2030
- 29,242 · -3.8%
- By 2040
- 26,806 · -11.8%
- By 2050
- 24,627 · -19.0%
- By 2075
- 19,846 · -34.7%
- By 2100
- 15,169 · -50.1%
Race, ethnicity, and origin ACS 2023
- Neighborhood character
- Predominantly White (94%)
- Race & ethnicity
- White 94% Two or more races 3% Hispanic / Latino 1%
- Common ancestry
- Romanian 4% Iranian 2% Italian 1%
- Foreign-born
- 1% · Canada
- Languages at home
- 98% English-only · Spanish 1% German/W. Germanic 1%
Political lean MEDSL · Marshall
- 2024 margin
- Solid R (+50.0) · D 24.1% · R 74.1% · Other 1.8%
- 2008→2024 swing
- -37.5pp toward R · 2008: -12.6pp · 2024: -50.0pp
- All cycles
- 2024: R+50.0 2020: R+49.6 2016: R+51.0 2012: R+28.6 2008: R+12.6
Not yet ingested
- Civics
- —
Market trends
- HPI YoY
- ▼ -50.71%
- Current HPI
- 153.9522
- Rent YoY
- —
- Metro
- —
- State GDP YoY
- —
- F500 in state
- 0
Price history
-67.0% since first listed4 events — show timeline
- 2026-06-04 Listed $68,000 ForSaleByOwner.com
- 2018-07-31 Sold (MLS) $13,300 WBOR
- 2018-07-14 Listed $16,500 WBOR
- 2016-05-13 Sold (Public Records) $206,000 Public Records
Property tax history
+1.7%/yrLatest (2025): $313 · +0.9% YoY. Source: county tax records.
Cash-flow waterfall
monthlySold comps — $/sqft
last 12 mo · ≤1 miLoading sold comps…