26 Longino Rd · Hattiesburg, MS
Flood risk 1/10 · Minimal
- FEMA flood zone
- X (unshaded)
- Chance of flooding over 30 yrs
- 0.0%
- Est. flood insurance / yr
- $507 – $1,088
Fire risk 4/10 · Minor
- Est. fire insurance / yr
- $1,241 – $2,305
Heat risk 7/10 · Major
- Hot days now (above 106°F)
- 7 days/yr
- Hot days in 30 yrs
- 20 days/yr
Wind risk 8/10 · Major
- Chance of severe wind over 30 yrs
- 99.0%
Air-quality risk 1/10 · Minimal
- Unhealthy air days now
- 0 days/yr
- Unhealthy air days in 30 yrs
- 0 days/yr
Risk factors via First Street. Map © Google.
Why this score? — see what drove the B grade
The composite is a weighted blend of 9 inputs, each scored 0–100. Each bar is that input's sub-score; the figure is the points it added to the 100-point composite (weight × sub-score).
- Cash flow +30.0/30.0
- 1% rule +10.0/10.0
- DSCR +10.0/10.0
- ARV discount +7.5/15.0
- Rent growth +4.1/5.0
- Livability +4.0/5.0
- Schools +3.1/10.0
- Condition / age +2.5/5.0
- Appreciation +0.0/10.0
$29,990
🖨 Deal sheet 📄 Offer letter ✓ Due diligence
Listing remarks MLS
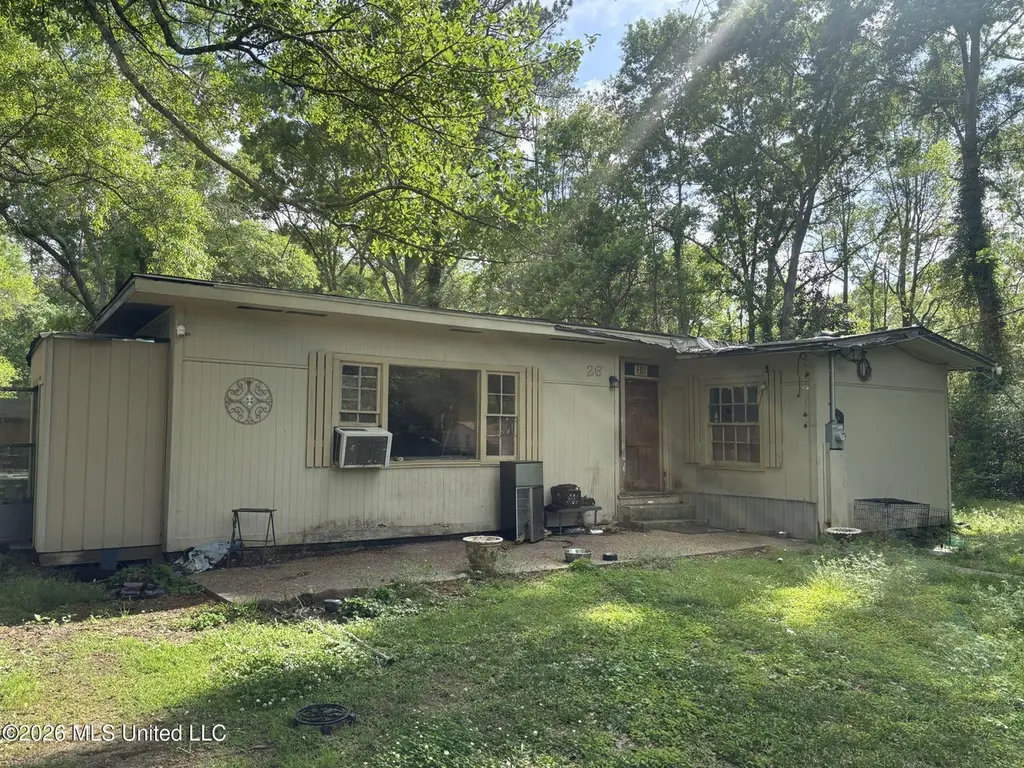
Subject is located in an older area in southeast Hattiesburg. The area is built up with a variety of improvement ranging from Mobile Homes to more recently built single family improvements. The improvement has a raised foundation, with a flat roof, wood windows, masonite siding. It is considered to be in fair condition.
Key facts
- 0.34 acre lot
- Parking
- Built 1956
Property features AI
Finance
- Other: Lot size approximately 0.34 acres
Exterior
- Parking: 1 parking space; Other parking features
- Utilities: Water source: see remarks; Sewer: see remarks; Utilities: see remarks
- Home design: Single family residence (house); One story; Property listed as fixer
- Construction: Asphalt shingle roof; Construction materials: see remarks; Foundation details: see remarks; 1,176 total building area; Year built per public records
- Exterior features: See remarks for exterior features
Interior
- Kitchen: See remarks for appliances and kitchen details
- Bedrooms: Primary bedroom on the main level; Additional bedroom on the main level
- Bathrooms: 2 full bathrooms
- Heating & cooling: See remarks for heating; See remarks for cooling
- Interior features: 6 total rooms; See remarks for additional interior details
- Laundry & utility: See remarks for laundry and utility details
Neighborhood map
What this means for you Summary
Snapshot
- This is a 2-bed/2.0-bath single-family listed at $30k.
Deal economics
- At list price, monthly cash flow is $648 ($8k/yr) — positive.
- The deal already cash-flows at list — no discount required.
- Meets the 1% rule at list price ($1k rent vs $30k).
- Recommended offer: $29k (3.0% below list) — sets the bar for market timing.
- Cap rate 32.2% vs local median 4.0% in Hattiesburg — top-decile yield for the area; either an underpriced asset or a hidden risk that comps aren't pricing in. Stress-test before assuming the spread holds.
Location & tenants
- Location reads 79/100 on livability (#5 in MS, #2,046 nationally) — a middle-class / working-renter tenant base. Strengths: commute A+, cost of living A+, health & safety A+; Watch: schools D+, crime D+, employment F.
- Forrest County School District (rural): math 39% / reading 36% proficiency, ranked #47 of 130 in MS (top 36%) — families likely to look elsewhere, expect single-tenant / working-renter base with shorter leases; 67% free/reduced lunch — lower-income household profile, screen leases tightly.
- Market conditions: Rents rising fast (+6.6%/yr); 261 active listings in the ZIP; 1 comparable units currently listed for rent nearby; lower-income renter base — watch delinquency; 121 units permitted in Forrest County in 2024 (30 in 5+ unit buildings).
- This rent runs 32% of the median local income ($41k/yr) — at the standard rent-burdened threshold; future hikes will face affordability resistance.
Forward outlook
- Local home prices are declining (-3.0%/yr); year-one equity from $208 of loan paydown is wiped out by about $900 of value loss. Plan a longer hold.
- Forrest County population projected at +6% by 2050 — modest demand growth; plan on rents tracking national, not racing it.
- At projected returns (-3.0% appreciation + 6.6% rent growth), your $8k cash investment doubles in ~2 years — after that, you're playing with house money.
Negotiation context
- It's been on market 43 days — a 3% lower offer ($29k) is reasonable based on typical stale-listing flexibility.
- 3 sale attempts since 12y ago; this cycle's ask has dropped $20k (40%) from the opening price — seller is motivated, your offer sets the floor, not the list.
Risks & watch-outs
- Watch-outs: built in 1956 — expect roof / HVAC / electrical / plumbing capex.
- Climate carrying-cost: severe wind risk, 99% chance of damaging wind over 30y; extreme-heat days projected 7→20/yr by 2055 (HVAC capex compounding) — expect insurance premiums to compound above CPI over the hold.
Questions for the listing agent
- It's been on market 43 days. Have you received any prior offers? Is the seller open to a 3% concession, seller financing, or rate buy-down credit?
- Built in 1956 — when were the roof, HVAC, electrical panel, plumbing, and water heater last replaced?
- Is there a deadline driving the sale (1031 exchange, divorce, estate, relocation)? That informs how much negotiation room exists.
- Schools are D-rated, which usually means shorter tenancies and higher turnover. Who's the typical renter profile here, and what's been the actual vacancy rate?
- Crime grade is D in this area — have there been break-ins, vandalism, or insurance claims at this property in the last 3 years? What carrier currently insures it and at what premium?
- What's the average days-on-market for RENTAL listings here right now (not sales)? A rising rental-DOM trend means longer vacancies and softer asking-rent achievability than the comps imply.
- What's the recent tenant-quality profile in this submarket — average credit score on applications, eviction rate, late-payment / NSF rate, and stable-employment percentage? A property-management company in the area should have these aggregated.
- How much new for-sale + rental construction is in the pipeline within 1–3 miles? Heavy new supply typically softens prices + rents 12–24 months out; constrained supply supports both.
Investment metrics
- 1% rule
- 3.60% ✓
- Cap rate
- 32.20%
- Cash-on-cash
- 92.53%
- DSCR
- 5.12
- GRM
- 2.3
CMA / ARV
No comps found within radius.
Projected returns pro-forma
-3.0% appreciation · 6.56% rent growth · sell at horizon
- IRR
- 97.3%
- Equity multiple
- 5.81×
- Total profit
- $40,402
- Equity at exit
- $4,472
- IRR
- —
- Equity multiple
- 13.63×
- Total profit
- $106,034
- Equity at exit
- $2,593
Cash invested: $8,397 (down + closing). Projections, not guarantees.
Landlord ↔ Tenant lean methodology
- Overall (STATE)
- 90 Strongly Landlord-Friendly
- State Mississippi
- 90 Strongly Landlord-Friendly · R+11
- County
- — inherits STATE
- City
- — inherits STATE
ZIP-level market 39401
- Rents YoY
- 6.6%
- Active inventory
- 261
- Price-to-rent
- 2.3×
Monthly cashflow live
- Estimated rent
- $1,080 medium interval (Pro) →
- Mortgage (P&I)
- −$157
- Tax from tax record
- −$36 /mo · $428/yr
- Insurance
- −$12
- HOA
- −$0
- Vacancy / Maint / Mgmt
- −$227
- Net cashflow
- $648
Break-even live
UW: 25.0% down · 7.5% · 30yr · 1.5% tax · 5.0% vac · 8.0% maint · 8.0% mgmt
Financing live
Cash to close
- Down payment
- $7,498
- Closing costs
- $900
- Reserves months
- —
- Total cash needed
- —
Loan-product check · same deal, 3 products live
Conventional
25% down · 7.5% · 30yr
- Down + closing
- —
- Monthly P&I
- —
- Monthly cashflow
- —
- DSCR
- —
- Eligible?
- —
Personal DTI + credit; lowest rate.
DSCR
20% down · 8.5% · 30yr
- Down + closing
- —
- Monthly P&I
- —
- Monthly cashflow
- —
- DSCR
- —
- Eligible?
- —
No personal income docs; deal must DSCR.
Hard money
10% down · 12.0% · 12mo
- Down + closing
- —
- Monthly P&I
- —
- Monthly cashflow
- —
- DSCR
- —
- Eligible?
- —
Short-term bridge; refi at stabilization.
Rent comps 1 comps
| Address | Beds | Baths | Sqft | Rent | $/sqft | DOM | Units | Dist |
|---|---|---|---|---|---|---|---|---|
| 22 Central School Rd Hattiesburg, MS | 1.0–3.0 | 1.0–2.0 | 850 | $825 | $0.97 | 21d | 8 | 0.90mi |
Listing history 22 events
-
2026-06-19days on market $29,990 Active 43 DOM
-
2026-06-18days on market $29,990 Active 42 DOM
-
2026-06-17days on market $29,990 Active 41 DOM
-
2026-06-16days on market $29,990 Active 40 DOM
-
2026-06-15days on market $29,990 Active 39 DOM
-
2026-06-14days on market $29,990 Active 37 DOM
-
2026-06-13days on market $29,990 Active 36 DOM
-
2026-06-10days on market $29,990 Active 34 DOM
-
2026-06-09days on market $29,990 Active 33 DOM
-
2026-06-08days on market $29,990 Active 32 DOM
-
2026-06-07pricedays on market $29,990 Active 31 DOM
-
2026-06-05days on market $39,900 Active 28 DOM
-
2026-06-02days on market $39,900 Active 26 DOM
-
2026-06-01days on market $39,900 Active 25 DOM
-
2026-05-31days on market $39,900 Active 24 DOM
-
2026-05-30days on market $39,900 Active 23 DOM
-
2026-05-12price $39,900
-
2026-05-07$49,990 Active
-
2023-02-23soldstatus 321-char remark
Show marketing remark (321 chars)
Subject is located in an older area in southeast Hattiesburg. The area is built up with a variety of improvement ranging from Mobile Homes to more recently built single family improvements. The improvement has a raised foundation, with a flat roof, wood windows, masonite siding. It is considered to be in fair condition.
-
2020-08-20soldstatus
-
2016-06-27$25,000 321-char remark
Show marketing remark (321 chars)
Subject is located in an older area in southeast Hattiesburg. The area is built up with a variety of improvement ranging from Mobile Homes to more recently built single family improvements. The improvement has a raised foundation, with a flat roof, wood windows, masonite siding. It is considered to be in fair condition.
-
2014-09-18$25,000
ⓘ Source: listings_history table (triggers on properties + properties_extension) + one-shot
backfill from property_details.listing_events for pre-trigger history.
Tax reassessment forecast MS · Resets to sale price
- Current annual tax
- $428 · $36/mo
- Projected year-2 tax
- $428 · $36/mo
- Expected delta
- $0/yr ($0/mo · 0.0%)
ⓘ Screening estimate from a state-policy table — verify with the county assessor before closing.
Climate risk First Street
- Flood 1/10 Low FEMA zone X (unshaded) · 0% chance over 30 yrs
- Wildfire 4/10 Moderate
- Heat 7/10 Severe 7 d/yr ≥106°F today · 20 d/yr by 30 yrs out
- Wind 8/10 Severe 99% chance of damaging wind over 30 yrs
- Air quality 1/10 Low 0 unhealthy d/yr today · 0 by 30 yrs out
Nearby sold comps map
Loading sold comps map…
Walkable amenities ~0.75 mi
Loading nearby amenities…
Taxation est. · year 1
- Rental income
- $12,956
- − Mortgage interest
- −$1,680
- − Property taxes
- −$428
- − Insurance
- −$150
- − Repairs & maintenance
- −$1,036
- − Management
- −$1,036
- − Depreciation
- −$872
- Taxable income
- $7,753
- Est. tax owed @ 24.0%
- −$1,861
- After-tax cash flow
- $5,910/yr
For passive investors: Depreciation is non-cash, so a rental often shows a tax loss while cash-flowing — sheltering income. Rental losses are passive: they offset passive income freely, and up to $25,000/yr can offset ordinary (W-2) income if you actively participate and your MAGI is under $100k (phasing out to $0 by $150k); unused losses carry forward. On sale, claimed depreciation is recaptured at up to 25%, and gains may owe capital-gains tax (a 1031 exchange can defer both). Figures are a year-1 estimate at your 24.0% rate — not tax advice; consult a CPA.
Schools (NCES district)
- District
- Forrest County School District
- NCES district ID
- 2801490
- Math proficiency
- 39% ▼ -7.00%
- Reading proficiency
- 36% ▼ -6.00%
- Median HH income
- $39,597
- Composite
- 31.45/100
- National rank
- #5980
- State rank
- #47 of 130 in MS
Livability — Hattiesburg
- Score
- 79/100
- State rank
- #5
- US rank
- #2046
Category grades
Schools grade is shown separately in the Schools card above.
Census & demographics
- Census place
- Hattiesburg, MS
- County
- Forrest County · 65,413 people
- City population
- 87,151
- Metro
- Hattiesburg, MS
- Population (ZIP)
- 42,531
- Household income
- $41,127
- Rent vs Own
- Severe rent burden
- 2534.0
Population outlook (Forrest County) Hauer SSP2
- Today (2025)
- 79,264 people
- By 2030
- 80,822 · +2.0%
- By 2040
- 82,979 · +4.7%
- By 2050
- 84,324 · +6.4%
- By 2075
- 84,942 · +7.2%
- By 2100
- 80,616 · +1.7%
Race, ethnicity, and origin ACS 2023
- Neighborhood character
- Diverse neighborhood (Simpson 0.57)
- Race & ethnicity
- Black 52% White 40% Two or more races 5% Hispanic / Latino 4%
- Common ancestry
- Slovak 2% Lithuanian 2% Serbian 1%
- Foreign-born
- 3% · Canada, China
- Languages at home
- 96% English-only · Spanish 2%
Political lean MEDSL · Forrest
- 2024 margin
- R (+17.9) · D 40.3% · R 58.2% · Other 1.4%
- 2008→2024 swing
- -4.4pp toward R · 2008: -13.5pp · 2024: -17.9pp
- All cycles
- 2024: R+17.9 2020: R+11.1 2016: R+14.2 2012: R+11.7 2008: R+13.5
Not yet ingested
- Civics
- —
Market trends
- HPI YoY
- ▼ -148.93%
- Current HPI
- 137.87
- Rent YoY
- ▲ 6.56%
- Metro
- Hattiesburg, MS
- State GDP YoY
- —
- F500 in state
- 0
Price history
+59.6% since first listed6 events — show timeline
- 2026-05-12 Price Changed $39,900 MLSU
- 2026-05-07 Listed $49,990 MLSU
- 2023-02-23 Sold (MLS) — HAAR
- 2020-08-20 Sold (Public Records) — Public Records
- 2016-06-27 Listed $25,000 HAAR
- 2014-09-18 Listed $25,000 HAAR
Property tax history
-3.2%/yrLatest (2025): $428 · +17.9% YoY. Source: county tax records.
Cash-flow waterfall
monthlySold comps — $/sqft
last 12 mo · ≤1 miLoading sold comps…