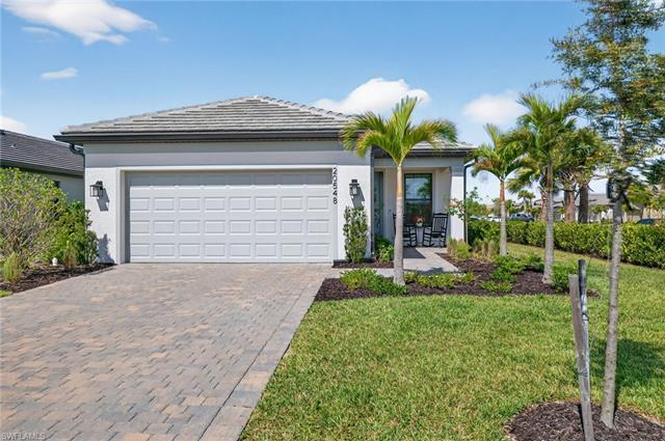
20548 Pebble Glen Dr · Estero, FL
Flood risk 5/10 · Moderate
- FEMA flood zone
- X (unshaded)
- Chance of flooding over 30 yrs
- 0.48%
- Est. flood insurance / yr
- $507 – $1,088
Fire risk 6/10 · Moderate
- Est. fire insurance / yr
- $947 – $1,759
Heat risk 9/10 · Severe
- Hot days now (above 108°F)
- 7 days/yr
- Hot days in 30 yrs
- 29 days/yr
Wind risk 10/10 · Severe
- Chance of severe wind over 30 yrs
- 99.0%
Air-quality risk 2/10 · Minimal
- Unhealthy air days now
- 1 days/yr
- Unhealthy air days in 30 yrs
- 1 days/yr
Risk factors via First Street. Map © Google.
Why this score? — see what drove the D- grade
The composite is a weighted blend of 9 inputs, each scored 0–100. Each bar is that input's sub-score; the figure is the points it added to the 100-point composite (weight × sub-score).
- Cash flow +10.5/30.0
- ARV discount +8.3/15.0
- 1% rule +4.2/10.0
- Schools +4.1/10.0
- Livability +4.0/5.0
- DSCR +3.0/10.0
- Condition / age +2.5/5.0
- Rent growth +2.1/5.0
- Appreciation +0.0/10.0
$429,000
🖨 Deal sheet (PDF) 📄 Offer letter ✓ Due diligence
Listing remarks
Welcome to the highly sought-after Contour model by PulteGroup, offering modern design, quality construction, and exceptional upgrades throughout! This beautifully maintained residence features 2 bedrooms plus a den, 2 full baths, a 2-car garage, and a nearly 60-foot-long driveway. Soaring 10-foot ceilings and upgraded 8-foot doors enhance the open, airy feel. The den is enclosed with elegant French glass doors, making it ideal for a home office or flex space. Enjoy peace of mind with impact windows and doors, an impact glass front door, a serviced A/C unit, and the home is located in a non-flood zone. As an end lot situated home, the property offers a larger lot with. The extended lanai an
Key facts
- Upgraded cabinetry
- Extended lanai
- Fully fenced yard
Tags
Property features AI
Finance
- Other: Property type: Residential; Zoning: MPD; Oversize lot; Lot area about 0.2158 acres; Restrictions: Architectural and deeded
- HOA & community: Mandatory HOA (professional management); HOA fee approximately $181 monthly; Master HOA fee approximately $196.53 monthly; Total annual recurring HOA fees approximately $5,016; One-time fees approximately $5,000; HOA maintains irrigation water, lawn/land, street maintenance, legal/accounting; Community amenities include clubhouse, community pool and spa, exercise room, tennis, pickleball, bocce, basketball, dog park, sidewalks, community park, community room, internet access
Exterior
- Parking: Attached 2-car garage
- Security: Impact resistant doors and windows
- Utilities: Central water; Central sewer; Natural gas available; Cable available
- Home design: Single-family home; 1 story / ranch; Built in 2024; Rear exposure facing west; Located in Verdana Village (gated community)
- Construction: Concrete block construction
- Exterior features: Fence; Room for a pool; Impact resistant windows and doors; Stucco finish; Tile roof
Interior
- Kitchen: Kitchen island; Pantry; Cooktop (gas); Range; Microwave; Dishwasher; Disposal; Refrigerator; Freezer
- Bedrooms: 2 bedrooms
- Flooring: Carpet; Tile
- Bathrooms: 2 full bathrooms; Master bath with shower (no tub)
- Heating & cooling: Central electric heat; Central electric cooling
- Interior features: French doors; Den / study; Guest room; Guest bath; Screened lanai/porch; Open floor plan (other)
- Laundry & utility: Washer; Dryer; Auto garage door; Smoke detector
Neighborhood map
What this means for you Summary
Snapshot
- This is a 2-bed/2.0-bath single-family listed at $429k.
Deal economics
- At list price, monthly cash flow is $-220 ($-3k/yr) — negative.
- To cash-flow at today's rent, offer at most $390k (9.1% below list).
- To meet the 1% rule (rent ≥ 1% of price), the offer needs to be $395k (8.0% below list).
- Recommended offer: $390k (9.1% below list) — sets the bar for cash-flow.
- Cap rate 5.7% vs local median 3.4% in Estero — top-decile yield for the area; either an underpriced asset or a hidden risk that comps aren't pricing in. Stress-test before assuming the spread holds.
Location & tenants
- Location reads 79/100 on livability (#149 in FL, #2,242 nationally) — a middle-class / working-renter tenant base. Strengths: crime A+, employment A+, housing A+; Watch: amenities F, commute F, cost of living D-.
- Lee (suburban): math 47% / reading 50% proficiency, ranked #42 of 73 in FL (top 58%) — families likely to look elsewhere, expect single-tenant / working-renter base with shorter leases.
- Zoned schools: Pinewoods Elementary School (math 81% / reading 74%, grade A, #163 of 2,144 statewide, top 8%, 1,089 students, 25% FRL); Lexington Middle School (math 55% / reading 54%, grade B-, #183 of 571 statewide, top 34%, 1,138 students, 44% FRL); South Fort Myers High School (math 23% / reading 30%, grade F, #489 of 667 statewide, top 74%, 1,917 students, 50% FRL) — zoned schools average 39% FRL vs 57% district-wide (18 pts lower); this property's tenant base skews higher-income than the district average.
- Market conditions: Rents soft (-1.4%/yr); 675 active listings in the ZIP; 2 comparable units currently listed for rent nearby; solid renter incomes; 15,411 units permitted in Lee County in 2024 (4,686 in 5+ unit buildings).
- At $3,946/mo this rent would consume 46% of the median local household income ($103k/yr) (locally 606% of renters already pay >50% of income on rent) — very limited rent-growth headroom before tenants either downsize or default.
Forward outlook
- Local home prices are declining (-3.0%/yr); year-one equity from $3k of loan paydown is wiped out by about $13k of value loss. Plan a longer hold.
- Lee County population projected at +44% by 2050 — long-run rental-demand tailwind backs the buy-and-hold thesis.
Negotiation context
- It's been on market 111 days — a 9% lower offer ($390k) is reasonable based on typical stale-listing flexibility.
- 2 sale attempts; this cycle's ask is 15221% above the opening price — seller raised mid-cycle; expect resistance to lowballs.
Risks & watch-outs
- Climate carrying-cost: moderate flood risk; severe wind risk, 99% chance of damaging wind over 30y; major wildfire risk; extreme-heat days projected 7→29/yr by 2055 (HVAC capex compounding) — expect insurance premiums to compound above CPI over the hold.
Questions for the listing agent
- What do current leases actually rent for vs. the listed asking? Can we see a recent rent roll and the last 12 months of T-12 income?
- It's been on market 111 days. Have you received any prior offers? Is the seller open to a 9% concession, seller financing, or rate buy-down credit?
- What does the HOA fee cover, when was the last increase, and are there any pending special assessments or reserve-fund shortfalls?
- Why hasn't it sold? Are there any deal-killer items the seller is aware of (foundation, flood, title, zoning, code violations)?
- Is there a deadline driving the sale (1031 exchange, divorce, estate, relocation)? That informs how much negotiation room exists.
- Schools are A-rated — typically a magnet for longer-tenancy family renters. What's the average tenant stay here, and is there a school-zone premium baked into asking?
- The area grade is low — what's the realistic commute time and amenity access for the typical tenant pool here? Any planned neighborhood developments (good or bad) we should know about?
- What's the average days-on-market for RENTAL listings here right now (not sales)? A rising rental-DOM trend means longer vacancies and softer asking-rent achievability than the comps imply.
- What's the recent tenant-quality profile in this submarket — average credit score on applications, eviction rate, late-payment / NSF rate, and stable-employment percentage? A property-management company in the area should have these aggregated.
- How much new for-sale + rental construction is in the pipeline within 1–3 miles? Heavy new supply typically softens prices + rents 12–24 months out; constrained supply supports both.
Investment metrics
- 1% rule
- 0.92% ✗
- Cap rate
- 5.68%
- Cash-on-cash
- -2.20%
- DSCR
- 0.90
- GRM
- 9.1
CMA / ARV
- ARV (on-the-fly)
- $436,955
- Comps found
- 3
Show comp detail 3 sales within ~0.75 mi
| Address | Dist | Beds/Ba | Sqft | Sold | Price | $/sf | Match |
|---|---|---|---|---|---|---|---|
| 20590 Pebble Glen Dr | 0.07mi | 2/2.0 | 1,405 (0%) | 3mo | $437,000 | $311 | 94 |
| 20564 Pebble Glen Dr | 0.03mi | 2/2.0 | 1,405 (0%) | 8mo | $440,000 | $313 | 92 |
| 20506 Pebble Glen Dr | 0.12mi | 2/2.0 | 1,405 (0%) | 14mo | $415,000 | $295 | 83 |
Match score weights: distance 35% · size 25% · config 20% · recency 20%. Top-matched comps best support the ARV.
Projected returns pro-forma
-3.0% appreciation · 0.0% rent growth · sell at horizon
- IRR
- -23.7%
- Equity multiple
- 0.21×
- Total profit
- $-94,804
- Equity at exit
- $63,965
- IRR
- -32.3%
- Equity multiple
- -0.20×
- Total profit
- $-144,113
- Equity at exit
- $37,092
Cash invested: $120,120 (down + closing). Projections, not guarantees.
Landlord ↔ Tenant lean methodology
- Overall (STATE)
- 87 Strongly Landlord-Friendly
- State Florida
- 87 Strongly Landlord-Friendly · R+3
- County
- — inherits STATE
- City
- — inherits STATE
ZIP-level market 33928
- Rents YoY
- -1.4%
- Active inventory
- 675
- Price-to-rent
- 9.1×
Monthly cashflow live
- Estimated rent
- $3,946 medium interval (Pro) →
- Mortgage (P&I)
- −$2,250
- Tax from tax record
- −$532 /mo · $6,379/yr
- Insurance
- −$179
- HOA
- −$377
- Lot rent
- −$0
- Vacancy / Maint / Mgmt
- −$829
- Net cashflow
- $-220
Break-even live
Sensitivity live
| Price | -10% $23 | -5% $-99 | +0% $-220 | +5% $-341 | +10% $-463 |
|---|---|---|---|---|---|
| Rent | -10% $-532 | -5% $-376 | +0% $-220 | +5% $-64 | +10% $92 |
| Rate | -1.0pp $-4 | -0.5pp $-111 | base $-220 | +0.5pp $-331 | +1.0pp $-444 |
UW: 25.0% down · 7.5% · 30yr · 1.5% tax · 5.0% vac · 8.0% maint · 8.0% mgmt
Financing live
Cash to close
- Down payment
- $107,250
- Closing costs
- $12,870
- Reserves months
- —
- Total cash needed
- —
Loan-product check · same deal, 3 products live
Conventional
25% down · 7.5% · 30yr
- Down + closing
- —
- Monthly P&I
- —
- Monthly cashflow
- —
- DSCR
- —
- Eligible?
- —
Personal DTI + credit; lowest rate.
DSCR
20% down · 8.5% · 30yr
- Down + closing
- —
- Monthly P&I
- —
- Monthly cashflow
- —
- DSCR
- —
- Eligible?
- —
No personal income docs; deal must DSCR.
Hard money
10% down · 12.0% · 12mo
- Down + closing
- —
- Monthly P&I
- —
- Monthly cashflow
- —
- DSCR
- —
- Eligible?
- —
Short-term bridge; refi at stabilization.
Rent comps 2 comps
| Address | Beds | Baths | Sqft | Rent | $/sqft | DOM | Units | Dist |
|---|---|---|---|---|---|---|---|---|
| 20514 Pebble Glen Dr Estero, FL | 2.0 | 2.0 | 1670 | $5,700 | $3.41 | 26d | 1 | 0.12mi |
| 19218 Hinkley Dr Estero, FL | 3.0 | 2.0 | 1655 | $3,000 | $1.81 | 16d | 1 | 0.75mi |
HOA detail
- Monthly dues
- $377 · $4,524/yr
Listing history 15 events
-
2026-06-22days on market $429,000 Active 111 DOM
-
2026-06-22days on market $429,000 Active 110 DOM
-
2026-06-17days on market $429,000 Active 106 DOM
-
2026-06-16days on market $429,000 Active 105 DOM
-
2026-06-15days on market $429,000 Active 104 DOM
-
2026-06-13days on market $429,000 Active 102 DOM
-
2026-06-10days on market $429,000 Active 99 DOM
-
2026-06-09days on market $429,000 Active 98 DOM
-
2026-06-07days on market $429,000 Active 96 DOM
-
2026-06-02days on market $429,000 Active 91 DOM
-
2026-06-01days on market $429,000 Active 90 DOM
-
2026-06-01days on market $429,000 Active 89 DOM
-
2026-04-13$2,800
-
2026-03-23price $429,000
-
2026-03-03$440,000 Active
ⓘ Source: listings_history table (triggers on properties + properties_extension) + one-shot
backfill from property_details.listing_events for pre-trigger history.
Tax reassessment forecast FL · Resets to sale price
- Current annual tax
- $6,379 · $532/mo
- Projected year-2 tax
- $6,379 · $532/mo
- Expected delta
- $0/yr ($0/mo · 0.0%)
ⓘ Screening estimate from a state-policy table — verify with the county assessor before closing.
Climate risk First Street
- Flood 5/10 Major FEMA zone X (unshaded) · 48% chance over 30 yrs
- Wildfire 6/10 Major
- Heat 9/10 Extreme 7 d/yr ≥108°F today · 29 d/yr by 30 yrs out
- Wind 10/10 Extreme 99% chance of damaging wind over 30 yrs
- Air quality 2/10 Low 1 unhealthy d/yr today · 1 by 30 yrs out
Nearby sold comps map
Loading sold comps map…
Walkable amenities ~0.75 mi
Loading nearby amenities…
Taxation est. · year 1
- Rental income
- $47,347
- − Mortgage interest
- −$24,031
- − Property taxes
- −$6,379
- − Insurance
- −$2,145
- − Repairs & maintenance
- −$3,788
- − Management
- −$3,788
- − HOA
- −$4,524
- − Depreciation
- −$12,480
- Taxable loss
- −$9,787
- Est. tax savings @ 24.0%
- +$2,349
- After-tax cash flow
- $-291/yr
For passive investors: Depreciation is non-cash, so a rental often shows a tax loss while cash-flowing — sheltering income. Rental losses are passive: they offset passive income freely, and up to $25,000/yr can offset ordinary (W-2) income if you actively participate and your MAGI is under $100k (phasing out to $0 by $150k); unused losses carry forward. On sale, claimed depreciation is recaptured at up to 25%, and gains may owe capital-gains tax (a 1031 exchange can defer both). Figures are a year-1 estimate at your 24.0% rate — not tax advice; consult a CPA.
Schools (NCES district)
- District
- Lee
- NCES district ID
- 1201080
- Math proficiency
- 47% ▼ -11.00%
- Reading proficiency
- 50% ▼ -4.00%
- Median HH income
- $49,518
- Composite
- 41.49/100
- National rank
- #3458
- State rank
- #42 of 73 in FL
Livability — Estero
- Score
- 79/100
- State rank
- #149
- US rank
- #2242
Category grades
Schools grade is shown separately in the Schools card above.
Census & demographics
- County
- Lee County · 788,662 people
- City population
- 31,926
- Metro
- Cape Coral-Fort Myers, FL
- Population (ZIP)
- 31,926
- Household income
- $102,624
- Rent vs Own
- Severe rent burden
- 606.0
Population outlook (Lee County) Hauer SSP2
- Today (2025)
- 871,946 people
- By 2030
- 955,468 · +9.6%
- By 2040
- 1,113,587 · +27.7%
- By 2050
- 1,256,891 · +44.1%
- By 2075
- 1,560,270 · +78.9%
- By 2100
- 1,726,848 · +98.0%
Race, ethnicity, and origin ACS 2023
- Neighborhood character
- Predominantly White (85%)
- Race & ethnicity
- White 85% Hispanic / Latino 8% Two or more races 7% Asian 3% Black 1%
- Hispanic origin (detail)
- Mexican 2% Puerto Rican 2% Cuban 1%
- Common ancestry
- Romanian 5% Lithuanian 3% Slovak 2%
- Foreign-born
- 11% · Canada, China, Jamaica
- Languages at home
- 90% English-only · Spanish 5% Other Indo-European 1% French/Haitian/Cajun 1%
Political lean MEDSL · Lee
- 2024 margin
- Strong R (+28.4) · D 35.5% · R 63.9%
- 2008→2024 swing
- -18.0pp toward R · 2008: -10.4pp · 2024: -28.4pp
- All cycles
- 2024: R+28.4 2020: R+19.2 2016: R+20.4 2012: R+16.6 2008: R+10.4
Not yet ingested
- Civics
- —
Market trends
- HPI YoY
- ▼ -109.49%
- Current HPI
- 197.5913
- Rent YoY
- ▼ -1.42%
- Metro
- Cape Coral-Fort Myers, FL
- State GDP YoY
- ▲ 3.28%
- F500 in state
- 36
Industry mix (Fortune 500 HQ in FL)
| Industry | F500 HQs | Revenue |
|---|---|---|
| Industrial Technology | 2 | $29B |
|
||
| Insurance | 2 | $17B |
|
||
| Retail | 1 | $60B |
|
||
| Technology Distribution | 1 | $58B |
|
||
| Homebuilding | 1 | $35B |
|
||
| Technology Manufacturing | 1 | $35B |
|
||
Price history
-99.4% since first listed3 events — show timeline
- 2026-04-13 Listed for Rent $2,800 NAPLESMLS
- 2026-03-23 Price Changed $429,000 BEARMLS
- 2026-03-03 Listed $440,000 BEARMLS
Property tax history
+75.8%/yrLatest (2025): $6,379 · +115.5% YoY. Source: county tax records.
Cash-flow waterfall
monthlySold comps — $/sqft
last 12 mo · ≤1 miLoading sold comps…