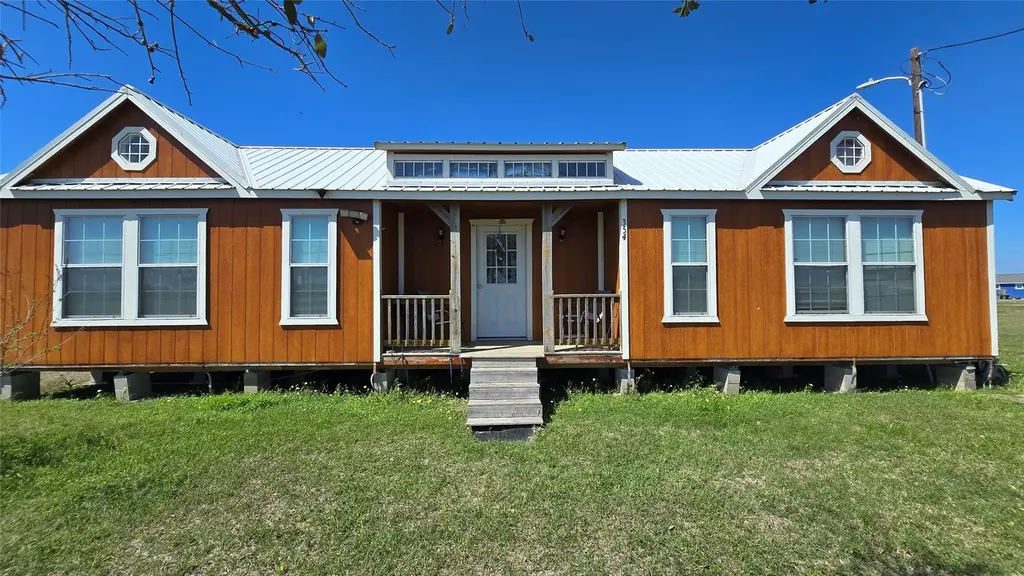
354 Haddock Dr · Palacios, TX
Flood risk No data
- FEMA flood zone
- —
- Chance of flooding over 30 yrs
- —
- Est. flood insurance / yr
- —
Fire risk No data
- Est. fire insurance / yr
- —
Heat risk No data
- Hot days now (above threshold)
- —
- Hot days in 30 yrs
- —
Wind risk No data
- Chance of severe wind over 30 yrs
- —
Air-quality risk No data
- Unhealthy air days now
- —
- Unhealthy air days in 30 yrs
- —
Risk factors via First Street. Map © Google.
Why this score? — see what drove the D+ grade
The composite is a weighted blend of 9 inputs, each scored 0–100. Each bar is that input's sub-score; the figure is the points it added to the 100-point composite (weight × sub-score).
- ARV discount +15.0/15.0
- Cash flow +13.4/30.0
- DSCR +4.0/10.0
- Livability +3.9/5.0
- 1% rule +3.7/10.0
- Schools +3.4/10.0
- Rent growth +2.5/5.0
- Condition / age +2.5/5.0
- Appreciation +0.0/10.0
$110,000
🖨 Deal sheet 📄 Offer letter ✓ Due diligence
Listing remarks MLS
Welcome to Boca Chica in Palacios, TX. Breezy, coastal living at its finest. Now up for sale is this 800 sq ft jewel that sits on a large corner lot. Small home, with huge potential to customize it the way you want it. Most of the items in the house and in the storage will come with the sale including the stove and refrigerator. Blocks away from the water, you can enjoy beautiful sunsets, fishing, and relaxation. Enjoy great amenities of Tri-County Point POA such as a community boat launch, a lighted fishing pier, playground, picnic area, and an outdoor picnic pavilion. Low annual cost. Take a break from the city and come enjoy this peaceful, coastal location. Call for more info or to schedule a showing. Hablo español.
Key facts
- Picnic area
- Large corner lot
- Lighted fishing pier
Tags
Neighborhood map
What this means for you Summary
Snapshot
- This is a 2-bed/1.5-bath single-family listed at $110k.
Deal economics
- At list price, monthly cash flow is $3 ($30/yr) — positive.
- The deal already cash-flows at list — no discount required.
- To meet the 1% rule (rent ≥ 1% of price), the offer needs to be $96k (12.8% below list).
- Recommended offer: $96k (12.8% below list) — sets the bar for 1% rule.
- Cap rate 6.3% vs local median 1.6% in Palacios — top-decile yield for the area; either an underpriced asset or a hidden risk that comps aren't pricing in. Stress-test before assuming the spread holds.
Location & tenants
- Location reads 77/100 on livability (#92 in TX, #3,197 nationally) — a middle-class / working-renter tenant base. Strengths: cost of living A+, housing A+, health & safety A+; Watch: schools D, amenities F, commute F.
- Palacios ISD (town): math 42% / reading 38% proficiency, ranked #427 of 826 in TX (top 52%) — families likely to look elsewhere, expect single-tenant / working-renter base with shorter leases; 61% free/reduced lunch — lower-income household profile, screen leases tightly.
- Market conditions: 432 active listings in the ZIP.
Forward outlook
- Local home prices are declining (-3.0%/yr); year-one equity from $761 of loan paydown is wiped out by about $3k of value loss. Plan a longer hold.
- Jackson County population projected at +28% by 2050 — long-run rental-demand tailwind backs the buy-and-hold thesis.
Negotiation context
- It's been on market 85 days — a 6% lower offer ($103k) is reasonable based on typical stale-listing flexibility.
Questions for the listing agent
- It's been on market 85 days. Have you received any prior offers? Is the seller open to a 13% concession, seller financing, or rate buy-down credit?
- What does the HOA fee cover, when was the last increase, and are there any pending special assessments or reserve-fund shortfalls?
- Why hasn't it sold? Are there any deal-killer items the seller is aware of (foundation, flood, title, zoning, code violations)?
- Is there a deadline driving the sale (1031 exchange, divorce, estate, relocation)? That informs how much negotiation room exists.
- Schools are D-rated, which usually means shorter tenancies and higher turnover. Who's the typical renter profile here, and what's been the actual vacancy rate?
- The area grade is low — what's the realistic commute time and amenity access for the typical tenant pool here? Any planned neighborhood developments (good or bad) we should know about?
- What's the average days-on-market for RENTAL listings here right now (not sales)? A rising rental-DOM trend means longer vacancies and softer asking-rent achievability than the comps imply.
- What's the recent tenant-quality profile in this submarket — average credit score on applications, eviction rate, late-payment / NSF rate, and stable-employment percentage? A property-management company in the area should have these aggregated.
- How much new for-sale + rental construction is in the pipeline within 1–3 miles? Heavy new supply typically softens prices + rents 12–24 months out; constrained supply supports both.
Investment metrics
- 1% rule
- 0.87% ✗
- Cap rate
- 6.32%
- Cash-on-cash
- 0.10%
- DSCR
- 1.00
- GRM
- 9.6
CMA / ARV
- ARV (median comp)
- $151,766
- List price
- $110,000
- Delta
- -27.52%
- Verdict
- UNDERPRICED
- Comps
- 2 within 1.0 mi
Show comp detail 1 sale within ~0.75 mi
| Address | Dist | Beds/Ba | Sqft | Sold | Price | $/sf | Match |
|---|---|---|---|---|---|---|---|
| 315 Tarpon Dr | 0.22mi | 2/2.0 | 836 (+10%) | 9mo | $159,900 | $191 | 63 |
Match score weights: distance 35% · size 25% · config 20% · recency 20%. Top-matched comps best support the ARV.
Projected returns pro-forma
-3.0% appreciation · 3.0% rent growth · sell at horizon
- IRR
- -16.1%
- Equity multiple
- 0.43×
- Total profit
- $-17,653
- Equity at exit
- $16,401
- IRR
- -7.8%
- Equity multiple
- 0.51×
- Total profit
- $-15,119
- Equity at exit
- $9,511
Cash invested: $30,800 (down + closing). Projections, not guarantees.
Landlord ↔ Tenant lean methodology
- Overall (STATE)
- 87 Strongly Landlord-Friendly
- State Texas
- 87 Strongly Landlord-Friendly · R+5
- County
- — inherits STATE
- City
- — inherits STATE
ZIP-level market 77465
- Home prices YoY
- -27.4%
- Active inventory
- 432
- Price-to-rent
- 9.6×
Monthly cashflow live
- Estimated rent
- $959 medium interval (Pro) →
- Mortgage (P&I)
- −$577
- Tax from tax record
- −$115 /mo · $1,377/yr
- Insurance
- −$46
- HOA
- −$18
- Vacancy / Maint / Mgmt
- −$201
- Net cashflow
- $3
Break-even live
UW: 25.0% down · 7.5% · 30yr · 1.5% tax · 5.0% vac · 8.0% maint · 8.0% mgmt
Financing live
Cash to close
- Down payment
- $27,500
- Closing costs
- $3,300
- Reserves months
- —
- Total cash needed
- —
Loan-product check · same deal, 3 products live
Conventional
25% down · 7.5% · 30yr
- Down + closing
- —
- Monthly P&I
- —
- Monthly cashflow
- —
- DSCR
- —
- Eligible?
- —
Personal DTI + credit; lowest rate.
DSCR
20% down · 8.5% · 30yr
- Down + closing
- —
- Monthly P&I
- —
- Monthly cashflow
- —
- DSCR
- —
- Eligible?
- —
No personal income docs; deal must DSCR.
Hard money
10% down · 12.0% · 12mo
- Down + closing
- —
- Monthly P&I
- —
- Monthly cashflow
- —
- DSCR
- —
- Eligible?
- —
Short-term bridge; refi at stabilization.
HOA detail
- Monthly dues
- $18 · $216/yr
- Likely covers
- water
Listing history 20 events
-
2026-06-19days on market $110,000 Active 85 DOM
-
2026-06-18days on market $110,000 Active 84 DOM
-
2026-06-17days on market $110,000 Active 83 DOM
-
2026-06-16days on market $110,000 Active 82 DOM
-
2026-06-15days on market $110,000 Active 81 DOM
-
2026-06-14days on market $110,000 Active 79 DOM
-
2026-06-12days on market $110,000 Active 78 DOM
-
2026-06-09days on market $110,000 Active 75 DOM
-
2026-06-08days on market $110,000 Active 74 DOM
-
2026-06-07days on market $110,000 Active 73 DOM
-
2026-06-07days on market $110,000 Active 72 DOM
-
2026-06-03days on market $110,000 Active 69 DOM
-
2026-06-02days on market $110,000 Active 68 DOM
-
2026-06-01days on market $110,000 Active 67 DOM
-
2026-05-31days on market $110,000 Active 66 DOM
-
2026-05-30days on market $110,000 Active 65 DOM
-
2026-03-17$110,000 Active 735-char remark
Show marketing remark (735 chars)
Welcome to Boca Chica in Palacios, TX. Breezy, coastal living at its finest. Now up for sale is this 800 sq ft jewel that sits on a large corner lot. Small home, with huge potential to customize it the way you want it. Most of the items in the house and in the storage will come with the sale including the stove and refrigerator. Blocks away from the water, you can enjoy beautiful sunsets, fishing, and relaxation. Enjoy great amenities of Tri-County Point POA such as a community boat launch, a lighted fishing pier, playground, picnic area, and an outdoor picnic pavilion. Low annual cost. Take a break from the city and come enjoy this peaceful, coastal location. Call for more info or to schedule a showing. Hablo español.
-
2021-09-28soldstatus
-
2021-02-25soldstatus
-
2019-07-08soldstatus
ⓘ Source: listings_history table (triggers on properties + properties_extension) + one-shot
backfill from property_details.listing_events for pre-trigger history.
Tax reassessment forecast TX · Resets to sale price
- Current annual tax
- $1,377 · $115/mo
- Projected year-2 tax
- $2,013 · $168/mo
- Expected delta
- +$636/yr (+$53/mo · 46.2%)
ⓘ Screening estimate from a state-policy table — verify with the county assessor before closing.
Nearby sold comps map
Loading sold comps map…
Walkable amenities ~0.75 mi
Loading nearby amenities…
Taxation est. · year 1
- Rental income
- $11,513
- − Mortgage interest
- −$6,162
- − Property taxes
- −$1,377
- − Insurance
- −$550
- − Repairs & maintenance
- −$921
- − Management
- −$921
- − HOA
- −$216
- − Depreciation
- −$3,200
- Taxable loss
- −$1,834
- Est. tax savings @ 24.0%
- +$440
- After-tax cash flow
- $470/yr
For passive investors: Depreciation is non-cash, so a rental often shows a tax loss while cash-flowing — sheltering income. Rental losses are passive: they offset passive income freely, and up to $25,000/yr can offset ordinary (W-2) income if you actively participate and your MAGI is under $100k (phasing out to $0 by $150k); unused losses carry forward. On sale, claimed depreciation is recaptured at up to 25%, and gains may owe capital-gains tax (a 1031 exchange can defer both). Figures are a year-1 estimate at your 24.0% rate — not tax advice; consult a CPA.
Schools (NCES district)
- District
- Palacios ISD
- NCES district ID
- 4834020
- Math proficiency
- 42% ▼ -8.00%
- Reading proficiency
- 38% ▼ -8.00%
- Median HH income
- $42,413
- Composite
- 33.79/100
- National rank
- #5365
- State rank
- #427 of 826 in TX
Livability — Palacios
- Score
- 77/100
- State rank
- #92
- US rank
- #3197
Category grades
Schools grade is shown separately in the Schools card above.
Census & demographics
- City population
- 7,267
- Population (ZIP)
- 7,267
Population outlook (Jackson County) Hauer SSP2
- Today (2025)
- 16,579 people
- By 2030
- 17,480 · +5.4%
- By 2040
- 19,328 · +16.6%
- By 2050
- 21,182 · +27.8%
- By 2075
- 25,781 · +55.5%
- By 2100
- 28,184 · +70.0%
Race, ethnicity, and origin ACS 2023
- Neighborhood character
- Diverse neighborhood (Simpson 0.56)
- Race & ethnicity
- Hispanic / Latino 54% White 39% Two or more races 18% Asian 5%
- Hispanic origin (detail)
- Mexican 51%
- Common ancestry
- Lithuanian 3% Serbian 1%
- Foreign-born
- 8% · Canada, Vietnam
- Languages at home
- 63% English-only · Spanish 34% Vietnamese 2%
Political lean MEDSL · Jackson
- 2024 margin
- Solid R (+70.8) · D 14.3% · R 85.1%
- 2008→2024 swing
- -22.9pp toward R · 2008: -47.9pp · 2024: -70.8pp
- All cycles
- 2024: R+70.8 2020: R+66.2 2016: R+63.7 2012: R+56.5 2008: R+47.9
Not yet ingested
- Civics
- —
Market trends
- HPI YoY
- ▼ -56.88%
- Current HPI
- 150.4444
- Rent YoY
- —
- Metro
- —
- State GDP YoY
- ▲ 3.95%
- F500 in state
- 110
Industry mix (Fortune 500 HQ in TX)
| Industry | F500 HQs | Revenue |
|---|---|---|
| Energy | 16 | $1,198B |
|
||
| Technology | 5 | $198B |
|
||
| Engineering / Construction | 4 | $72B |
|
||
| Energy Services | 3 | $60B |
|
||
| Utilities | 3 | $41B |
|
||
| Healthcare | 2 | $330B |
|
||
Price history
4 events — show timeline
- 2026-03-17 Listed $110,000 HARMLS
- 2021-09-28 Sold (Public Records) — Public Records
- 2021-02-25 Sold (Public Records) — Public Records
- 2019-07-08 Sold (Public Records) — Public Records
Property tax history
+20.1%/yrLatest (2025): $1,377 · -0.7% YoY. Source: county tax records.
Cash-flow waterfall
monthlySold comps — $/sqft
last 12 mo · ≤1 miLoading sold comps…