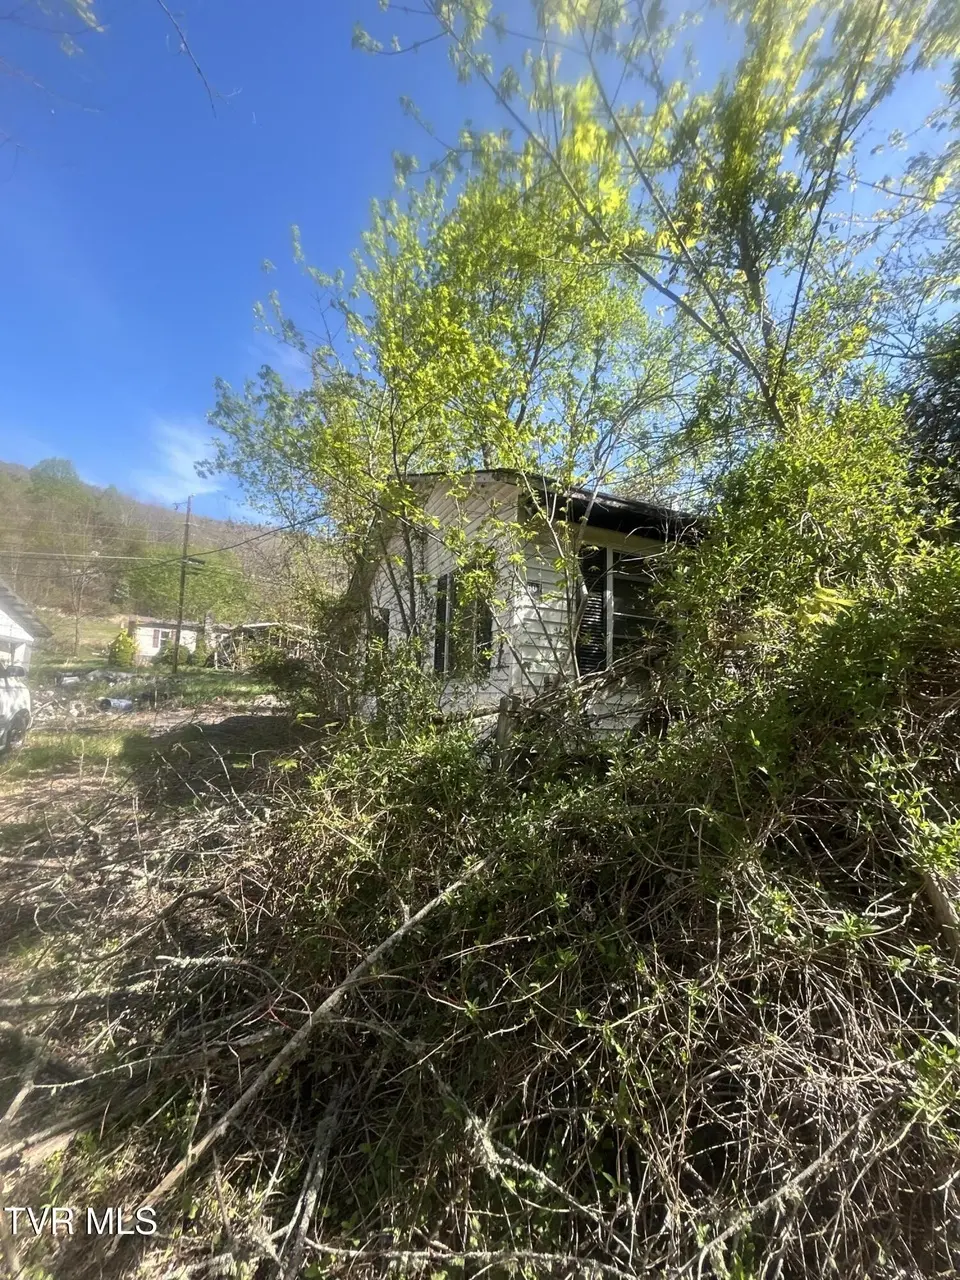
807 Cleghorn Valley Rd · Seven Mile Ford, VA
Flood risk 9/10 · Severe
- FEMA flood zone
- X (unshaded)
- Chance of flooding over 30 yrs
- 0.99%
- Est. flood insurance / yr
- $507 – $1,088
Fire risk 4/10 · Minor
- Est. fire insurance / yr
- $666 – $1,236
Heat risk 3/10 · Minor
- Hot days now (above 92°F)
- 7 days/yr
- Hot days in 30 yrs
- 22 days/yr
Wind risk 2/10 · Minimal
- Chance of severe wind over 30 yrs
- —
Air-quality risk 1/10 · Minimal
- Unhealthy air days now
- 0 days/yr
- Unhealthy air days in 30 yrs
- 0 days/yr
Risk factors via First Street. Map © Google.
Why this score? — see what drove the B- grade
The composite is a weighted blend of 9 inputs, each scored 0–100. Each bar is that input's sub-score; the figure is the points it added to the 100-point composite (weight × sub-score).
- Cash flow +30.0/30.0
- 1% rule +10.0/10.0
- DSCR +10.0/10.0
- ARV discount +7.5/15.0
- Schools +4.5/10.0
- Livability +2.6/5.0
- Rent growth +2.5/5.0
- Condition / age +2.5/5.0
- Appreciation +0.0/10.0
$29,000
🖨 Deal sheet 📄 Offer letter ✓ Due diligence
Listing remarks
NOTICE: HOLD HARMLESS AGREEMENT REQUIRED PRIOR TO viewing property. UNKNOWN CONDITION. Buyer beware!!! All individuals must sign a Hold Harmless Agreement prior to viewing. According to tax records property does have a septic tank septic tank location and condition is unknown. According to tax records property also has a well. Location and condition of the well is unknown. All inspections to be done by buyer at buyer expense. Seller/seller agent will not hold any liabilities. Entry is at your own risk. The Seller and Seller's Agent shall not be held liable for any injuries, damages, or losses incurred while on the premises. This property would be for someone wanting to build a custom hom
Key facts
- Built 1967
- Listed 43 days
Property features AI
Exterior
- Utilities: Water source: see remarks
- Home design: Single-family residence (one story); Residential property; Not in a subdivision; Facing direction: see property remarks
- Construction: House with vinyl siding; Built with additional details: see remarks
- Exterior features: Shingle roof; Level topography
Interior
- Bathrooms: 1 full bathroom
- Heating & cooling: Has heating (details: see remarks)
- Interior features: 5 total rooms; Level interior
Neighborhood map
What this means for you Summary
Snapshot
- This is a 3-bed/1.0-bath single-family listed at $29k.
Deal economics
- At list price, monthly cash flow is $427 ($5k/yr) — positive.
- The deal already cash-flows at list — no discount required.
- Meets the 1% rule at list price ($863 rent vs $29k).
- Recommended offer: $28k (3.0% below list) — sets the bar for market timing.
Location & tenants
- Location reads 52/100 on livability (#537 in VA) — a working-class tenant base; expect higher turnover. Strengths: cost of living A+, crime A; Watch: health & safety C-, amenities F, commute F.
- Smyth County Public School District (rural): math 46% / reading 63% proficiency, ranked #89 of 131 in VA (top 68%) — acceptable for families but not a draw, mixed tenant base, ~2y average lease.
- Zoned schools: Chilhowie Elementary (math 36% / reading 49%, grade F, #862 of 1,108 statewide, top 78%, 543 students, 89% FRL); Chilhowie Middle (math 62% / reading 69%, grade A-, #116 of 342 statewide, top 35%, 306 students, 70% FRL); Chilhowie High (math 62% / reading 82%, grade B+, #134 of 319 statewide, top 45%, 393 students, 64% FRL) — zoned schools average 74% FRL vs 54% district-wide (20 pts higher); higher-poverty schools than district average — tighter screening recommended.
- Market conditions: 86 active listings in the ZIP; 38 units permitted in Smyth County in 2024 (0 in 5+ unit buildings).
Forward outlook
- Local home prices are declining (-3.0%/yr); year-one equity from $200 of loan paydown is wiped out by about $870 of value loss. Plan a longer hold.
- Smyth County population projected at -20% by 2050 — secular population decline; favor cash flow + early exit over multi-decade hold.
- At projected returns (-3.0% appreciation + 3.0% rent growth), your $8k cash investment doubles in ~2 years — after that, you're playing with house money.
Negotiation context
- It's been on market 43 days — a 3% lower offer ($28k) is reasonable based on typical stale-listing flexibility.
- 2 sale attempts since 19y ago with the ask held roughly flat each time — persistent listings suggest the price (not the market) is what's stuck; bring a comps-based counter.
Risks & watch-outs
- Watch-outs: flood insurance adds $66/mo.
- Climate carrying-cost: severe flood risk — expect insurance premiums to compound above CPI over the hold.
Questions for the listing agent
- It's been on market 43 days. Have you received any prior offers? Is the seller open to a 3% concession, seller financing, or rate buy-down credit?
- Built in 1967 — when were the roof, HVAC, electrical panel, plumbing, and water heater last replaced?
- What's the actual annual flood-insurance premium (NFIP or private), and is the property in a SFHA with mandatory coverage?
- Is there a deadline driving the sale (1031 exchange, divorce, estate, relocation)? That informs how much negotiation room exists.
- Schools are F-rated, which usually means shorter tenancies and higher turnover. Who's the typical renter profile here, and what's been the actual vacancy rate?
- What's the average days-on-market for RENTAL listings here right now (not sales)? A rising rental-DOM trend means longer vacancies and softer asking-rent achievability than the comps imply.
- What's the recent tenant-quality profile in this submarket — average credit score on applications, eviction rate, late-payment / NSF rate, and stable-employment percentage? A property-management company in the area should have these aggregated.
- How much new for-sale + rental construction is in the pipeline within 1–3 miles? Heavy new supply typically softens prices + rents 12–24 months out; constrained supply supports both.
Investment metrics
- 1% rule
- 2.97% ✓
- Cap rate
- 26.71%
- Cash-on-cash
- 72.94%
- DSCR
- 4.25
- GRM
- 2.8
CMA / ARV
- ARV (median comp)
- $127,618
- List price
- $29,000
- Delta
- -77.28%
- Verdict
- UNDERPRICED
- Comps
- 5 within 1.0 mi
Projected returns pro-forma
-3.0% appreciation · 3.0% rent growth · sell at horizon
- IRR
- 62.2%
- Equity multiple
- 3.78×
- Total profit
- $22,547
- Equity at exit
- $4,324
- IRR
- 66.7%
- Equity multiple
- 7.75×
- Total profit
- $54,846
- Equity at exit
- $2,507
Cash invested: $8,120 (down + closing). Projections, not guarantees.
Landlord ↔ Tenant lean methodology
- Overall (STATE)
- 55 Moderately Landlord-Leaning
- State Virginia
- 55 Moderately Landlord-Leaning · D+2
- County
- — inherits STATE
- City
- — inherits STATE
ZIP-level market 24354
- Home prices YoY
- -6.8%
- Active inventory
- 86
- Price-to-rent
- 2.8×
Monthly cashflow live
- Estimated rent
- $863 medium interval (Pro) →
- Mortgage (P&I)
- −$152
- Tax from tax record
- −$24 /mo · $284/yr
- Insurance
- −$12
- Flood insurance flood zone
- −$66 /mo · $798/yr
- HOA
- −$0
- Vacancy / Maint / Mgmt
- −$181
- Net cashflow
- $427
Break-even live
UW: 25.0% down · 7.5% · 30yr · 1.5% tax · 5.0% vac · 8.0% maint · 8.0% mgmt
Financing live
Cash to close
- Down payment
- $7,250
- Closing costs
- $870
- Reserves months
- —
- Total cash needed
- —
Loan-product check · same deal, 3 products live
Conventional
25% down · 7.5% · 30yr
- Down + closing
- —
- Monthly P&I
- —
- Monthly cashflow
- —
- DSCR
- —
- Eligible?
- —
Personal DTI + credit; lowest rate.
DSCR
20% down · 8.5% · 30yr
- Down + closing
- —
- Monthly P&I
- —
- Monthly cashflow
- —
- DSCR
- —
- Eligible?
- —
No personal income docs; deal must DSCR.
Hard money
10% down · 12.0% · 12mo
- Down + closing
- —
- Monthly P&I
- —
- Monthly cashflow
- —
- DSCR
- —
- Eligible?
- —
Short-term bridge; refi at stabilization.
Listing history 18 events
-
2026-06-18days on market $29,000 Active 43 DOM
-
2026-06-17days on market $29,000 Active 42 DOM
-
2026-06-16days on market $29,000 Active 41 DOM
-
2026-06-15days on market $29,000 Active 40 DOM
-
2026-06-15days on market $29,000 Active 39 DOM
-
2026-06-13days on market $29,000 Active 38 DOM
-
2026-06-12days on market $29,000 Active 37 DOM
-
2026-06-09days on market $29,000 Active 34 DOM
-
2026-06-08days on market $29,000 Active 33 DOM
-
2026-06-08days on market $29,000 Active 32 DOM
-
2026-06-07remarks 699-char remark
-
2026-06-07days on market $29,000 Active 31 DOM
-
2026-06-03days on market $29,000 Active 28 DOM
-
2026-06-02days on market $29,000 Active 27 DOM
-
2026-06-01days on market $29,000 Active 26 DOM
-
2026-05-31days on market $29,000 Active 25 DOM
-
2026-05-06$29,000 Active 528-char remark
-
2007-01-22$57,200
ⓘ Source: listings_history table (triggers on properties + properties_extension) + one-shot
backfill from property_details.listing_events for pre-trigger history.
Tax reassessment forecast VA · Resets to sale price
- Current annual tax
- $284 · $24/mo
- Projected year-2 tax
- $284 · $24/mo
- Expected delta
- $0/yr ($0/mo · 0.0%)
ⓘ Screening estimate from a state-policy table — verify with the county assessor before closing.
Climate risk First Street
- Flood 9/10 Extreme FEMA zone X (unshaded) · 99% chance over 30 yrs
- Wildfire 4/10 Moderate
- Heat 3/10 Moderate 7 d/yr ≥92°F today · 22 d/yr by 30 yrs out
- Wind 2/10 Low
- Air quality 1/10 Low 0 unhealthy d/yr today · 0 by 30 yrs out
Nearby sold comps map
Loading sold comps map…
Walkable amenities ~0.75 mi
Loading nearby amenities…
Taxation est. · year 1
- Rental income
- $10,350
- − Mortgage interest
- −$1,624
- − Property taxes
- −$284
- − Insurance
- −$942
- − Repairs & maintenance
- −$828
- − Management
- −$828
- − Depreciation
- −$844
- Taxable income
- $4,999
- Est. tax owed @ 24.0%
- −$1,200
- After-tax cash flow
- $3,925/yr
For passive investors: Depreciation is non-cash, so a rental often shows a tax loss while cash-flowing — sheltering income. Rental losses are passive: they offset passive income freely, and up to $25,000/yr can offset ordinary (W-2) income if you actively participate and your MAGI is under $100k (phasing out to $0 by $150k); unused losses carry forward. On sale, claimed depreciation is recaptured at up to 25%, and gains may owe capital-gains tax (a 1031 exchange can defer both). Figures are a year-1 estimate at your 24.0% rate — not tax advice; consult a CPA.
Schools (NCES district)
- District
- Smyth County Public School District
- NCES district ID
- 5103520
- Math proficiency
- 46% ▼ -38.00%
- Reading proficiency
- 63% ▼ -14.00%
- Median HH income
- $36,901
- Composite
- 45.2/100
- National rank
- #2672
- State rank
- #89 of 131 in VA
Livability — Seven Mile Ford
- Score
- 52/100
- State rank
- #537
- US rank
- #24811
Category grades
Schools grade is shown separately in the Schools card above.
Census & demographics
- Population (ZIP)
- 12,984
Population outlook (Smyth County) Hauer SSP2
- Today (2025)
- 29,740 people
- By 2030
- 28,593 · -3.9%
- By 2040
- 26,091 · -12.3%
- By 2050
- 23,629 · -20.5%
- By 2075
- 18,365 · -38.2%
- By 2100
- 13,697 · -53.9%
Race, ethnicity, and origin ACS 2023
- Neighborhood character
- Predominantly White (93%)
- Race & ethnicity
- White 93% Black 3% Two or more races 3% Hispanic / Latino 1%
- Common ancestry
- Serbian 3% Slovak 2% Italian 1%
- Foreign-born
- 1% · Canada
- Languages at home
- 99% English-only · Spanish 1%
Political lean MEDSL · Smyth
- 2024 margin
- Solid R (+60.5) · D 19.4% · R 79.9%
- 2008→2024 swing
- -31.4pp toward R · 2008: -29.1pp · 2024: -60.5pp
- All cycles
- 2024: R+60.5 2020: R+56.3 2016: R+55.2 2012: R+33.0 2008: R+29.1
Not yet ingested
- Civics
- —
Market trends
- HPI YoY
- ▼ -19.22%
- Current HPI
- 265.5586
- Rent YoY
- —
- Metro
- —
- State GDP YoY
- ▲ 2.40%
- F500 in state
- 50
Industry mix (Fortune 500 HQ in VA)
| Industry | F500 HQs | Revenue |
|---|---|---|
| Aerospace / Defense | 4 | $236B |
|
||
| Technology / Defense | 3 | $32B |
|
||
| Financial Services | 2 | $176B |
|
||
| Utilities | 2 | $27B |
|
||
| Insurance | 2 | $25B |
|
||
| Technology | 2 | $15B |
|
||
Price history
-49.3% since first listed2 events — show timeline
- 2026-05-06 Listed $29,000 TVRMLS
- 2007-01-22 Listed $57,200 SWVAR
Property tax history
+0.1%/yrLatest (2025): $284 · +0.0% YoY. Source: county tax records.
Cash-flow waterfall
monthlySold comps — $/sqft
last 12 mo · ≤1 miLoading sold comps…