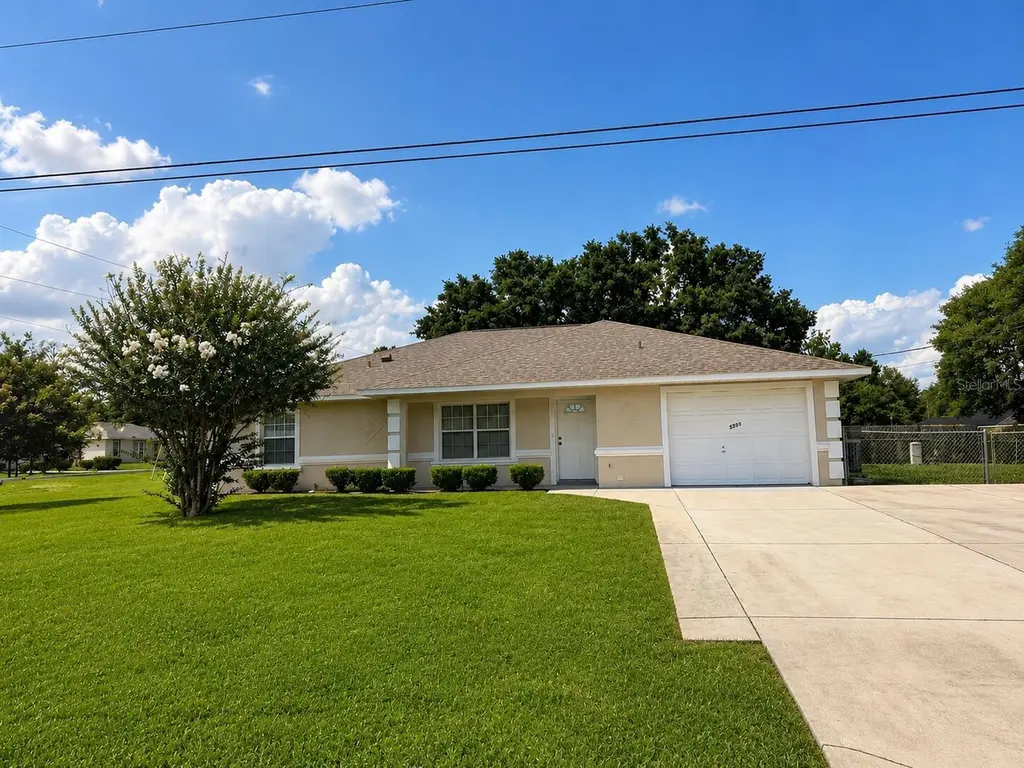
5921 Pecan Rd · Silver Springs Shores, FL
Flood risk 1/10 · Minimal
- FEMA flood zone
- X (unshaded)
- Chance of flooding over 30 yrs
- 0.0%
- Est. flood insurance / yr
- $507 – $1,088
Fire risk 4/10 · Minor
- Est. fire insurance / yr
- $947 – $1,759
Heat risk 8/10 · Major
- Hot days now (above 108°F)
- 7 days/yr
- Hot days in 30 yrs
- 22 days/yr
Wind risk 9/10 · Severe
- Chance of severe wind over 30 yrs
- 99.0%
Air-quality risk 3/10 · Minor
- Unhealthy air days now
- 3 days/yr
- Unhealthy air days in 30 yrs
- 4 days/yr
Risk factors via First Street. Map © Google.
Why this score? — see what drove the D grade
The composite is a weighted blend of 9 inputs, each scored 0–100. Each bar is that input's sub-score; the figure is the points it added to the 100-point composite (weight × sub-score).
- ARV discount +8.6/15.0
- Cash flow +8.2/30.0
- Appreciation +8.0/10.0
- Schools +3.6/10.0
- Livability +3.4/5.0
- 1% rule +2.5/10.0
- Rent growth +2.5/5.0
- Condition / age +2.5/5.0
- DSCR +2.2/10.0
$239,000
🖨 Deal sheet 📄 Offer letter ✓ Due diligence
Listing remarks
Welcome to this Beautiful Gem of a home . When you walk inside you will be greeted by the Lovely living room with Cathedral Ceilings which gives it a larger layout and sunlight with Dining Area and Extra Room which can be used as Main Dining or Sun Room etc. Followed by Master Bedroom with Stand Up Shower and 2 Spacious Size Bedrooms with Ample Closet Spaces and Full Bathroom. Also Features Screened in Lanai to Enjoy your Morning Coffee and not too mention lovely yard lot size. Freshly Painted Exterior. Ample Driveway size with Extra Area Space for many more Vehicles. Roof was done New in 2020 . Enclosed Chain link Fence. Home has lots to enjoy with great layout. And very ideal location Clo
Key facts
- Large driveway
- Screened lanai
- Walk-in closets
Tags
Property features AI
Finance
- Other: Property is residential, R1 zoning; Lot roughly 0.26 acres (about 1/4 to less than 1/2 acre)
- HOA & community: Not in a development; Pets allowed
Exterior
- Parking: Attached garage with 1 garage space
- Utilities: Well water; Septic tank; Electricity connected; Water available
- Home design: Single family residence; One level; Property faces southeast
- Construction: Brick construction; Shingle roof; Slab foundation
- Exterior features: Other exterior features; Paved road access; Street lights in the community
Interior
- Kitchen: Dishwasher; Range; Refrigerator
- Bedrooms: 3 bedrooms
- Flooring: Laminate flooring; Tile flooring
- Bathrooms: 2 full bathrooms
- Heating & cooling: Electric heating; Heat pump; Central air conditioning
- Interior features: Cathedral ceilings; Ceiling fans; Thermostat
- Laundry & utility: Indoor laundry
Neighborhood map
What this means for you Summary
Snapshot
- This is a 3-bed/2.0-bath single-family listed at $239k.
Deal economics
- At list price, monthly cash flow is $-227 ($-3k/yr) — negative.
- To cash-flow at today's rent, offer at most $199k (16.8% below list).
- To meet the 1% rule (rent ≥ 1% of price), the offer needs to be $178k (25.4% below list).
- Recommended offer: $178k (25.4% below list) — sets the bar for 1% rule.
Location & tenants
- Location reads 68/100 on livability (#527 in FL) — a middle-class / working-renter tenant base. Strengths: cost of living A+, housing A+, health & safety A-; Watch: crime C-, employment D, amenities F.
- Marion (rural): math 42% / reading 43% proficiency, ranked #61 of 73 in FL (top 84%) — families likely to look elsewhere, expect single-tenant / working-renter base with shorter leases; 61% free/reduced lunch — lower-income household profile, screen leases tightly.
- Zoned schools: Greenway Elementary School (math 33% / reading 35%, grade F, #1,744 of 2,144 statewide, top 82%, 736 students, 67% FRL); Forest High School (math 36% / reading 54%, grade D-, #228 of 667 statewide, top 35%, 2,325 students, 42% FRL).
- Market conditions: Rents flat; 674 active listings in the ZIP; 20 comparable units currently listed for rent nearby; rentals at typical pace (median 21d on market — plan ~3-4 weeks tenant-placement turnaround); 7,071 units permitted in Marion County in 2024 (534 in 5+ unit buildings).
- This rent runs 33% of the median local income ($64k/yr) — at the standard rent-burdened threshold; future hikes will face affordability resistance.
Forward outlook
- In year one you build about $16k of equity ($2k loan paydown + $14k appreciation (5.9% local appreciation)).
- Marion County population projected at +13% by 2050 — modest demand growth; plan on rents tracking national, not racing it.
- By year 3, paydown + projected appreciation supports a ~$39k cash-out refi (75% LTV) — recoverable capital for the next deal without selling this one.
Negotiation context
- It's been on market 17 days — a 2% lower offer ($235k) is reasonable based on typical stale-listing flexibility.
- 2 sale attempts since 19y ago with the ask held roughly flat each time — persistent listings suggest the price (not the market) is what's stuck; bring a comps-based counter.
- Current owner paid $82k; list at $239k implies a 191% gain — meaningful room to come down on a strong offer.
Risks & watch-outs
- Climate carrying-cost: severe wind risk, 99% chance of damaging wind over 30y; extreme-heat days projected 7→22/yr by 2055 (HVAC capex compounding) — expect insurance premiums to compound above CPI over the hold.
Questions for the listing agent
- What do current leases actually rent for vs. the listed asking? Can we see a recent rent roll and the last 12 months of T-12 income?
- Is there a deadline driving the sale (1031 exchange, divorce, estate, relocation)? That informs how much negotiation room exists.
- Schools are F-rated, which usually means shorter tenancies and higher turnover. Who's the typical renter profile here, and what's been the actual vacancy rate?
- The area grade is low — what's the realistic commute time and amenity access for the typical tenant pool here? Any planned neighborhood developments (good or bad) we should know about?
- What's the average days-on-market for RENTAL listings here right now (not sales)? A rising rental-DOM trend means longer vacancies and softer asking-rent achievability than the comps imply.
- What's the recent tenant-quality profile in this submarket — average credit score on applications, eviction rate, late-payment / NSF rate, and stable-employment percentage? A property-management company in the area should have these aggregated.
- How much new for-sale + rental construction is in the pipeline within 1–3 miles? Heavy new supply typically softens prices + rents 12–24 months out; constrained supply supports both.
Investment metrics
- 1% rule
- 0.75% ✗
- Cap rate
- 5.15%
- Cash-on-cash
- -4.07%
- DSCR
- 0.82
- GRM
- 11.2
CMA / ARV
- ARV (on-the-fly)
- $245,175
- Comps found
- 12
Show comp detail 12 sales within ~0.75 mi
| Address | Dist | Beds/Ba | Sqft | Sold | Price | $/sf | Match |
|---|---|---|---|---|---|---|---|
| 28 Pecan Course Loop | 0.15mi | 3/2.0 | 1,332 (-5%) | 9mo | $250,000 | $188 | 77 |
| 7 Pecan Course Trce | 0.25mi | 3/2.0 | 1,330 (-5%) | 7mo | $228,000 | $171 | 74 |
| 156 Pecan Dr | 0.55mi | 3/2.0 | 1,390 (-1%) | 5mo | $250,000 | $180 | 69 |
| 5545 SE 70th Ave | 0.65mi | 3/2.0 | 1,380 (-2%) | 3mo | $244,800 | $177 | 65 |
| 52 Pecan Dr | 0.61mi | 3/2.0 | 1,458 (+4%) | 8mo | $255,000 | $175 | 58 |
| 6940 Hemlock Rd | 0.65mi | 3/2.0 | 1,454 (+4%) | 7mo | $287,000 | $197 | 57 |
| 6 Pecan Run Pl | 0.61mi | 3/2.0 | 1,320 (-6%) | 6mo | $220,000 | $167 | 57 |
| 2 Pecan Pl | 0.73mi | 3/2.0 | 1,440 (+3%) | 6mo | $270,000 | $188 | 56 |
| 81 Pecan Dr | 0.58mi | 2/2.0 (-1) | 1,278 (-9%) | 1mo | $215,000 | $168 | 52 |
| 19 Hemlock Terrace Way | 0.38mi | 3/2.0 | 1,595 (+14%) | 11mo | $203,000 | $127 | 50 |
| 6940 SE 52nd St | 0.41mi | 4/2.0 (+1) | 1,602 (+14%) | 3mo | $240,000 | $150 | 49 |
| 4 Redwood Trace Ct | 0.58mi | 3/2.0 | 1,594 (+14%) | 2mo | $255,000 | $160 | 48 |
Match score weights: distance 35% · size 25% · config 20% · recency 20%. Top-matched comps best support the ARV.
Projected returns pro-forma
5.93% appreciation · 0.17% rent growth · sell at horizon
- IRR
- 10.9%
- Equity multiple
- 1.73×
- Total profit
- $48,653
- Equity at exit
- $149,228
- IRR
- 11.1%
- Equity multiple
- 3.18×
- Total profit
- $145,800
- Equity at exit
- $269,743
Cash invested: $66,920 (down + closing). Projections, not guarantees.
Landlord ↔ Tenant lean methodology
- Overall (STATE)
- 87 Strongly Landlord-Friendly
- State Florida
- 87 Strongly Landlord-Friendly · R+3
- County
- — inherits STATE
- City
- — inherits STATE
ZIP-level market 34472
- Home prices YoY
- 2.4%
- Rents YoY
- 0.2%
- Active inventory
- 674
- Price-to-rent
- 11.2×
Monthly cashflow live
- Estimated rent
- $1,784 high interval (Pro) →
- Mortgage (P&I)
- −$1,253
- Tax from tax record
- −$284 /mo · $3,405/yr
- Insurance
- −$100
- HOA
- −$0
- Vacancy / Maint / Mgmt
- −$375
- Net cashflow
- $-227
Break-even live
UW: 25.0% down · 7.5% · 30yr · 1.5% tax · 5.0% vac · 8.0% maint · 8.0% mgmt
Financing live
Cash to close
- Down payment
- $59,750
- Closing costs
- $7,170
- Reserves months
- —
- Total cash needed
- —
Loan-product check · same deal, 3 products live
Conventional
25% down · 7.5% · 30yr
- Down + closing
- —
- Monthly P&I
- —
- Monthly cashflow
- —
- DSCR
- —
- Eligible?
- —
Personal DTI + credit; lowest rate.
DSCR
20% down · 8.5% · 30yr
- Down + closing
- —
- Monthly P&I
- —
- Monthly cashflow
- —
- DSCR
- —
- Eligible?
- —
No personal income docs; deal must DSCR.
Hard money
10% down · 12.0% · 12mo
- Down + closing
- —
- Monthly P&I
- —
- Monthly cashflow
- —
- DSCR
- —
- Eligible?
- —
Short-term bridge; refi at stabilization.
Rent comps 20 comps
| Address | Beds | Baths | Sqft | Rent | $/sqft | DOM | Units | Dist |
|---|---|---|---|---|---|---|---|---|
| 6875 SE 52nd St Ocala, FL | 3.0 | 2.0 | 1624 | $1,750 | $1.08 | 21d | 1 | 0.40mi |
| 13 Redwood Trace Ln Ocala, FL | 3.0 | 2.0 | 1337 | $1,595 | $1.19 | 21d | 1 | 0.42mi |
| 5614 Pecan Rd Ocala, FL | 3.0 | 2.0 | 1337 | $1,595 | $1.19 | 21d | 1 | 0.74mi |
| 45 Redwood Run Ocala, FL | 3.0 | 2.0 | 1435 | $1,695 | $1.18 | 21d | 1 | 0.85mi |
| 7044 Hemlock Crse Ocala, FL | 3.0 | 2.0 | 1270 | $1,897 | $1.49 | 13d | 1 | 0.90mi |
| 19 Pecan Pass Ter Ocala, FL | 3.0 | 2.0 | 1368 | $1,750 | $1.28 | 21d | 1 | 0.90mi |
| 9 Dogwood Trail Dr Ocala, FL | 3.0 | 2.0 | 1110 | $1,595 | $1.44 | 21d | 1 | 1.05mi |
| 98 Dogwood Drive Cir Ocala, FL | 3.0 | 2.0 | 1337 | $1,695 | $1.27 | 21d | 1 | 1.06mi |
| 36 Pecan Run Crse Ocala, FL | 3.0 | 2.0 | 1188 | $1,850 | $1.56 | 13d | 1 | 1.14mi |
| 96 Redwood Rd Ocala, FL | 3.0 | 2.0 | 1188 | $1,650 | $1.39 | 13d | 1 | 1.18mi |
| 7215 Midway Ter Ocala, FL | 2.0 | 2.0 | 975 | $1,175 | $1.21 | 21d | 1 | 1.21mi |
| 106 Redwood Track Crse Ocala, FL | 3.0 | 2.0 | 1412 | $1,675 | $1.19 | 13d | 1 | 1.24mi |
| 492 Hickory Course Loop Ocala, FL | 4.0 | 2.0 | 1483 | $1,750 | $1.18 | 21d | 1 | 1.26mi |
| 6 Cedar Dr Ocala, FL | 3.0 | 2.0 | 1477 | $1,675 | $1.13 | 21d | 1 | 1.31mi |
| 88 Dogwood Drive Loop Ocala, FL | 3.0 | 2.0 | 1659 | $1,600 | $0.96 | 21d | 1 | 1.31mi |
| 149 Hickory Course Cir Ocala, FL | 4.0 | 2.0 | 1827 | $2,100 | $1.15 | 13d | 1 | 1.34mi |
| 21 Dogwood Drive Pass Ocala, FL | 3.0 | 2.0 | 1390 | $1,595 | $1.15 | 21d | 1 | 1.37mi |
| 136 Hickory Course Loop Ocala, FL | 4.0 | 2.0 | 1828 | $1,990 | $1.09 | 13d | 1 | 1.41mi |
| 57 Pine Cir Ocala, FL | 3.0 | 2.0 | 1270 | $1,897 | $1.49 | 13d | 1 | 1.44mi |
| 9 Banyan Course Run Ocala, FL | 3.0 | 2.0 | 1345 | $1,599 | $1.19 | 21d | 1 | 1.46mi |
Listing history 13 events
-
2026-06-18days on market $239,000 Active 17 DOM
-
2026-06-17days on market $239,000 Active 16 DOM
-
2026-06-16days on market $239,000 Active 15 DOM
-
2026-06-15days on market $239,000 Active 14 DOM
-
2026-06-14days on market $239,000 Active 12 DOM
-
2026-06-13days on market $239,000 Active 11 DOM
-
2026-06-10days on market $239,000 Active 9 DOM
-
2026-06-09days on market $239,000 Active 8 DOM
-
2026-06-08days on market $239,000 Active 7 DOM
-
2026-06-07days on market $239,000 Active 6 DOM
-
2026-06-03days on market $239,000 Active 2 DOM
-
2026-06-01remarks 699-char remark
-
2026-06-01$239,000 Active 1 DOM
ⓘ Source: listings_history table (triggers on properties + properties_extension) + one-shot
backfill from property_details.listing_events for pre-trigger history.
Tax reassessment forecast FL · Resets to sale price
- Current annual tax
- $3,405 · $284/mo
- Projected year-2 tax
- $3,405 · $284/mo
- Expected delta
- $0/yr ($0/mo · 0.0%)
ⓘ Screening estimate from a state-policy table — verify with the county assessor before closing.
Climate risk First Street
- Flood 1/10 Low FEMA zone X (unshaded) · 0% chance over 30 yrs
- Wildfire 4/10 Moderate
- Heat 8/10 Severe 7 d/yr ≥108°F today · 22 d/yr by 30 yrs out
- Wind 9/10 Extreme 99% chance of damaging wind over 30 yrs
- Air quality 3/10 Moderate 3 unhealthy d/yr today · 4 by 30 yrs out
Nearby sold comps map
Loading sold comps map…
Walkable amenities ~0.75 mi
Loading nearby amenities…
Taxation est. · year 1
- Rental income
- $21,409
- − Mortgage interest
- −$13,388
- − Property taxes
- −$3,405
- − Insurance
- −$1,195
- − Repairs & maintenance
- −$1,713
- − Management
- −$1,713
- − Depreciation
- −$6,953
- Taxable loss
- −$6,957
- Est. tax savings @ 24.0%
- +$1,670
- After-tax cash flow
- $-1,057/yr
For passive investors: Depreciation is non-cash, so a rental often shows a tax loss while cash-flowing — sheltering income. Rental losses are passive: they offset passive income freely, and up to $25,000/yr can offset ordinary (W-2) income if you actively participate and your MAGI is under $100k (phasing out to $0 by $150k); unused losses carry forward. On sale, claimed depreciation is recaptured at up to 25%, and gains may owe capital-gains tax (a 1031 exchange can defer both). Figures are a year-1 estimate at your 24.0% rate — not tax advice; consult a CPA.
Schools (NCES district)
- District
- Marion
- NCES district ID
- 1201260
- Math proficiency
- 42% ▼ -7.00%
- Reading proficiency
- 43% ▼ -4.00%
- Median HH income
- $40,015
- Composite
- 35.61/100
- National rank
- #4890
- State rank
- #61 of 73 in FL
Livability — Silver Springs Shores
- Score
- 68/100
- State rank
- #527
- US rank
- #9854
Category grades
Schools grade is shown separately in the Schools card above.
Census & demographics
- Census place
- Silver Springs Shores, FL
- County
- Marion County · 315,796 people
- City population
- 34,665
- Metro
- Ocala, FL
- Population (ZIP)
- 35,851
- Household income
- $64,208
- Rent vs Own
- Severe rent burden
- 655.0
Population outlook (Marion County) Hauer SSP2
- Today (2025)
- 365,905 people
- By 2030
- 376,768 · +3.0%
- By 2040
- 396,555 · +8.4%
- By 2050
- 412,723 · +12.8%
- By 2075
- 446,090 · +21.9%
- By 2100
- 436,193 · +19.2%
Race, ethnicity, and origin ACS 2023
- Neighborhood character
- Diverse neighborhood (Simpson 0.65)
- Race & ethnicity
- White 50% Hispanic / Latino 25% Black 21% Two or more races 18% Asian 2%
- Hispanic origin (detail)
- Mexican 2% Puerto Rican 14% Cuban 3%
- Common ancestry
- Romanian 2% Iranian 1% Lithuanian 1%
- Foreign-born
- 11% · Canada, Jamaica, China
- Languages at home
- 78% English-only · Spanish 19% Other Indo-European 1%
Political lean MEDSL · Marion
- 2024 margin
- Solid R (+31.6) · D 33.8% · R 65.5%
- 2008→2024 swing
- -20.0pp toward R · 2008: -11.6pp · 2024: -31.6pp
- All cycles
- 2024: R+31.6 2020: R+25.9 2016: R+26.2 2012: R+16.2 2008: R+11.6
Not yet ingested
- Civics
- —
Market trends
- HPI YoY
- ▲ 5.93%
- Current HPI
- 255.0714
- Rent YoY
- ▲ 0.17%
- Metro
- Ocala, FL
- State GDP YoY
- ▲ 3.28%
- F500 in state
- 36
Industry mix (Fortune 500 HQ in FL)
| Industry | F500 HQs | Revenue |
|---|---|---|
| Industrial Technology | 2 | $29B |
|
||
| Insurance | 2 | $17B |
|
||
| Retail | 1 | $60B |
|
||
| Technology Distribution | 1 | $58B |
|
||
| Homebuilding | 1 | $35B |
|
||
| Technology Manufacturing | 1 | $35B |
|
||
Price history
+227.8% since first listed5 events — show timeline
- 2026-06-01 Listed $239,000 Stellar MLS as Distributed by MLS Grid
- 2008-04-30 Listing Removed — Stellar MLS as Distributed by MLS Grid
- 2007-10-29 Listed $147,000 Stellar MLS as Distributed by MLS Grid
- 2003-05-19 Sold (Public Records) $82,000 Public Records
- 2000-03-02 Sold (Public Records) $72,900 Public Records
Property tax history
+13.9%/yrLatest (2025): $3,405 · +14.4% YoY. Source: county tax records.
Cash-flow waterfall
monthlySold comps — $/sqft
last 12 mo · ≤1 miLoading sold comps…