 Multi-family
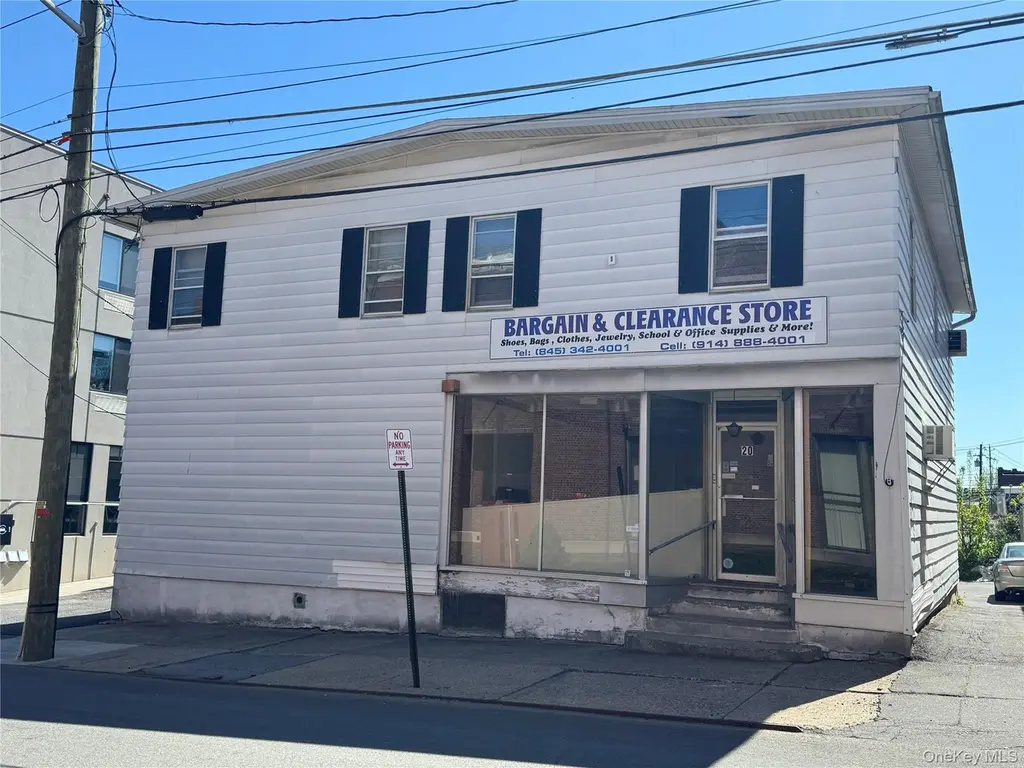
20 John St · Middletown, NY
Flood risk No data
- FEMA flood zone
- —
- Chance of flooding over 30 yrs
- —
- Est. flood insurance / yr
- —
Fire risk No data
- Est. fire insurance / yr
- —
Heat risk No data
- Hot days now (above threshold)
- —
- Hot days in 30 yrs
- —
Wind risk No data
- Chance of severe wind over 30 yrs
- —
Air-quality risk No data
- Unhealthy air days now
- —
- Unhealthy air days in 30 yrs
- —
Risk factors via First Street. Map © Google.
Why this score? — see what drove the C+ grade
The composite is a weighted blend of 9 inputs, each scored 0–100. Each bar is that input's sub-score; the figure is the points it added to the 100-point composite (weight × sub-score).
- Cash flow +25.5/30.0
- DSCR +8.4/10.0
- ARV discount +7.5/15.0
- 1% rule +6.7/10.0
- Rent growth +4.6/5.0
- Schools +4.2/10.0
- Livability +4.1/5.0
- Condition / age +2.2/5.0
- Appreciation +0.0/10.0
$575,000
🖨 Deal sheet (PDF) 📄 Offer letter ✓ Due diligence
Multi-family units
County records classify this as Multi-Family (2-4 Unit). Listing-text estimate: 1 unit. estimate disagrees with records
Listing remarks
For Sale: Income-Producing Mixed-Use Building in Prime Downtown Middletown Take advantage of this exceptional opportunity to own a versatile, income-generating property in the heart of Downtown Middletown—an up-and-coming city with a pro-business government and strong growth potential. Property Overview: First Floor: Spacious 2,000 sq. ft. commercial space, currently used as a retail store, office, and storage area, plus a large multi-purpose room perfect for meetings, events, or classes Includes a full bathroom, retail front entrance, and private rear access Flexible layout offers potential for multiple businesses or tenants Second Floor: Two fully rented residential apartments:
Key facts
- Multi purpose room
- Mixed use building
- Private parking lot
Tags
Property features AI
Exterior
- Parking: Three parking spaces; Off-street, private parking lot
- Utilities: Electric service by Orange & Rockland; Public sewer; Electricity available
- Home design: Triplex
- Construction: Frame construction; Brick/mortar and stone foundation
- Exterior features: Level lot
Interior
- Bedrooms: One 1-bedroom unit; One 2-bedroom unit
- Bathrooms: Three full bathrooms (total)
- Heating & cooling: Baseboard heating; Natural gas heating; Other heating
- Interior features: Other interior features
Neighborhood map
What this means for you Summary
Snapshot
- This is a 3-bed/3.0-bath multifamily listed at $575k. Condition is rated fair.
Deal economics
- At list price, monthly cash flow is $1k ($16k/yr) — positive.
- The deal already cash-flows at list — no discount required.
- Meets the 1% rule at list price ($7k rent vs $575k).
- Recommended offer: $558k (3.0% below list) — sets the bar for market timing.
- Cap rate 9.1% vs local median 3.3% in Middletown — top-decile yield for the area; either an underpriced asset or a hidden risk that comps aren't pricing in. Stress-test before assuming the spread holds.
Location & tenants
- Location reads 82/100 on livability (#79 in NY, #1,219 nationally) — a professional / high-income tenant draw. Strengths: amenities A+, housing A+, health & safety A+; Watch: commute C-.
- Middletown City School District (suburban): math 41% / reading 55% proficiency, ranked #411 of 590 in NY (top 70%) — families likely to look elsewhere, expect single-tenant / working-renter base with shorter leases; 61% free/reduced lunch — lower-income household profile, screen leases tightly.
- Zoned schools: Maple Hill Elementary School (math 32% / reading 38%, grade F, #1,569 of 2,108 statewide, top 75%, 1,012 students, 80% FRL); Monhagen Middle School (math 16% / reading 39%, grade F, #576 of 729 statewide, top 79%, 817 students, 75% FRL); Middletown High School (math 90% / reading 92%, grade A+, #203 of 1,100 statewide, top 20%, 2,523 students, 71% FRL).
- Market conditions: Rents rising fast (+8.2%/yr); 279 active listings in the ZIP; solid renter incomes; 1,746 units permitted in Orange County in 2024 (1,265 in 5+ unit buildings).
- At $6,728/mo this rent would consume 93% of the median local household income ($87k/yr) (locally 1846% of renters already pay >50% of income on rent) — very limited rent-growth headroom before tenants either downsize or default.
Forward outlook
- Local home prices are declining (-3.0%/yr); year-one equity from $4k of loan paydown is wiped out by about $17k of value loss. Plan a longer hold.
- At projected returns (-3.0% appreciation + 8.0% rent growth), your $161k cash investment doubles in ~8 years — after that, you're playing with house money.
Negotiation context
- It's been on market 31 days — a 3% lower offer ($558k) is reasonable based on typical stale-listing flexibility.
Risks & watch-outs
- Watch-outs: built in 1900 — expect roof / HVAC / electrical / plumbing capex.
Questions for the listing agent
- It's been on market 31 days. Have you received any prior offers? Is the seller open to a 3% concession, seller financing, or rate buy-down credit?
- Have any recent inspections been done? Can we get a copy of the seller's disclosures and any deferred-maintenance estimates?
- Built in 1900 — when were the roof, HVAC, electrical panel, plumbing, and water heater last replaced?
- Is there a deadline driving the sale (1031 exchange, divorce, estate, relocation)? That informs how much negotiation room exists.
- Schools are D-rated, which usually means shorter tenancies and higher turnover. Who's the typical renter profile here, and what's been the actual vacancy rate?
- What's the average days-on-market for RENTAL listings here right now (not sales)? A rising rental-DOM trend means longer vacancies and softer asking-rent achievability than the comps imply.
- What's the recent tenant-quality profile in this submarket — average credit score on applications, eviction rate, late-payment / NSF rate, and stable-employment percentage? A property-management company in the area should have these aggregated.
- How much new apartment / multifamily construction is in the pipeline within 1–3 miles? Heavy new supply (>2% of stock underway) typically softens rents 12–24 months out; light construction supports rent growth.
Investment metrics
- 1% rule
- 1.17% ✓
- Cap rate
- 9.09%
- Cash-on-cash
- 10.00%
- DSCR
- 1.44
- GRM
- 7.1
CMA / ARV
No comps found within radius.
Projected returns pro-forma
-3.0% appreciation · 8.0% rent growth · sell at horizon
- IRR
- 4.2%
- Equity multiple
- 1.17×
- Total profit
- $27,919
- Equity at exit
- $85,734
- IRR
- 18.0%
- Equity multiple
- 2.84×
- Total profit
- $296,566
- Equity at exit
- $49,715
Cash invested: $161,000 (down + closing). Projections, not guarantees.
Landlord ↔ Tenant lean methodology
- Overall (STATE)
- 15 Strongly Tenant-Friendly
- State New York
- 15 Strongly Tenant-Friendly · D+10
- County
- — inherits STATE
- City
- — inherits STATE
ZIP-level market 10940
- Home prices YoY
- -18.7%
- Rents YoY
- 8.2%
- Active inventory
- 279
- Price-to-rent
- 20.9×
Monthly cashflow live
- Estimated rent
- $6,728 high interval (Pro) →
- Mortgage (P&I)
- −$3,015
- Tax est. 1.5%
- −$719 /mo · $8,625/yr
- Insurance
- −$240
- HOA
- −$0
- Vacancy / Maint / Mgmt
- −$1,413
- Net cashflow
- $1,341
Break-even live
Sensitivity live
| Price | -10% $1,739 | -5% $1,540 | +0% $1,341 | +5% $1,143 | +10% $944 |
|---|---|---|---|---|---|
| Rent | -10% $810 | -5% $1,076 | +0% $1,341 | +5% $1,607 | +10% $1,873 |
| Rate | -1.0pp $1,631 | -0.5pp $1,488 | base $1,341 | +0.5pp $1,192 | +1.0pp $1,041 |
3-unit breakdown (identical units grouped — click to expand)
| Units | Beds | Baths | Est. rent |
|---|---|---|---|
| 2× units | 2 | 1 | $4,578 |
| #1 | 2 | 1 | $2,289 |
| #2 | 2 | 1 | $2,289 |
| 1× unit | 0 | 0 | $2,151 |
| Total (3 units) | $6,728 | ||
UW: 25.0% down · 7.5% · 30yr · 1.5% tax · 5.0% vac · 8.0% maint · 8.0% mgmt
Financing live
Cash to close
- Down payment
- $143,750
- Closing costs
- $17,250
- Reserves months
- —
- Total cash needed
- —
Loan-product check · same deal, 3 products live
Conventional
25% down · 7.5% · 30yr
- Down + closing
- —
- Monthly P&I
- —
- Monthly cashflow
- —
- DSCR
- —
- Eligible?
- —
Personal DTI + credit; lowest rate.
DSCR
20% down · 8.5% · 30yr
- Down + closing
- —
- Monthly P&I
- —
- Monthly cashflow
- —
- DSCR
- —
- Eligible?
- —
No personal income docs; deal must DSCR.
Hard money
10% down · 12.0% · 12mo
- Down + closing
- —
- Monthly P&I
- —
- Monthly cashflow
- —
- DSCR
- —
- Eligible?
- —
Short-term bridge; refi at stabilization.
Listing history 18 events
-
2026-06-22days on market $575,000 Active 31 DOM
-
2026-06-18days on market $575,000 Active 28 DOM
-
2026-06-17days on market $575,000 Active 27 DOM
-
2026-06-16days on market $575,000 Active 26 DOM
-
2026-06-15days on market $575,000 Active 25 DOM
-
2026-06-14days on market $575,000 Active 23 DOM
-
2026-06-13days on market $575,000 Active 22 DOM
-
2026-06-10days on market $575,000 Active 20 DOM
-
2026-06-09days on market $575,000 Active 19 DOM
-
2026-06-08days on market $575,000 Active 18 DOM
-
2026-06-07days on market $575,000 Active 17 DOM
-
2026-06-05days on market $575,000 Active 14 DOM
-
2026-06-03days on market $575,000 Active 13 DOM
-
2026-06-02days on market $575,000 Active 12 DOM
-
2026-06-01days on market $575,000 Active 11 DOM
-
2026-05-31days on market $575,000 Active 10 DOM
-
2026-05-30days on market $575,000 Active 9 DOM
-
2026-05-21$575,000 Active
ⓘ Source: listings_history table (triggers on properties + properties_extension) + one-shot
backfill from property_details.listing_events for pre-trigger history.
Nearby sold comps map
Loading sold comps map…
Walkable amenities ~0.75 mi
Loading nearby amenities…
Taxation est. · year 1
- Rental income
- $80,736
- − Mortgage interest
- −$32,209
- − Property taxes
- −$8,625
- − Insurance
- −$2,875
- − Repairs & maintenance
- −$6,459
- − Management
- −$6,459
- − Depreciation
- −$16,727
- Taxable income
- $7,382
- Est. tax owed @ 24.0%
- −$1,772
- After-tax cash flow
- $14,325/yr
For passive investors: Depreciation is non-cash, so a rental often shows a tax loss while cash-flowing — sheltering income. Rental losses are passive: they offset passive income freely, and up to $25,000/yr can offset ordinary (W-2) income if you actively participate and your MAGI is under $100k (phasing out to $0 by $150k); unused losses carry forward. On sale, claimed depreciation is recaptured at up to 25%, and gains may owe capital-gains tax (a 1031 exchange can defer both). Figures are a year-1 estimate at your 24.0% rate — not tax advice; consult a CPA.
Condition & rehab AI · 12 photos
This mixed-use property requires significant updates to its exterior, interior, and HVAC system to improve its condition and value. The property has potential for rental or resale, but the current state detracts from its appeal.
Repairs flagged
- Major Paint — Peeling paint on exterior and interior
- Major Siding — Worn and peeling
- Major Flooring — Worn carpet and outdated tile
- Major Kitchen cabinets — Outdated and worn
- Major Bathroom fixtures — Outdated and worn
- Major HVAC system — Outdated and cluttered
Value-add opportunities
- Both Paint and update interior decor — Enhances curb appeal and interior aesthetics
- Both Replace flooring — Improves comfort and appearance
- Both Replace kitchen cabinets and appliances — Modernizes the space and improves functionality
- Both Replace bathroom fixtures and tiles — Enhances functionality and appearance
- Both Replace HVAC system — Improves comfort and energy efficiency
Renovation cost estimate screening
| Repair item | Severity | Est. cost |
|---|---|---|
| Paint · Peeling paint on exterior and interior | Major | $15,000–50,000 |
| Siding · Worn and peeling | Major | $15,000–50,000 |
| Flooring · Worn carpet and outdated tile | Major | $15,000–50,000 |
| Kitchen cabinets · Outdated and worn | Major | $15,000–50,000 |
| Bathroom fixtures · Outdated and worn | Major | $15,000–50,000 |
| HVAC system · Outdated and cluttered | Major | $15,000–50,000 |
| Total estimated repair cost · 6 items | $90,000–300,000 |
Value-add ROI direction
- Both Paint and update interior decor — Enhances curb appeal and interior aesthetics ↑
- Both Replace flooring — Improves comfort and appearance ↑
- Both Replace kitchen cabinets and appliances — Modernizes the space and improves functionality ↑
- Both Replace bathroom fixtures and tiles — Enhances functionality and appearance ↑
- Both Replace HVAC system — Improves comfort and energy efficiency ↑
ⓘ Cost ranges are severity-bucket heuristics (US national rule-of-thumb). Get contractor quotes + a written scope before underwriting a rehab budget.
Schools (NCES district)
- District
- Middletown City School District
- NCES district ID
- 3619320
- Math proficiency
- 41% ▼ -2.00%
- Reading proficiency
- 55% ▲ 19.00%
- Median HH income
- $54,612
- Composite
- 41.52/100
- National rank
- #3453
- State rank
- #411 of 590 in NY
Livability — Middletown
- Score
- 82/100
- State rank
- #79
- US rank
- #1219
Category grades
Schools grade is shown separately in the Schools card above.
Census & demographics
- Census place
- Middletown, NY
- County
- Orange County · 267,004 people
- City population
- 68,033
- Metro
- Poughkeepsie-Newburgh-Middletown, NY
- Population (ZIP)
- 53,611
- Household income
- $87,080
- Rent vs Own
- Severe rent burden
- 1846.0
Population outlook (Orange County) Hauer SSP2
- Today (2025)
- 379,830 people
- By 2030
- 378,955 · -0.2%
- By 2040
- 375,444 · -1.2%
- By 2050
- 369,311 · -2.8%
- By 2075
- 354,233 · -6.7%
- By 2100
- 318,150 · -16.2%
Race, ethnicity, and origin ACS 2023
- Neighborhood character
- Highly diverse neighborhood (Simpson 0.70)
- Race & ethnicity
- White 39% Hispanic / Latino 32% Black 20% Two or more races 13% Asian 4% Native American 3%
- Hispanic origin (detail)
- Mexican 9% Puerto Rican 13% Dominican 3%
- Common ancestry
- Romanian 3% Italian 1% Iranian 1%
- Foreign-born
- 18% · Canada, China, Jamaica
- Languages at home
- 72% English-only · Spanish 21% Other Indo-European 2% Chinese 1%
Political lean MEDSL · Orange
- 2024 margin
- Lean R (+8.4) · D 45.8% · R 54.2%
- 2008→2024 swing
- -12.5pp toward R · 2008: 4.1pp · 2024: -8.4pp
- All cycles
- 2024: R+8.4 2020: R+0.2 2016: R+6.5 2012: D+5.2 2008: D+4.1
Not yet ingested
- Civics
- —
Market trends
- HPI YoY
- ▼ -71.68%
- Current HPI
- 311.5969
- Rent YoY
- ▲ 8.23%
- Metro
- Poughkeepsie-Newburgh-Middletown, NY
- State GDP YoY
- ▲ 2.60%
- F500 in state
- 92
Industry mix (Fortune 500 HQ in NY)
| Industry | F500 HQs | Revenue |
|---|---|---|
| Financial Services | 10 | $950B |
|
||
| Consumer Goods | 9 | $162B |
|
||
| Insurance | 4 | $225B |
|
||
| Telecommunications | 2 | $144B |
|
||
| Pharmaceuticals | 2 | $112B |
|
||
| Media / Entertainment | 2 | $69B |
|
||
Price history
1 event — show timeline
- 2026-05-21 Listed $575,000 OneKey® MLS as Distributed by MLS Grid
Cash-flow waterfall
monthlySold comps — $/sqft
last 12 mo · ≤1 miLoading sold comps…