 Fourplex
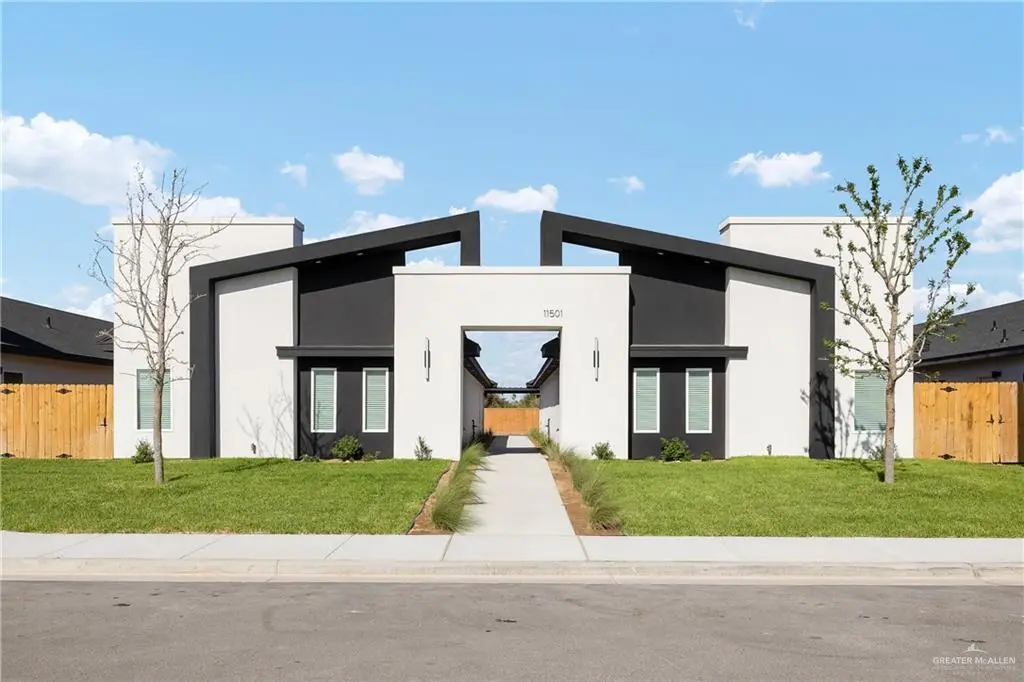
11501 N 25th St · McAllen, TX
Flood risk No data
- FEMA flood zone
- —
- Chance of flooding over 30 yrs
- —
- Est. flood insurance / yr
- —
Fire risk No data
- Est. fire insurance / yr
- —
Heat risk No data
- Hot days now (above threshold)
- —
- Hot days in 30 yrs
- —
Wind risk No data
- Chance of severe wind over 30 yrs
- —
Air-quality risk No data
- Unhealthy air days now
- —
- Unhealthy air days in 30 yrs
- —
Risk factors via First Street. Map © Google.
Why this score? — see what drove the C- grade
The composite is a weighted blend of 9 inputs, each scored 0–100. Each bar is that input's sub-score; the figure is the points it added to the 100-point composite (weight × sub-score).
- Cash flow +19.3/30.0
- ARV discount +6.2/15.0
- DSCR +6.1/10.0
- 1% rule +5.3/10.0
- Condition / age +5.0/5.0
- Livability +3.8/5.0
- Rent growth +3.1/5.0
- Schools +2.2/10.0
- Appreciation +0.0/10.0
$537,500
🖨 Deal sheet 📄 Offer letter ✓ Due diligence
Multi-family units
County records classify this as Multi-Family (2-4 Unit). Listing-text estimate: 4 units. confirmed
Listing remarks MLS
This modern fourplex is a top-tier investment opportunity. It includes two 2-bed, 2-bath units and two 3-bed, 2-bath units — each designed with high-end finishes, energy efficiency, and built with a rigid concrete work process and diligent structural engineering care. Ideally located near shopping, dining, and conveniences, the property features large-format 8x48 porcelain tile flooring, 20x40 travertine-look shower walls, black matte Moen fixtures, black electrical accents, and custom MDF cabinetry. Each unit comes fully equipped with a washer, dryer, refrigerator, stove, and microwave, offering true turnkey convenience. Spray foam insulation throughout ensures year-round comfort and efficiency. Don’t miss this rare chance to own a luxury income-producing property in a prime location!
Key facts
- High-end finishes
- Energy efficiency
- Rigid concrete work
Tags
Neighborhood map
What this means for you Summary
Snapshot
- This is a 2×2bd/2ba + 2×3bd/2ba units multifamily listed at $538k. Condition is rated excellent.
Deal economics
- At list price, monthly cash flow is $587 ($7k/yr) — positive. Per door: $147/mo.
- The deal already cash-flows at list — no discount required.
- Meets the 1% rule at list price ($6k rent vs $538k).
- Recommended offer: $505k (6.0% below list) — sets the bar for market timing.
- Cap rate 7.6% vs local median 3.7% in McAllen — top-decile yield for the area; either an underpriced asset or a hidden risk that comps aren't pricing in. Stress-test before assuming the spread holds.
Location & tenants
- Location reads 76/100 on livability (#119 in TX, #3,771 nationally) — a middle-class / working-renter tenant base. Strengths: cost of living A+, housing A+, health & safety A+; Watch: employment D, amenities F, commute F.
- Edinburg CISD (urban): math 20% / reading 34% proficiency, ranked #699 of 826 in TX (top 85%) — low school quality limits family demand, transient renter base, plan for 1-2y turnover; 62% free/reduced lunch — lower-income household profile, screen leases tightly.
- Market conditions: Rents rising (+2.6%/yr); 888 active listings in the ZIP; 9 comparable units currently listed for rent nearby; rentals lingering (median 44d on market — plan ~5-8 weeks vacancy on turnover, expect pricing pressure); 67% of comp listings sitting > 30 days — soft ceiling on asking rent; solid renter incomes; 7,378 units permitted in Hidalgo County in 2024 (641 in 5+ unit buildings).
- At $5,552/mo this rent would consume 81% of the median local household income ($82k/yr) (locally 1468% of renters already pay >50% of income on rent) — very limited rent-growth headroom before tenants either downsize or default.
Forward outlook
- Local home prices are declining (-3.0%/yr); year-one equity from $4k of loan paydown is wiped out by about $16k of value loss. Plan a longer hold.
- Hidalgo County population projected at +28% by 2050 — long-run rental-demand tailwind backs the buy-and-hold thesis.
Negotiation context
- It's been on market 77 days — a 6% lower offer ($505k) is reasonable based on typical stale-listing flexibility.
- 2 sale attempts with the ask held roughly flat each time — persistent listings suggest the price (not the market) is what's stuck; bring a comps-based counter.
Questions for the listing agent
- It's been on market 77 days. Have you received any prior offers? Is the seller open to a 6% concession, seller financing, or rate buy-down credit?
- Can we see the unit-by-unit rent roll, current vacancy, and any below-market leases? What's the average tenancy length?
- What capital expenditures (roof, boiler, parking lot, exteriors) have been made in the last 5 years, and what's planned in the next 2?
- What does the HOA fee cover, when was the last increase, and are there any pending special assessments or reserve-fund shortfalls?
- Why hasn't it sold? Are there any deal-killer items the seller is aware of (foundation, flood, title, zoning, code violations)?
- Is there a deadline driving the sale (1031 exchange, divorce, estate, relocation)? That informs how much negotiation room exists.
- Schools are B-rated — typically a magnet for longer-tenancy family renters. What's the average tenant stay here, and is there a school-zone premium baked into asking?
- What's the average days-on-market for RENTAL listings here right now (not sales)? A rising rental-DOM trend means longer vacancies and softer asking-rent achievability than the comps imply.
- What's the recent tenant-quality profile in this submarket — average credit score on applications, eviction rate, late-payment / NSF rate, and stable-employment percentage? A property-management company in the area should have these aggregated.
- How much new apartment / multifamily construction is in the pipeline within 1–3 miles? Heavy new supply (>2% of stock underway) typically softens rents 12–24 months out; light construction supports rent growth.
Investment metrics
- 1% rule
- 1.03% ✓
- Cap rate
- 7.60%
- Cash-on-cash
- 4.68%
- DSCR
- 1.21
- GRM
- 8.1
CMA / ARV
- ARV (median comp)
- $522,527
- List price
- $537,500
- Delta
- 4.30%
- Verdict
- FAIR
- Comps
- 12 within 1.0 mi
Show comp detail 5 sales within ~0.75 mi
| Address | Dist | Beds/Ba | Sqft | Sold | Price | $/sf | Match |
|---|---|---|---|---|---|---|---|
| 11412 N 25th St | 0.00mi | —/— | 4,000 (-1%) | 1mo | $525,000 | $131 | 97 |
| 11500 N 25th Ln | 0.08mi | —/— | 4,000 (-1%) | 7mo | $515,900 | $129 | 88 |
| 11502 N 24th Ln | 0.29mi | —/— | 4,100 (+1%) | 3mo | $525,000 | $128 | 82 |
| 11404 25th St | 0.38mi | —/— | 4,100 (+1%) | 10mo | $525,000 | $128 | 72 |
| 2501 Indian Creek Ave | 0.54mi | —/— | 4,100 (+1%) | 8mo | $520,000 | $127 | 66 |
Match score weights: distance 35% · size 25% · config 20% · recency 20%. Top-matched comps best support the ARV.
Projected returns pro-forma
-3.0% appreciation · 2.57% rent growth · sell at horizon
- IRR
- -9.5%
- Equity multiple
- 0.65×
- Total profit
- $-51,997
- Equity at exit
- $80,143
- IRR
- -0.6%
- Equity multiple
- 0.96×
- Total profit
- $-6,353
- Equity at exit
- $46,473
Cash invested: $150,500 (down + closing). Projections, not guarantees.
Landlord ↔ Tenant lean methodology
- Overall (STATE)
- 87 Strongly Landlord-Friendly
- State Texas
- 87 Strongly Landlord-Friendly · R+5
- County
- — inherits STATE
- City
- — inherits STATE
ZIP-level market 78504
- Home prices YoY
- -29.4%
- Rents YoY
- 2.6%
- Active inventory
- 888
- Price-to-rent
- 33.3×
Monthly cashflow live
- Estimated rent
- $5,552 high interval (Pro) →
- Mortgage (P&I)
- −$2,819
- Tax est. 1.5%
- −$672 /mo · $8,062/yr
- Insurance
- −$224
- HOA
- −$85
- Vacancy / Maint / Mgmt
- −$1,166
- Net cashflow
- $587
Break-even live
4-unit breakdown (identical units grouped — click to expand)
| Units | Beds | Baths | Est. rent |
|---|---|---|---|
| 2× units | 2 | 2 | $2,688 |
| #1 | 2 | 2 | $1,344 |
| #2 | 2 | 2 | $1,344 |
| 2× units | 3 | 2 | $2,864 |
| #3 | 3 | 2 | $1,432 |
| #4 | 3 | 2 | $1,432 |
| Total (4 units) | $5,552 | ||
UW: 25.0% down · 7.5% · 30yr · 1.5% tax · 5.0% vac · 8.0% maint · 8.0% mgmt
Financing live
Cash to close
- Down payment
- $134,375
- Closing costs
- $16,125
- Reserves months
- —
- Total cash needed
- —
Loan-product check · same deal, 3 products live
Conventional
25% down · 7.5% · 30yr
- Down + closing
- —
- Monthly P&I
- —
- Monthly cashflow
- —
- DSCR
- —
- Eligible?
- —
Personal DTI + credit; lowest rate.
DSCR
20% down · 8.5% · 30yr
- Down + closing
- —
- Monthly P&I
- —
- Monthly cashflow
- —
- DSCR
- —
- Eligible?
- —
No personal income docs; deal must DSCR.
Hard money
10% down · 12.0% · 12mo
- Down + closing
- —
- Monthly P&I
- —
- Monthly cashflow
- —
- DSCR
- —
- Eligible?
- —
Short-term bridge; refi at stabilization.
Rent comps 9 comps
| Address | Beds | Baths | Sqft | Rent | $/sqft | DOM | Units | Dist |
|---|---|---|---|---|---|---|---|---|
| 11401 N 25th St Unit 2 McAllen, TX | 3.0 | 2.0 | 4004 | $1,350 | $0.34 | 43d | 1 | 0.03mi |
| 2501 Indian Creek Ave Unit 1 McAllen, TX | 2.0 | 2.0 | 4100 | $1,175 | $0.29 | 23d | 1 | 0.26mi |
| 702 S Logan Dr Unit 3 Edinburg, TX | 2.0 | 2.5 | 4488 | $950 | $0.21 | 43d | 1 | 1.30mi |
| 901 N Woodson Ave Unit 3 Edinburg, TX | 3.0 | 2.0 | 4200 | $1,095 | $0.26 | 43d | 1 | 1.37mi |
| 822 N Blair Ave Unit 1 Edinburg, TX | 2.0 | 2.0 | 4084 | $1,075 | $0.26 | 43d | 1 | 1.43mi |
| 12611 N 33rd Ln Unit 1 Edinburg, TX | 3.0 | 2.0 | 4200 | $1,300 | $0.31 | 18d | 1 | 1.45mi |
| 1000 N Woodson Ave Unit 2 Edinburg, TX | 2.0 | 2.0 | 4200 | $995 | $0.24 | 14d | 1 | 1.45mi |
| 12706 N 33rd Ln Unit 3 McAllen, TX | 2.0 | 2.5 | 4060 | $1,150 | $0.28 | 43d | 1 | 1.45mi |
| 1000 N Blair Ave Unit 4 Edinburg, TX | 2.0 | 2.0 | 4020 | $1,075 | $0.27 | 43d | 1 | 1.47mi |
HOA detail
- Monthly dues
- $85 · $1,020/yr
- Likely covers
- electric
Listing history 19 events
-
2026-06-18days on market $537,500 Active 77 DOM
-
2026-06-17days on market $537,500 Active 76 DOM
-
2026-06-16pricedays on market $537,500 Active 75 DOM
-
2026-06-15days on market $545,000 Active 74 DOM
-
2026-06-14days on market $545,000 Active 72 DOM
-
2026-06-13days on market $545,000 Active 71 DOM
-
2026-06-10days on market $545,000 Active 69 DOM
-
2026-06-09days on market $545,000 Active 68 DOM
-
2026-06-08days on market $545,000 Active 67 DOM
-
2026-06-07days on market $545,000 Active 66 DOM
-
2026-06-03days on market $545,000 Active 62 DOM
-
2026-06-02days on market $545,000 Active 61 DOM
-
2026-06-01days on market $545,000 Active 60 DOM
-
2026-05-31days on market $545,000 Active 59 DOM
-
2026-05-31days on market $545,000 Active 58 DOM
-
2026-04-02$545,000 Active 808-char remark
Show marketing remark (808 chars)
This modern fourplex is a top-tier investment opportunity. It includes two 2-bed, 2-bath units and two 3-bed, 2-bath units — each designed with high-end finishes, energy efficiency, and built with a rigid concrete work process and diligent structural engineering care. Ideally located near shopping, dining, and conveniences, the property features large-format 8x48 porcelain tile flooring, 20x40 travertine-look shower walls, black matte Moen fixtures, black electrical accents, and custom MDF cabinetry. Each unit comes fully equipped with a washer, dryer, refrigerator, stove, and microwave, offering true turnkey convenience. Spray foam insulation throughout ensures year-round comfort and efficiency. Don’t miss this rare chance to own a luxury income-producing property in a prime location!
-
2026-03-12price $545,000
-
2026-02-15price $537,500
-
2025-07-01$525,000 Active
ⓘ Source: listings_history table (triggers on properties + properties_extension) + one-shot
backfill from property_details.listing_events for pre-trigger history.
Nearby sold comps map
Loading sold comps map…
Walkable amenities ~0.75 mi
Loading nearby amenities…
Taxation est. · year 1
- Rental income
- $66,624
- − Mortgage interest
- −$30,108
- − Property taxes
- −$8,062
- − Insurance
- −$2,688
- − Repairs & maintenance
- −$5,330
- − Management
- −$5,330
- − HOA
- −$1,020
- − Depreciation
- −$15,636
- Taxable loss
- −$1,551
- Est. tax savings @ 24.0%
- +$372
- After-tax cash flow
- $7,411/yr
For passive investors: Depreciation is non-cash, so a rental often shows a tax loss while cash-flowing — sheltering income. Rental losses are passive: they offset passive income freely, and up to $25,000/yr can offset ordinary (W-2) income if you actively participate and your MAGI is under $100k (phasing out to $0 by $150k); unused losses carry forward. On sale, claimed depreciation is recaptured at up to 25%, and gains may owe capital-gains tax (a 1031 exchange can defer both). Figures are a year-1 estimate at your 24.0% rate — not tax advice; consult a CPA.
Condition & rehab AI · 6 photos
This modern fourplex is in excellent condition with high-end finishes and energy-efficient features. It is an ideal investment opportunity with minimal maintenance and potential for value-adding improvements.
Value-add opportunities
- Both Painting the interior walls — Fresh paint can enhance the home's curb appeal and interior aesthetics.
- Both Landscaping improvements — Enhanced landscaping can improve curb appeal and attract more potential buyers/tenants.
- Both Add smart home features — Smart home features can increase the home's appeal and value, especially for younger buyers/tenants.
- Both Install energy-efficient lighting — Energy-efficient lighting can reduce energy costs and appeal to environmentally conscious buyers/tenants.
- Both Add a smart thermostat — A smart thermostat can improve energy efficiency and comfort, making the home more attractive to buyers/tenants.
Renovation cost estimate screening
Value-add ROI direction
- Both Painting the interior walls — Fresh paint can enhance the home's curb appeal and interior aesthetics. ↑
- Both Landscaping improvements — Enhanced landscaping can improve curb appeal and attract more potential buyers/tenants. ↑
- Both Add smart home features — Smart home features can increase the home's appeal and value, especially for younger buyers/tenants. ↑
- Both Install energy-efficient lighting — Energy-efficient lighting can reduce energy costs and appeal to environmentally conscious buyers/tenants. ↑
- Both Add a smart thermostat — A smart thermostat can improve energy efficiency and comfort, making the home more attractive to buyers/tenants. ↑
ⓘ Cost ranges are severity-bucket heuristics (US national rule-of-thumb). Get contractor quotes + a written scope before underwriting a rehab budget.
Schools (NCES district)
- District
- Edinburg CISD
- NCES district ID
- 4818180
- Math proficiency
- 20% ▼ -34.00%
- Reading proficiency
- 34% ▼ -11.00%
- Median HH income
- $36,985
- Composite
- 22.42/100
- National rank
- #8114
- State rank
- #699 of 826 in TX
Livability — McAllen
- Score
- 76/100
- State rank
- #119
- US rank
- #3771
Category grades
Schools grade is shown separately in the Schools card above.
Census & demographics
- Census place
- McAllen, TX
- County
- Hidalgo County · 623,128 people
- City population
- 144,650
- Metro
- McAllen-Edinburg-Mission, TX
- Population (ZIP)
- 63,094
- Household income
- $81,905
- Rent vs Own
- Severe rent burden
- 1468.0
Population outlook (Hidalgo County) Hauer SSP2
- Today (2025)
- 955,232 people
- By 2030
- 1,009,774 · +5.7%
- By 2040
- 1,120,332 · +17.3%
- By 2050
- 1,225,036 · +28.2%
- By 2075
- 1,439,189 · +50.7%
- By 2100
- 1,533,429 · +60.5%
Race, ethnicity, and origin ACS 2023
- Neighborhood character
- Predominantly Hispanic (82%)
- Race & ethnicity
- Hispanic / Latino 82% Two or more races 39% White 11% Asian 5%
- Hispanic origin (detail)
- Mexican 75%
- Common ancestry
- Lithuanian 1% Italian 1%
- Foreign-born
- 24% · Canada, South Korea, Vietnam
- Languages at home
- 34% English-only · Spanish 62% Other Asian/Pacific 1% Tagalog/Filipino 1%
Political lean MEDSL · Hidalgo
- 2024 margin
- Toss-up / Even · D 48.1% · R 51.0%
- 2008→2024 swing
- -41.6pp toward R · 2008: 38.7pp · 2024: -2.9pp
- All cycles
- 2024: R+2.9 2020: D+17.1 2016: D+40.5 2012: D+41.8 2008: D+38.7
Not yet ingested
- Civics
- —
Market trends
- HPI YoY
- ▼ -80.87%
- Current HPI
- 194.1764
- Rent YoY
- ▲ 2.57%
- Metro
- McAllen-Edinburg-Mission, TX
- State GDP YoY
- ▲ 3.95%
- F500 in state
- 110
Industry mix (Fortune 500 HQ in TX)
| Industry | F500 HQs | Revenue |
|---|---|---|
| Energy | 16 | $1,198B |
|
||
| Technology | 5 | $198B |
|
||
| Engineering / Construction | 4 | $72B |
|
||
| Energy Services | 3 | $60B |
|
||
| Utilities | 3 | $41B |
|
||
| Healthcare | 2 | $330B |
|
||
Price history
+3.8% since first listed4 events — show timeline
- 2026-04-02 Listed $545,000 MCALLENMLS
- 2026-03-12 Price Changed $545,000 MCALLENMLS
- 2026-02-15 Price Changed $537,500 MCALLENMLS
- 2025-07-01 Listed $525,000 MCALLENMLS
Cash-flow waterfall
monthlySold comps — $/sqft
last 12 mo · ≤1 miLoading sold comps…