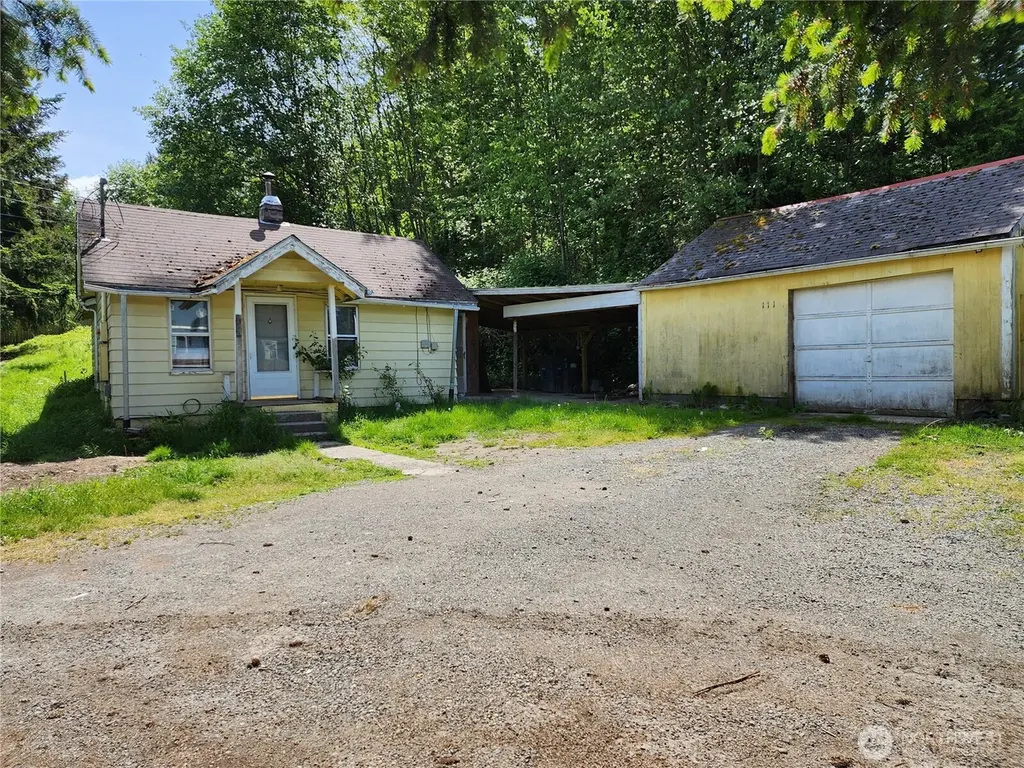
111 Cedar Ave S · Eatonville, WA
Flood risk 7/10 · Major
- FEMA flood zone
- X (unshaded)
- Chance of flooding over 30 yrs
- 0.75%
- Est. flood insurance / yr
- $507 – $1,088
Fire risk 3/10 · Minor
- Est. fire insurance / yr
- $604 – $1,122
Heat risk 2/10 · Minimal
- Hot days now (above 89°F)
- 7 days/yr
- Hot days in 30 yrs
- 15 days/yr
Wind risk 1/10 · Minimal
- Chance of severe wind over 30 yrs
- —
Air-quality risk 7/10 · Major
- Unhealthy air days now
- 9 days/yr
- Unhealthy air days in 30 yrs
- 10 days/yr
Risk factors via First Street. Map © Google.
Why this score? — see what drove the B- grade
The composite is a weighted blend of 9 inputs, each scored 0–100. Each bar is that input's sub-score; the figure is the points it added to the 100-point composite (weight × sub-score).
- Cash flow +30.0/30.0
- 1% rule +10.0/10.0
- DSCR +10.0/10.0
- ARV discount +7.5/15.0
- Schools +4.8/10.0
- Livability +4.0/5.0
- Rent growth +2.5/5.0
- Condition / age +1.0/5.0
- Appreciation +0.0/10.0
$125,000
🖨 Deal sheet (PDF) 📄 Offer letter ✓ Due diligence
Listing remarks
Opportunity awaits at the end of a quiet street in Eatonville. Situated on an approximately 10,500 sq ft lot, this 2-bedroom, 1-bath home offers potential for redevelopment, investment, or a full renovation project. Formerly used as a rental property (tenants recently moved out), the home sits on a cement block foundation and includes an oversized single-car garage plus an exterior laundry room on a slab. The property is in poor condition and will require significant repairs or possible tear down and rebuild a new residence. End-of-street location provides added privacy and room to bring your vision to life. Property is being sold in current condition with no repairs. Buyer to verify all in
Key facts
- 0.24 acre lot
- Garage
- Built 1934
Tags
Property features AI
Finance
- Other: Property condition: Fixer
- Financial info: Listing terms: Cash
Exterior
- Parking: Detached garage (has garage) with 1 covered space; 3 uncovered parking spaces; Approximately 400 sq ft garage
- Utilities: Electric energy source; Public water (Town of Eatonville); Sewer connected (Town of Eatonville); Power provided by Town of Eatonville; Electric water heater
- Home design: Single-family residence, one story; Main-level entry; Built on lot, detached; Facing direction not specified
- Construction: Built in 1934 (effective year); Metal/vinyl construction materials; Composition roof; Block foundation
- Exterior features: Metal/vinyl exterior; Dead-end street lot
Interior
- Kitchen: No specific appliances listed
- Bedrooms: 2 bedrooms (both on main level)
- Bathrooms: One 3/4 bathroom (main level) with shower
- Heating & cooling: Baseboard heating; No cooling
- Interior features: Water heater; No basement
- Laundry & utility: Water heater located behind washer & dryer
Neighborhood map
What this means for you Summary
Snapshot
- This is a 2-bed/1.0-bath single-family listed at $125k. Condition is rated poor.
Deal economics
- At list price, monthly cash flow is $781 ($9k/yr) — positive.
- The deal already cash-flows at list — no discount required.
- Meets the 1% rule at list price ($2k rent vs $125k).
- Cap rate 14.4% vs local median 2.7% in Eatonville — top-decile yield for the area; either an underpriced asset or a hidden risk that comps aren't pricing in. Stress-test before assuming the spread holds.
Location & tenants
- Location reads 80/100 on livability (#101 in WA, #1,946 nationally) — a professional / high-income tenant draw. Strengths: housing A+, health & safety A+, crime A; Watch: commute F.
- Eatonville School District (rural): math 45% / reading 60% proficiency, ranked #116 of 291 in WA (top 40%) — acceptable for families but not a draw, mixed tenant base, ~2y average lease.
- Zoned schools: Eatonville High School (560 students, 41% FRL).
- Market conditions: 235 active listings in the ZIP; 3,209 units permitted in Pierce County in 2024 (1,269 in 5+ unit buildings).
Forward outlook
- Local home prices are declining (-3.0%/yr); year-one equity from $864 of loan paydown is wiped out by about $4k of value loss. Plan a longer hold.
- Pierce County population projected at +26% by 2050 — long-run rental-demand tailwind backs the buy-and-hold thesis.
- At projected returns (-3.0% appreciation + 3.0% rent growth), your $35k cash investment doubles in ~5 years — after that, you're playing with house money.
Negotiation context
- Only 8 days on market — expect competitive offers; lowballing is unlikely to land.
- 2 sale attempts since 23y ago with the ask held roughly flat each time — persistent listings suggest the price (not the market) is what's stuck; bring a comps-based counter.
- Current owner paid $42k; list at $125k implies a 198% gain — meaningful room to come down on a strong offer.
Risks & watch-outs
- Watch-outs: flood insurance adds $66/mo; built in 1934 — expect roof / HVAC / electrical / plumbing capex.
- Climate carrying-cost: major flood risk — expect insurance premiums to compound above CPI over the hold.
Questions for the listing agent
- Have any recent inspections been done? Can we get a copy of the seller's disclosures and any deferred-maintenance estimates?
- Built in 1934 — when were the roof, HVAC, electrical panel, plumbing, and water heater last replaced?
- What's the actual annual flood-insurance premium (NFIP or private), and is the property in a SFHA with mandatory coverage?
- Is there a deadline driving the sale (1031 exchange, divorce, estate, relocation)? That informs how much negotiation room exists.
- Schools are A-rated — typically a magnet for longer-tenancy family renters. What's the average tenant stay here, and is there a school-zone premium baked into asking?
- What's the average days-on-market for RENTAL listings here right now (not sales)? A rising rental-DOM trend means longer vacancies and softer asking-rent achievability than the comps imply.
- What's the recent tenant-quality profile in this submarket — average credit score on applications, eviction rate, late-payment / NSF rate, and stable-employment percentage? A property-management company in the area should have these aggregated.
- How much new for-sale + rental construction is in the pipeline within 1–3 miles? Heavy new supply typically softens prices + rents 12–24 months out; constrained supply supports both.
Investment metrics
- 1% rule
- 1.73% ✓
- Cap rate
- 14.43%
- Cash-on-cash
- 29.07%
- DSCR
- 2.29
- GRM
- 4.8
CMA / ARV
- ARV (on-the-fly)
- $324,544
- Comps found
- 2
Show comp detail 2 sales within ~0.75 mi
| Address | Dist | Beds/Ba | Sqft | Sold | Price | $/sf | Match |
|---|---|---|---|---|---|---|---|
| 111 Cedar Ave S | 0.00mi | 2/1.0 | 704 (0%) | 1mo | $160,100 | $227 | 100 |
| 109 Orchard Ave S | 0.13mi | 2/1.0 | 726 (+3%) | 15mo | $335,000 | $461 | 76 |
Match score weights: distance 35% · size 25% · config 20% · recency 20%. Top-matched comps best support the ARV.
Projected returns pro-forma
-3.0% appreciation · 3.0% rent growth · sell at horizon
- IRR
- 20.7%
- Equity multiple
- 1.85×
- Total profit
- $29,584
- Equity at exit
- $18,638
- IRR
- 28.9%
- Equity multiple
- 3.58×
- Total profit
- $90,141
- Equity at exit
- $10,808
Cash invested: $35,000 (down + closing). Projections, not guarantees.
Landlord ↔ Tenant lean methodology
- Overall (STATE)
- 28 Tenant-Leaning
- State Washington
- 28 Tenant-Leaning · D+8
- County
- — inherits STATE
- City
- — inherits STATE
ZIP-level market 98321
- Active inventory
- 235
- Price-to-rent
- 4.8×
Monthly cashflow live
- Estimated rent
- $2,167 medium interval (Pro) →
- Mortgage (P&I)
- −$656
- Tax est. 1.5%
- −$156 /mo · $1,875/yr
- Insurance
- −$52
- Flood insurance flood zone
- −$66 /mo · $798/yr
- HOA
- −$0
- Vacancy / Maint / Mgmt
- −$455
- Net cashflow
- $781
Break-even live
Sensitivity live
| Price | -10% $868 | -5% $825 | +0% $781 | +5% $738 | +10% $695 |
|---|---|---|---|---|---|
| Rent | -10% $610 | -5% $696 | +0% $781 | +5% $867 | +10% $953 |
| Rate | -1.0pp $844 | -0.5pp $813 | base $781 | +0.5pp $749 | +1.0pp $716 |
UW: 25.0% down · 7.5% · 30yr · 1.5% tax · 5.0% vac · 8.0% maint · 8.0% mgmt
Financing live
Cash to close
- Down payment
- $31,250
- Closing costs
- $3,750
- Reserves months
- —
- Total cash needed
- —
Loan-product check · same deal, 3 products live
Conventional
25% down · 7.5% · 30yr
- Down + closing
- —
- Monthly P&I
- —
- Monthly cashflow
- —
- DSCR
- —
- Eligible?
- —
Personal DTI + credit; lowest rate.
DSCR
20% down · 8.5% · 30yr
- Down + closing
- —
- Monthly P&I
- —
- Monthly cashflow
- —
- DSCR
- —
- Eligible?
- —
No personal income docs; deal must DSCR.
Hard money
10% down · 12.0% · 12mo
- Down + closing
- —
- Monthly P&I
- —
- Monthly cashflow
- —
- DSCR
- —
- Eligible?
- —
Short-term bridge; refi at stabilization.
Listing history 3 events
-
2026-05-19$125,000 Active
-
2003-08-11soldstatus $42,000
-
2003-05-05$48,500
ⓘ Source: listings_history table (triggers on properties + properties_extension) + one-shot
backfill from property_details.listing_events for pre-trigger history.
Climate risk First Street
- Flood 7/10 Severe FEMA zone X (unshaded) · 75% chance over 30 yrs
- Wildfire 3/10 Moderate
- Heat 2/10 Low 7 d/yr ≥89°F today · 15 d/yr by 30 yrs out
- Wind 1/10 Low
- Air quality 7/10 Severe 9 unhealthy d/yr today · 10 by 30 yrs out
Nearby sold comps map
Loading sold comps map…
Walkable amenities ~0.75 mi
Loading nearby amenities…
Taxation est. · year 1
- Rental income
- $26,000
- − Mortgage interest
- −$7,002
- − Property taxes
- −$1,875
- − Insurance
- −$1,422
- − Repairs & maintenance
- −$2,080
- − Management
- −$2,080
- − Depreciation
- −$3,636
- Taxable income
- $7,904
- Est. tax owed @ 24.0%
- −$1,897
- After-tax cash flow
- $7,479/yr
For passive investors: Depreciation is non-cash, so a rental often shows a tax loss while cash-flowing — sheltering income. Rental losses are passive: they offset passive income freely, and up to $25,000/yr can offset ordinary (W-2) income if you actively participate and your MAGI is under $100k (phasing out to $0 by $150k); unused losses carry forward. On sale, claimed depreciation is recaptured at up to 25%, and gains may owe capital-gains tax (a 1031 exchange can defer both). Figures are a year-1 estimate at your 24.0% rate — not tax advice; consult a CPA.
Condition & rehab AI · 12 photos
This property requires extensive repairs and updates to bring it up to modern standards, significantly increasing its resale and rental value.
Repairs flagged
- Major kitchen appliances — need replacement
- Major bathroom fixtures — need replacement
- Major roof — visible moss and potential leaks
- Major exterior paint — peeling paint
- Major flooring — worn carpet, subfloor visible
- Major interior walls/paint — peeling paint, exposed insulation
- Major systems — outdated appliances, potential electrical issues
Value-add opportunities
- Both kitchen appliances — modern appliances improve both resale and rental value
- Both bathroom fixtures — updated fixtures enhance both resale and rental appeal
- Both exterior paint — fresh paint improves curb appeal and value
- Both flooring — new flooring enhances both resale and rental value
- Both interior walls/paint — fresh paint and repairs improve both resale and rental appeal
- Both systems — modern appliances and electrical upgrades enhance both resale and rental value
Renovation cost estimate screening
| Repair item | Severity | Est. cost |
|---|---|---|
| kitchen appliances · need replacement | Major | $15,000–50,000 |
| bathroom fixtures · need replacement | Major | $15,000–50,000 |
| roof · visible moss and potential leaks | Major | $15,000–50,000 |
| exterior paint · peeling paint | Major | $15,000–50,000 |
| flooring · worn carpet, subfloor visible | Major | $15,000–50,000 |
| interior walls/paint · peeling paint, exposed insulation | Major | $15,000–50,000 |
| systems · outdated appliances, potential electrical issues | Major | $15,000–50,000 |
| Total estimated repair cost · 7 items | $105,000–350,000 |
Value-add ROI direction
- Both kitchen appliances — modern appliances improve both resale and rental value ↑
- Both bathroom fixtures — updated fixtures enhance both resale and rental appeal ↑
- Both exterior paint — fresh paint improves curb appeal and value ↑
- Both flooring — new flooring enhances both resale and rental value ↑
- Both interior walls/paint — fresh paint and repairs improve both resale and rental appeal ↑
- Both systems — modern appliances and electrical upgrades enhance both resale and rental value ↑
ⓘ Cost ranges are severity-bucket heuristics (US national rule-of-thumb). Get contractor quotes + a written scope before underwriting a rehab budget.
Schools (NCES district)
- District
- Eatonville School District
- NCES district ID
- 5302370
- Math proficiency
- 45% ▼ -1.00%
- Reading proficiency
- 60% ▲ 1.00%
- Median HH income
- $58,370
- Composite
- 47.54/100
- National rank
- #4971
- State rank
- #116 of 291 in WA
Livability — Eatonville
- Score
- 80/100
- State rank
- #101
- US rank
- #1946
Category grades
Schools grade is shown separately in the Schools card above.
Census & demographics
- Census place
- Eatonville, WA
- Population (ZIP)
- 17,601
Population outlook (Pierce County) Hauer SSP2
- Today (2025)
- 956,648 people
- By 2030
- 1,010,862 · +5.7%
- By 2040
- 1,113,170 · +16.4%
- By 2050
- 1,206,524 · +26.1%
- By 2075
- 1,436,425 · +50.2%
- By 2100
- 1,563,654 · +63.5%
Race, ethnicity, and origin ACS 2023
- Neighborhood character
- Predominantly White (87%)
- Race & ethnicity
- White 87% Hispanic / Latino 6% Two or more races 5% Native American 2% Asian 1%
- Hispanic origin (detail)
- Mexican 3% Puerto Rican 2%
- Common ancestry
- Portuguese 7% Italian 4% Lithuanian 3%
- Foreign-born
- 2% · China, Canada
- Languages at home
- 97% English-only · Spanish 1% Other Asian/Pacific 1%
Political lean MEDSL · Pierce
- 2024 margin
- D (+10.8) · D 53.9% · R 43.1% · Other 3.0%
- 2008→2024 swing
- -1.4pp toward R · 2008: 12.2pp · 2024: 10.8pp
- All cycles
- 2024: D+10.8 2020: D+11.2 2016: D+7.5 2012: D+11.0 2008: D+12.2
Not yet ingested
- Civics
- —
Market trends
- HPI YoY
- ▼ -206.67%
- Current HPI
- 310.6568
- Rent YoY
- —
- Metro
- —
- State GDP YoY
- ▲ 4.65%
- F500 in state
- 22
Industry mix (Fortune 500 HQ in WA)
| Industry | F500 HQs | Revenue |
|---|---|---|
| Retail | 2 | $269B |
|
||
| Technology / Retail | 1 | $638B |
|
||
| Technology | 1 | $245B |
|
||
| Telecommunications | 1 | $38B |
|
||
| Food / Beverage | 1 | $36B |
|
||
| Automotive / Trucks | 1 | $34B |
|
||
Price history
+157.7% since first listed3 events — show timeline
- 2026-05-19 Listed $125,000 NWMLS as Distributed by MLS Grid
- 2003-08-11 Sold (MLS) $42,000 NWMLS as Distributed by MLS Grid
- 2003-05-05 Listed $48,500 NWMLS as Distributed by MLS Grid
Cash-flow waterfall
monthlySold comps — $/sqft
last 12 mo · ≤1 miLoading sold comps…