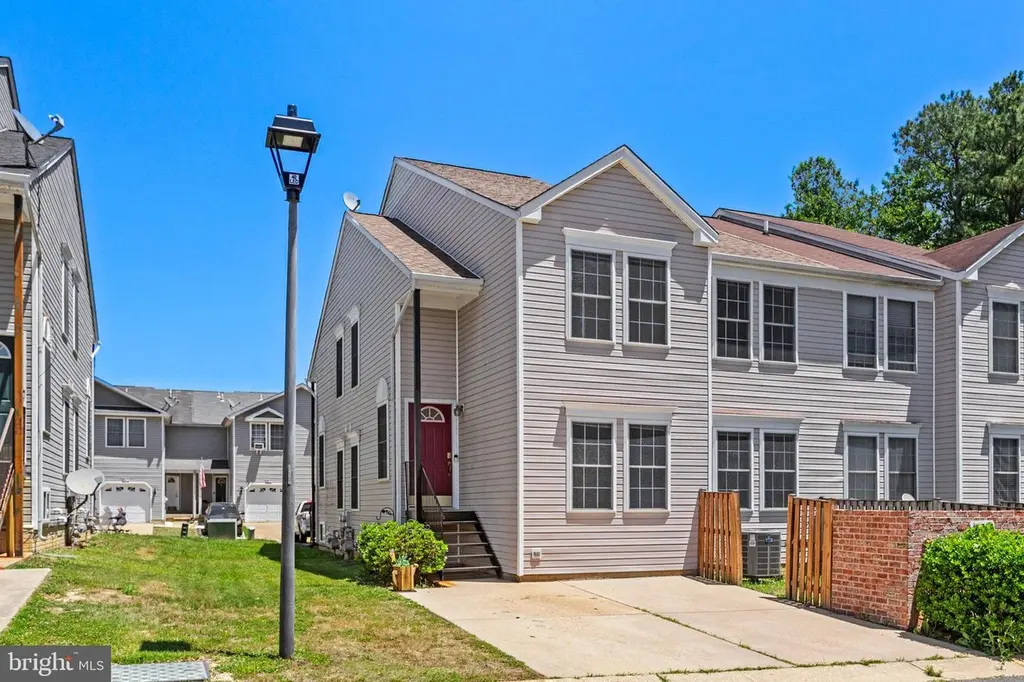
45553 Knockeyon Ln · California, MD
Flood risk 1/10 · Minimal
- FEMA flood zone
- X (unshaded)
- Chance of flooding over 30 yrs
- 0.0%
- Est. flood insurance / yr
- $473 – $860
Fire risk 5/10 · Moderate
- Est. fire insurance / yr
- $755 – $1,403
Heat risk 9/10 · Severe
- Hot days now (above 101°F)
- 7 days/yr
- Hot days in 30 yrs
- 17 days/yr
Wind risk 6/10 · Moderate
- Chance of severe wind over 30 yrs
- 67.0%
Air-quality risk 2/10 · Minimal
- Unhealthy air days now
- 1 days/yr
- Unhealthy air days in 30 yrs
- 2 days/yr
Risk factors via First Street. Map © Google.
Why this score? — see what drove the D- grade
The composite is a weighted blend of 9 inputs, each scored 0–100. Each bar is that input's sub-score; the figure is the points it added to the 100-point composite (weight × sub-score).
- Cash flow +13.3/30.0
- DSCR +4.0/10.0
- Livability +3.7/5.0
- 1% rule +3.3/10.0
- ARV discount +3.2/15.0
- Schools +3.0/10.0
- Rent growth +2.5/5.0
- Condition / age +2.5/5.0
- Appreciation +0.0/10.0
$289,900
🖨 Deal sheet (PDF) 📄 Offer letter ✓ Due diligence
Listing remarks
Welcome home to this move-in ready 3 bedroom, 3.5 bath Townhouse featuring three finished levels and a functional layout throughout. The main level and upstairs both feature brand new carpet, while the entire home has been freshly painted. The main level also includes a convenient bedroom and a half bath. Upstairs, both bedrooms feature their own private full bathrooms, including the Master Bedroom Suite. The finished basement provides additional living space with a rec room, bonus room, and a full bath — ideal for guests, a home office, workout area, or extra entertaining space. Major updates include a new HVAC system installed in 2025 and a roof with architectural shingles replaced
Key facts
- $90 HOA
- 2 parking spots
- Community pool
Property features AI
Finance
- HOA & community: Monthly HOA fee of $90; HOA covers common area maintenance, pools, and trash; Community amenities include outdoor pool, tennis courts, playground, exercise room, and recreation center
Exterior
- Parking: Two total garage and parking spaces; Driveway with two spaces; Driveway and parking lot access; Lighted parking
- Utilities: Public water; Public sewer; Electric hot water; Central A/C (electric); Natural gas available
- Home design: End of row townhouse; Built with vinyl siding; Architectural shingle roof; Permanent foundation; Excellent property condition; Fee simple ownership
- Construction: Vinyl siding construction; Architectural shingle roof; Permanent foundation; End of row/townhouse structure
- Exterior features: Community in-ground pool (fenced); Community pool; Above grade and below grade other structures
Interior
- Kitchen: Built-in microwave; Dishwasher; Stove; Refrigerator; Pantry
- Bedrooms: 1 bedroom on the main level; 2 bedrooms on the upper level
- Bathrooms: Three full bathrooms; One half bathroom
- Heating & cooling: Heat pump with gas backup; Natural gas heating fuel; Central air conditioning (electric)
- Interior features: Ceiling fans; Traditional floor plan; Galley kitchen layout; Pantry; Recessed lighting; Fully finished basement with interior access
- Laundry & utility: Washer; Dryer; Electric water heater
Neighborhood map
What this means for you Summary
Snapshot
- This is a 3-bed/2.5-bath townhouse listed at $290k.
Deal economics
- At list price, monthly cash flow is $-1 ($-7/yr) — negative.
- To cash-flow at today's rent, offer at most $290k (0.0% below list).
- To meet the 1% rule (rent ≥ 1% of price), the offer needs to be $240k (17.2% below list).
- Recommended offer: $240k (17.2% below list) — sets the bar for 1% rule.
- Cap rate 6.3% vs local median 4.3% in California — top-decile yield for the area; either an underpriced asset or a hidden risk that comps aren't pricing in. Stress-test before assuming the spread holds.
Location & tenants
- Location reads 73/100 on livability (#127 in MD) — a middle-class / working-renter tenant base. Strengths: employment A+, housing A+, health & safety A+; Watch: crime D+, amenities F, commute F.
- St. Mary'S County Public Schools (rural): math 23% / reading 38% proficiency, ranked #8 of 24 in MD (top 33%) — families likely to look elsewhere, expect single-tenant / working-renter base with shorter leases.
- Market conditions: 30 active listings in the ZIP; 1 comparable units currently listed for rent nearby; high-income renter base; 265 units permitted in St. Mary's County in 2024 (0 in 5+ unit buildings).
Forward outlook
- Local home prices are declining (-3.0%/yr); year-one equity from $2k of loan paydown is wiped out by about $9k of value loss. Plan a longer hold.
- St. Mary's County population projected at +16% by 2050 — long-run rental-demand tailwind backs the buy-and-hold thesis.
Negotiation context
- Only 2 days on market — expect competitive offers; lowballing is unlikely to land.
- Current owner paid $175k; list at $290k implies a 66% gain — meaningful room to come down on a strong offer.
Risks & watch-outs
- Climate carrying-cost: major wind risk, 67% chance of damaging wind over 30y; moderate wildfire risk; extreme-heat days projected 7→17/yr by 2055 (HVAC capex compounding) — expect insurance premiums to compound above CPI over the hold.
Questions for the listing agent
- What do current leases actually rent for vs. the listed asking? Can we see a recent rent roll and the last 12 months of T-12 income?
- What does the HOA fee cover, when was the last increase, and are there any pending special assessments or reserve-fund shortfalls?
- Is there a deadline driving the sale (1031 exchange, divorce, estate, relocation)? That informs how much negotiation room exists.
- Crime grade is D in this area — have there been break-ins, vandalism, or insurance claims at this property in the last 3 years? What carrier currently insures it and at what premium?
- The area grade is low — what's the realistic commute time and amenity access for the typical tenant pool here? Any planned neighborhood developments (good or bad) we should know about?
- What's the average days-on-market for RENTAL listings here right now (not sales)? A rising rental-DOM trend means longer vacancies and softer asking-rent achievability than the comps imply.
- What's the recent tenant-quality profile in this submarket — average credit score on applications, eviction rate, late-payment / NSF rate, and stable-employment percentage? A property-management company in the area should have these aggregated.
- How much new for-sale + rental construction is in the pipeline within 1–3 miles? Heavy new supply typically softens prices + rents 12–24 months out; constrained supply supports both.
Investment metrics
- 1% rule
- 0.83% ✗
- Cap rate
- 6.29%
- Cash-on-cash
- -0.01%
- DSCR
- 1.00
- GRM
- 10.1
CMA / ARV
- ARV (on-the-fly)
- $264,880
- Comps found
- 12
Show comp detail 12 sales within ~0.75 mi
| Address | Dist | Beds/Ba | Sqft | Sold | Price | $/sf | Match |
|---|---|---|---|---|---|---|---|
| 45732 Military Ln | 0.52mi | 3/2.5 | 1,587 (+3%) | 5mo | $289,000 | $182 | 67 |
| 45535 Knockeyon Ln | 0.03mi | 2/2.5 (-1) | 1,380 (-10%) | 17mo | $259,900 | $188 | 62 |
| 45529 Knockeyon Ln | 0.05mi | 2/2.5 (-1) | 1,374 (-11%) | 19mo | $250,000 | $182 | 59 |
| 45513 Knockeyon Ln | 0.07mi | 2/2.5 (-1) | 1,374 (-11%) | 19mo | $237,000 | $172 | 58 |
| 45615 Longfields Village Dr | 0.47mi | 3/3.0 | 1,704 (+11%) | 1mo | $286,000 | $168 | 58 |
| 45763 Church Dr | 0.53mi | 3/2.5 | 1,476 (-4%) | 14mo | $245,000 | $166 | 57 |
| 45750 Military Ln | 0.54mi | 3/2.5 | 1,476 (-4%) | 15mo | $255,000 | $173 | 56 |
| 22415 Greenview Ct | 0.54mi | 3/2.5 | 1,332 (-14%) | 6mo | $298,750 | $224 | 48 |
| 45761 Military Ln | 0.57mi | 3/2.5 | 1,452 (-6%) | 20mo | $242,000 | $167 | 48 |
| 45289 Woodstown Way | 0.65mi | 2/3.5 (-1) | 1,720 (+12%) | 2mo | $285,000 | $166 | 40 |
| 22438 Greenview Ct | 0.50mi | 3/2.5 | 1,328 (-14%) | 20mo | $172,000 | $130 | 37 |
| 22716 Othello Ln | 0.53mi | 2/3.0 (-1) | 1,740 (+13%) | 17mo | $260,000 | $149 | 32 |
Match score weights: distance 35% · size 25% · config 20% · recency 20%. Top-matched comps best support the ARV.
Projected returns pro-forma
-3.0% appreciation · 3.0% rent growth · sell at horizon
- IRR
- -16.3%
- Equity multiple
- 0.42×
- Total profit
- $-47,042
- Equity at exit
- $43,225
- IRR
- -8.1%
- Equity multiple
- 0.49×
- Total profit
- $-41,127
- Equity at exit
- $25,065
Cash invested: $81,172 (down + closing). Projections, not guarantees.
Landlord ↔ Tenant lean methodology
- Overall (STATE)
- 27 Tenant-Leaning
- State Maryland
- 27 Tenant-Leaning · D+14
- County
- — inherits STATE
- City
- — inherits STATE
ZIP-level market 20634
- Home prices YoY
- -5.7%
- Active inventory
- 30
- Price-to-rent
- 10.1×
Monthly cashflow live
- Estimated rent
- $2,401 medium interval (Pro) →
- Mortgage (P&I)
- −$1,520
- Tax from tax record
- −$166 /mo · $1,998/yr
- Insurance
- −$121
- HOA
- −$90
- Vacancy / Maint / Mgmt
- −$504
- Net cashflow
- $-1
Break-even live
Sensitivity live
| Price | -10% $164 | -5% $81 | +0% $-1 | +5% $-83 | +10% $-165 |
|---|---|---|---|---|---|
| Rent | -10% $-190 | -5% $-95 | +0% $-1 | +5% $94 | +10% $189 |
| Rate | -1.0pp $145 | -0.5pp $73 | base $-1 | +0.5pp $-76 | +1.0pp $-152 |
UW: 25.0% down · 7.5% · 30yr · 1.5% tax · 5.0% vac · 8.0% maint · 8.0% mgmt
Financing live
Cash to close
- Down payment
- $72,475
- Closing costs
- $8,697
- Reserves months
- —
- Total cash needed
- —
Loan-product check · same deal, 3 products live
Conventional
25% down · 7.5% · 30yr
- Down + closing
- —
- Monthly P&I
- —
- Monthly cashflow
- —
- DSCR
- —
- Eligible?
- —
Personal DTI + credit; lowest rate.
DSCR
20% down · 8.5% · 30yr
- Down + closing
- —
- Monthly P&I
- —
- Monthly cashflow
- —
- DSCR
- —
- Eligible?
- —
No personal income docs; deal must DSCR.
Hard money
10% down · 12.0% · 12mo
- Down + closing
- —
- Monthly P&I
- —
- Monthly cashflow
- —
- DSCR
- —
- Eligible?
- —
Short-term bridge; refi at stabilization.
Rent comps 1 comps
| Address | Beds | Baths | Sqft | Rent | $/sqft | DOM | Units | Dist |
|---|---|---|---|---|---|---|---|---|
| 23155 Park Place Way California, MD | 1.0–3.0 | 1.0–2.0 | 1039 | $2,495 | $2.40 | 5d | 1 | 1.13mi |
HOA detail
- Monthly dues
- $90 · $1,080/yr
Listing history 3 events
-
2026-06-07statusdays on market $289,900 Pending 2 DOM
-
2026-06-05remarks 693-char remark
-
2026-06-05$289,900 Active 1 DOM
ⓘ Source: listings_history table (triggers on properties + properties_extension) + one-shot
backfill from property_details.listing_events for pre-trigger history.
Tax reassessment forecast MD · Partial reset (capped growth)
- Current annual tax
- $1,998 · $166/mo
- Projected year-2 tax
- $2,579 · $215/mo
- Expected delta
- +$581/yr (+$48/mo · 29.1%)
ⓘ Screening estimate from a state-policy table — verify with the county assessor before closing.
Climate risk First Street
- Flood 1/10 Low FEMA zone X (unshaded) · 0% chance over 30 yrs
- Wildfire 5/10 Major
- Heat 9/10 Extreme 7 d/yr ≥101°F today · 17 d/yr by 30 yrs out
- Wind 6/10 Major 67% chance of damaging wind over 30 yrs
- Air quality 2/10 Low 1 unhealthy d/yr today · 2 by 30 yrs out
Nearby sold comps map
Loading sold comps map…
Walkable amenities ~0.75 mi
Loading nearby amenities…
Taxation est. · year 1
- Rental income
- $28,815
- − Mortgage interest
- −$16,239
- − Property taxes
- −$1,998
- − Insurance
- −$1,450
- − Repairs & maintenance
- −$2,305
- − Management
- −$2,305
- − HOA
- −$1,080
- − Depreciation
- −$8,433
- Taxable loss
- −$4,995
- Est. tax savings @ 24.0%
- +$1,199
- After-tax cash flow
- $1,192/yr
For passive investors: Depreciation is non-cash, so a rental often shows a tax loss while cash-flowing — sheltering income. Rental losses are passive: they offset passive income freely, and up to $25,000/yr can offset ordinary (W-2) income if you actively participate and your MAGI is under $100k (phasing out to $0 by $150k); unused losses carry forward. On sale, claimed depreciation is recaptured at up to 25%, and gains may owe capital-gains tax (a 1031 exchange can defer both). Figures are a year-1 estimate at your 24.0% rate — not tax advice; consult a CPA.
Schools (NCES district)
- District
- St. Mary'S County Public Schools
- NCES district ID
- 2400600
- Math proficiency
- 23% ▼ -23.00%
- Reading proficiency
- 38% ▼ -12.00%
- Median HH income
- $83,240
- Composite
- 29.74/100
- National rank
- #6444
- State rank
- #8 of 24 in MD
Livability — California
- Score
- 73/100
- State rank
- #127
- US rank
- #5421
Category grades
Schools grade is shown separately in the Schools card above.
Census & demographics
- Census place
- California, MD
- County
- Saint Marys County · 48,152 people
- City population
- 14,212
- Metro
- California-Lexington Park, MD
- Population (ZIP)
- 7,088
- Household income
- $139,375
- Rent vs Own
- Severe rent burden
- 111.0
Population outlook (St. Mary's County) Hauer SSP2
- Today (2025)
- 123,125 people
- By 2030
- 128,374 · +4.3%
- By 2040
- 137,305 · +11.5%
- By 2050
- 143,065 · +16.2%
- By 2075
- 153,408 · +24.6%
- By 2100
- 151,790 · +23.3%
Race, ethnicity, and origin ACS 2023
- Neighborhood character
- Diverse neighborhood (Simpson 0.58)
- Race & ethnicity
- White 57% Black 31% Two or more races 6% Hispanic / Latino 5% Asian 3%
- Common ancestry
- Slovak 3% Romanian 2% Lithuanian 2%
- Foreign-born
- 6% · Canada
- Languages at home
- 95% English-only · Spanish 2% Tagalog/Filipino 1% Other Asian/Pacific 1%
Political lean MEDSL · St. Mary's
- 2024 margin
- R (+17.2) · D 40.2% · R 57.4% · Other 2.4%
- 2008→2024 swing
- -4.4pp toward R · 2008: -12.8pp · 2024: -17.2pp
- All cycles
- 2024: R+17.2 2020: R+13.8 2016: R+24.6 2012: R+16.1 2008: R+12.8
Not yet ingested
- Civics
- —
Market trends
- HPI YoY
- ▼ -14.78%
- Current HPI
- 244.1447
- Rent YoY
- —
- Metro
- California-Lexington Park, MD
- State GDP YoY
- ▲ 2.97%
- F500 in state
- 12
Industry mix (Fortune 500 HQ in MD)
| Industry | F500 HQs | Revenue |
|---|---|---|
| Aerospace / Defense | 1 | $71B |
|
||
| Utilities | 1 | $25B |
|
||
| Hotels | 1 | $24B |
|
||
| Consumer Goods | 1 | $7B |
|
||
| Real Estate | 1 | $6B |
|
||
| Chemicals | 1 | $2B |
|
||
Price history
+65.7% since first listed3 events — show timeline
- 2026-06-04 Listed $289,900 BRIGHT MLS
- 2026-06-03 Coming Soon $289,900 BRIGHT MLS
- 2020-04-16 Sold (Public Records) $175,000 Public Records
Property tax history
+2.9%/yrLatest (2025): $1,998 · +3.7% YoY. Source: county tax records.
Cash-flow waterfall
monthlySold comps — $/sqft
last 12 mo · ≤1 miLoading sold comps…