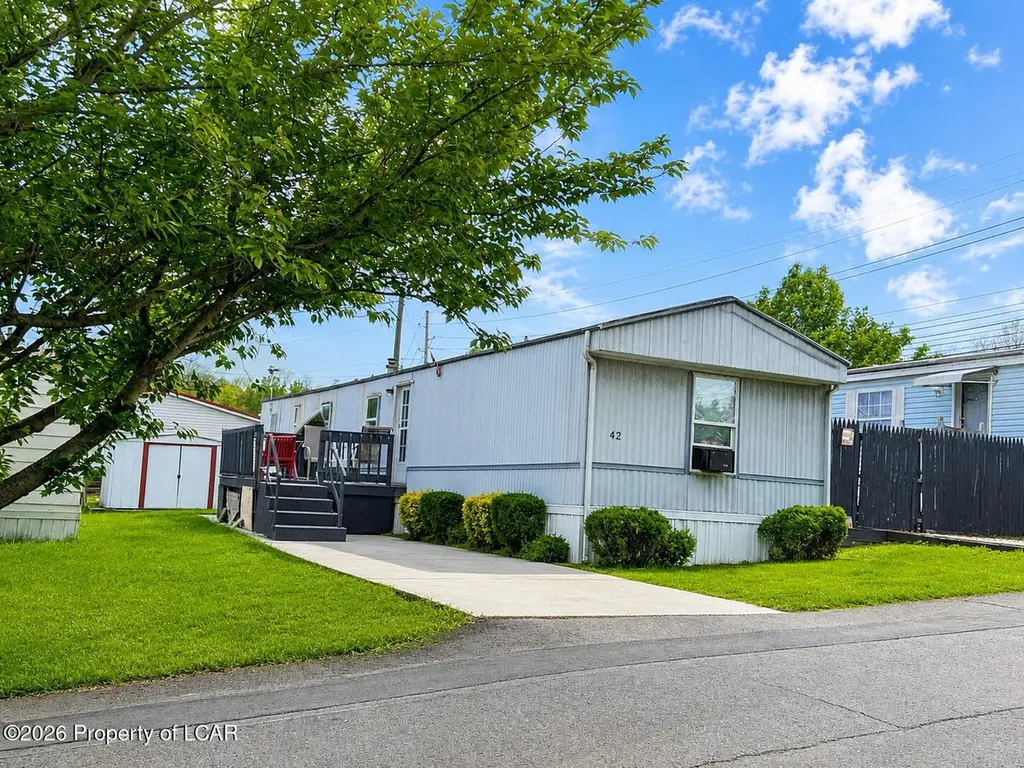
42 Sans Souci Trlr Ct · Wilkes-Barre, PA
Flood risk 7/10 · Major
- FEMA flood zone
- X (unshaded)
- Chance of flooding over 30 yrs
- 0.76%
- Est. flood insurance / yr
- $507 – $1,088
Fire risk 3/10 · Minor
- Est. fire insurance / yr
- $511 – $949
Heat risk 4/10 · Minor
- Hot days now (above 96°F)
- 7 days/yr
- Hot days in 30 yrs
- 16 days/yr
Wind risk 3/10 · Minor
- Chance of severe wind over 30 yrs
- 5.0%
Air-quality risk 1/10 · Minimal
- Unhealthy air days now
- 0 days/yr
- Unhealthy air days in 30 yrs
- 0 days/yr
Risk factors via First Street. Map © Google.
Why this score? — see what drove the C+ grade
The composite is a weighted blend of 9 inputs, each scored 0–100. Each bar is that input's sub-score; the figure is the points it added to the 100-point composite (weight × sub-score).
- Cash flow +30.0/30.0
- 1% rule +10.0/10.0
- DSCR +10.0/10.0
- ARV discount +3.3/15.0
- Rent growth +2.5/5.0
- Livability +2.5/5.0
- Condition / age +2.5/5.0
- Schools +1.9/10.0
- Appreciation +0.0/10.0
$60,000
🖨 Deal sheet 📄 Offer letter ✓ Due diligence
Listing remarks MLS
This charming mobile home in Hanover Township offers the perfect blend of comfort and affordability. With 3 bedrooms and 2 bathrooms, it provides ample space for relaxation and privacy. One of the highlights of this property is its great outside deck, providing an ideal space for enjoying the fresh air and entertaining guests.
Key facts
- Large deck
- Private driveway
- Listed 7 days
Tags
Property features AI
Exterior
- Utilities: Public water; Public sewer
- Home design: Manufactured home (residential); One level
- Construction: Metal siding
- Exterior features: Deck; Cleared lot
Interior
- Bathrooms: 2 full bathrooms
- Heating & cooling: Propane forced-air heating; Central air; Ceiling fans
- Interior features: Eat-in kitchen; Six total rooms
Neighborhood map
What this means for you Summary
Snapshot
- This is a 3-bed/2.0-bath manufactured listed at $60k.
Deal economics
- At list price, monthly cash flow is $617 ($7k/yr) — positive.
- The deal already cash-flows at list — no discount required.
- Meets the 1% rule at list price ($1k rent vs $60k).
- Cap rate 20.0% vs local median 5.7% in Wilkes-Barre — top-decile yield for the area; either an underpriced asset or a hidden risk that comps aren't pricing in. Stress-test before assuming the spread holds.
Location & tenants
- Location reads: area grade C — affects rentability + tenant quality, not the cash-flow math above.
- Hanover Area SD (suburban): math 19% / reading 25% proficiency, ranked #484 of 539 in PA (top 90%) — low school quality limits family demand, transient renter base, plan for 1-2y turnover.
- Market conditions: 81 active listings in the ZIP; 2 comparable units currently listed for rent nearby; 349 units permitted in Luzerne County in 2024 (16 in 5+ unit buildings).
Forward outlook
- Local home prices are declining (-3.0%/yr); year-one equity from $415 of loan paydown is wiped out by about $2k of value loss. Plan a longer hold.
- Luzerne County population projected at +4% by 2050 — modest demand growth; plan on rents tracking national, not racing it.
- At projected returns (-3.0% appreciation + 3.0% rent growth), your $17k cash investment doubles in ~3 years — after that, you're playing with house money.
Negotiation context
- Only 8 days on market — expect competitive offers; lowballing is unlikely to land.
- 2 sale attempts since 2y ago with the ask held roughly flat each time — persistent listings suggest the price (not the market) is what's stuck; bring a comps-based counter.
Risks & watch-outs
- Watch-outs: flood insurance adds $66/mo.
- Climate carrying-cost: major flood risk — expect insurance premiums to compound above CPI over the hold.
Questions for the listing agent
- What's the actual annual flood-insurance premium (NFIP or private), and is the property in a SFHA with mandatory coverage?
- Is there a deadline driving the sale (1031 exchange, divorce, estate, relocation)? That informs how much negotiation room exists.
- What's the average days-on-market for RENTAL listings here right now (not sales)? A rising rental-DOM trend means longer vacancies and softer asking-rent achievability than the comps imply.
- What's the recent tenant-quality profile in this submarket — average credit score on applications, eviction rate, late-payment / NSF rate, and stable-employment percentage? A property-management company in the area should have these aggregated.
- How much new for-sale + rental construction is in the pipeline within 1–3 miles? Heavy new supply typically softens prices + rents 12–24 months out; constrained supply supports both.
Investment metrics
- 1% rule
- 2.20% ✓
- Cap rate
- 19.95%
- Cash-on-cash
- 48.79%
- DSCR
- 3.17
- GRM
- 3.8
CMA / ARV
- ARV (on-the-fly)
- $54,880
- Comps found
- 2
Show comp detail 2 sales within ~0.75 mi
| Address | Dist | Beds/Ba | Sqft | Sold | Price | $/sf | Match |
|---|---|---|---|---|---|---|---|
| 42 Sans Souci Trlr Ct | 0.00mi | 3/2.0 | 980 (0%) | 23mo | $55,000 | $56 | 81 |
| 33 Sans Souci Trailer | 0.03mi | 2/2.0 (-1) | 900 (-8%) | 19mo | $44,000 | $49 | 64 |
Match score weights: distance 35% · size 25% · config 20% · recency 20%. Top-matched comps best support the ARV.
Projected returns pro-forma
-3.0% appreciation · 3.0% rent growth · sell at horizon
- IRR
- 41.0%
- Equity multiple
- 2.76×
- Total profit
- $29,576
- Equity at exit
- $8,946
- IRR
- 47.3%
- Equity multiple
- 5.55×
- Total profit
- $76,433
- Equity at exit
- $5,188
Cash invested: $16,800 (down + closing). Projections, not guarantees.
Landlord ↔ Tenant lean methodology
- Overall (STATE)
- 62 Landlord-Friendly
- State Pennsylvania
- 62 Landlord-Friendly · EVEN
- County
- — inherits STATE
- City
- — inherits STATE
ZIP-level market 18706
- Active inventory
- 81
- Price-to-rent
- 3.8×
Monthly cashflow live
- Estimated rent
- $1,320 medium interval (Pro) →
- Mortgage (P&I)
- −$315
- Tax from tax record
- −$20 /mo · $237/yr
- Insurance
- −$25
- Flood insurance flood zone
- −$66 /mo · $798/yr
- HOA
- −$0
- Vacancy / Maint / Mgmt
- −$277
- Net cashflow
- $617
Break-even live
UW: 25.0% down · 7.5% · 30yr · 1.5% tax · 5.0% vac · 8.0% maint · 8.0% mgmt
Financing live
Cash to close
- Down payment
- $15,000
- Closing costs
- $1,800
- Reserves months
- —
- Total cash needed
- —
Loan-product check · same deal, 3 products live
Conventional
25% down · 7.5% · 30yr
- Down + closing
- —
- Monthly P&I
- —
- Monthly cashflow
- —
- DSCR
- —
- Eligible?
- —
Personal DTI + credit; lowest rate.
DSCR
20% down · 8.5% · 30yr
- Down + closing
- —
- Monthly P&I
- —
- Monthly cashflow
- —
- DSCR
- —
- Eligible?
- —
No personal income docs; deal must DSCR.
Hard money
10% down · 12.0% · 12mo
- Down + closing
- —
- Monthly P&I
- —
- Monthly cashflow
- —
- DSCR
- —
- Eligible?
- —
Short-term bridge; refi at stabilization.
Rent comps 2 comps
| Address | Beds | Baths | Sqft | Rent | $/sqft | DOM | Units | Dist |
|---|---|---|---|---|---|---|---|---|
| 52 Diamond Ave Hanover Township, PA | 2.0 | 1.0 | 820 | $925 | $1.13 | 21d | 1 | 0.61mi |
| 3122 S Main St Unit 2 Wilkes-Barre, PA | 4.0 | 1.0 | 1100 | $1,300 | $1.18 | 21d | 1 | 1.49mi |
Listing history 4 events
-
2026-05-18$60,000 Active
-
2024-08-03soldstatus $55,000 Closed 328-char remark
Show marketing remark (328 chars)
This charming mobile home in Hanover Township offers the perfect blend of comfort and affordability. With 3 bedrooms and 2 bathrooms, it provides ample space for relaxation and privacy. One of the highlights of this property is its great outside deck, providing an ideal space for enjoying the fresh air and entertaining guests.
-
2024-06-05status Pending 328-char remark
Show marketing remark (328 chars)
This charming mobile home in Hanover Township offers the perfect blend of comfort and affordability. With 3 bedrooms and 2 bathrooms, it provides ample space for relaxation and privacy. One of the highlights of this property is its great outside deck, providing an ideal space for enjoying the fresh air and entertaining guests.
-
2024-05-27$55,000 Active 328-char remark
Show marketing remark (328 chars)
This charming mobile home in Hanover Township offers the perfect blend of comfort and affordability. With 3 bedrooms and 2 bathrooms, it provides ample space for relaxation and privacy. One of the highlights of this property is its great outside deck, providing an ideal space for enjoying the fresh air and entertaining guests.
ⓘ Source: listings_history table (triggers on properties + properties_extension) + one-shot
backfill from property_details.listing_events for pre-trigger history.
Tax reassessment forecast PA · Partial reset (capped growth)
- Current annual tax
- $237 · $20/mo
- Projected year-2 tax
- $592 · $49/mo
- Expected delta
- +$356/yr (+$30/mo · 150.4%)
ⓘ Screening estimate from a state-policy table — verify with the county assessor before closing.
Climate risk First Street
- Flood 7/10 Severe FEMA zone X (unshaded) · 76% chance over 30 yrs
- Wildfire 3/10 Moderate
- Heat 4/10 Moderate 7 d/yr ≥96°F today · 16 d/yr by 30 yrs out
- Wind 3/10 Moderate 5% chance of damaging wind over 30 yrs
- Air quality 1/10 Low 0 unhealthy d/yr today · 0 by 30 yrs out
Nearby sold comps map
Loading sold comps map…
Walkable amenities ~0.75 mi
Loading nearby amenities…
Taxation est. · year 1
- Rental income
- $15,834
- − Mortgage interest
- −$3,361
- − Property taxes
- −$237
- − Insurance
- −$1,098
- − Repairs & maintenance
- −$1,267
- − Management
- −$1,267
- − Depreciation
- −$1,745
- Taxable income
- $6,860
- Est. tax owed @ 24.0%
- −$1,646
- After-tax cash flow
- $5,753/yr
For passive investors: Depreciation is non-cash, so a rental often shows a tax loss while cash-flowing — sheltering income. Rental losses are passive: they offset passive income freely, and up to $25,000/yr can offset ordinary (W-2) income if you actively participate and your MAGI is under $100k (phasing out to $0 by $150k); unused losses carry forward. On sale, claimed depreciation is recaptured at up to 25%, and gains may owe capital-gains tax (a 1031 exchange can defer both). Figures are a year-1 estimate at your 24.0% rate — not tax advice; consult a CPA.
Schools (NCES district)
- District
- Hanover Area SD
- NCES district ID
- 4211420
- Math proficiency
- 19% ▼ -3.00%
- Reading proficiency
- 25% ▼ -21.00%
- Median HH income
- $40,015
- Composite
- 18.6/100
- National rank
- #8903
- State rank
- #484 of 539 in PA
Livability — Wilkes-Barre
No livability data for this city. (Only ~50 U.S. cities are tracked.)
Census & demographics
- County
- Luzerne County · 118,885 people
- City population
- 73,981
- Metro
- Scranton--Wilkes-Barre, PA
- Population (ZIP)
- 16,387
- Household income
- $58,558
- Rent vs Own
- Severe rent burden
- 568.0
Population outlook (Luzerne County) Hauer SSP2
- Today (2025)
- 319,505 people
- By 2030
- 319,943 · +0.1%
- By 2040
- 322,643 · +1.0%
- By 2050
- 330,817 · +3.5%
- By 2075
- 379,145 · +18.7%
- By 2100
- 431,908 · +35.2%
Race, ethnicity, and origin ACS 2023
- Neighborhood character
- Predominantly White (76%)
- Race & ethnicity
- White 76% Hispanic / Latino 17% Two or more races 11% Black 3%
- Hispanic origin (detail)
- Puerto Rican 9% Dominican 4%
- Common ancestry
- Romanian 18% Scotch-Irish 3% Subsaharan African 1%
- Foreign-born
- 6% · Canada
- Languages at home
- 88% English-only · Spanish 10% Other Asian/Pacific 1%
Political lean MEDSL · Luzerne
- 2024 margin
- R (+19.2) · D 40.0% · R 59.2%
- 2008→2024 swing
- -27.6pp toward R · 2008: 8.4pp · 2024: -19.2pp
- All cycles
- 2024: R+19.2 2020: R+14.4 2016: R+19.6 2012: D+4.8 2008: D+8.4
Not yet ingested
- Civics
- —
Market trends
- HPI YoY
- ▼ -150.02%
- Current HPI
- 196.19
- Rent YoY
- —
- Metro
- Scranton--Wilkes-Barre, PA
- State GDP YoY
- ▲ 1.68%
- F500 in state
- 34
Industry mix (Fortune 500 HQ in PA)
| Industry | F500 HQs | Revenue |
|---|---|---|
| Healthcare | 2 | $309B |
|
||
| Insurance | 2 | $27B |
|
||
| Telecommunications / Media | 1 | $124B |
|
||
| Industrial Distribution | 1 | $22B |
|
||
| Financial Services | 1 | $20B |
|
||
| Chemicals / Materials | 1 | $18B |
|
||
Price history
+9.1% since first listed4 events — show timeline
- 2026-05-18 Listed $60,000 LCAR
- 2024-08-03 Sold (MLS) $55,000 LCAR
- 2024-06-05 Pending — LCAR
- 2024-05-27 Listed $55,000 LCAR
Property tax history
+0.8%/yrLatest (2026): $237 · +0.3% YoY. Source: county tax records.
Cash-flow waterfall
monthlySold comps — $/sqft
last 12 mo · ≤1 miLoading sold comps…