 Fourplex
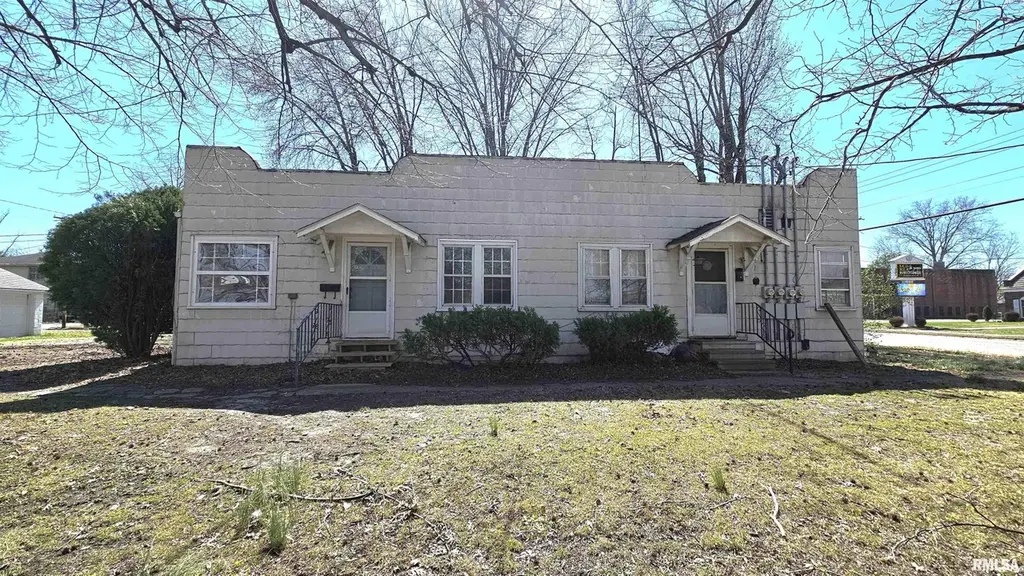
500 N Main St · Benton, IL
Flood risk No data
- FEMA flood zone
- —
- Chance of flooding over 30 yrs
- —
- Est. flood insurance / yr
- —
Fire risk No data
- Est. fire insurance / yr
- —
Heat risk No data
- Hot days now (above threshold)
- —
- Hot days in 30 yrs
- —
Wind risk No data
- Chance of severe wind over 30 yrs
- —
Air-quality risk No data
- Unhealthy air days now
- —
- Unhealthy air days in 30 yrs
- —
Risk factors via First Street. Map © Google.
Why this score? — see what drove the B- grade
The composite is a weighted blend of 9 inputs, each scored 0–100. Each bar is that input's sub-score; the figure is the points it added to the 100-point composite (weight × sub-score).
- Cash flow +30.0/30.0
- 1% rule +10.0/10.0
- DSCR +10.0/10.0
- ARV discount +7.5/15.0
- Livability +3.2/5.0
- Rent growth +2.5/5.0
- Condition / age +2.2/5.0
- Schools +2.0/10.0
- Appreciation +0.0/10.0
$137,500
🖨 Deal sheet 📄 Offer letter ✓ Due diligence
Multi-family units
County records classify this as Multi-Family (2-4 Unit). Listing-text estimate: 4 units. confirmed
Listing remarks MLS
4 plex with detached garage. All 4 units leased, also 2 of the 3 garage spaces leased. 2 units freshly remodeled.
Key facts
- 0.31 acre lot
- 4 parking spots
- Built 1921
Property features AI
Finance
- Other: Building area total reported as 2100 (unit of measure not displayed)
- Financial info: Unit rents reported: $450, $495, $395, $500
- HOA & community: No HOA information provided
Exterior
- Parking: Total of 4 parking spaces (each unit assigned 1 space, uncovered); No covered parking
- Security: No security details provided
- Utilities: Public water; Public sewer
- Home design: Residential income property; Quadruplex; Built in 1921
- Construction: Composition roof; Built in 1921
- Exterior features: Corner lot; Paved road access; Composition roof
Interior
- Kitchen: No specific kitchen appliance details provided
- Bedrooms: Four 1-bedroom units
- Flooring: No flooring details provided
- Bathrooms: Each unit has one full bathroom
- Heating & cooling: Electric heating; Gas water heater; Wall units; Window units
- Interior features: Unfinished basement; No in-unit laundry
- Laundry & utility: No laundry on site
Neighborhood map
What this means for you Summary
Snapshot
- This is a 4 × 1-bed/1-bath units multifamily listed at $138k. Condition is rated fair.
Deal economics
- At list price, monthly cash flow is $1k ($18k/yr) — positive. Per door: $367/mo.
- The deal already cash-flows at list — no discount required.
- Meets the 1% rule at list price ($3k rent vs $138k).
- Recommended offer: $129k (6.0% below list) — sets the bar for market timing.
- Cap rate 19.1% vs local median 5.3% in Benton — top-decile yield for the area; either an underpriced asset or a hidden risk that comps aren't pricing in. Stress-test before assuming the spread holds.
Location & tenants
- Location reads 63/100 on livability (#785 in IL) — a middle-class / working-renter tenant base. Strengths: cost of living A+, housing A+, health & safety A+; Watch: amenities F, commute F, employment D-.
- BentonConsolidatedHsd 103 (town): math 20% / reading 20% proficiency, ranked #727 of 919 in IL (top 79%) — low school quality limits family demand, transient renter base, plan for 1-2y turnover.
- Zoned schools: Benton Cons High School (math 17% / reading 27%, grade F, #319 of 693 statewide, top 50%, 577 students, 0% FRL).
- Market conditions: 73 active listings in the ZIP; 17 units permitted in Franklin County in 2024 (0 in 5+ unit buildings).
Forward outlook
- Local home prices are declining (-3.0%/yr); year-one equity from $951 of loan paydown is wiped out by about $4k of value loss. Plan a longer hold.
- Franklin County population projected at -16% by 2050 — secular population decline; favor cash flow + early exit over multi-decade hold.
- At projected returns (-3.0% appreciation + 3.0% rent growth), your $38k cash investment doubles in ~3 years — after that, you're playing with house money.
Negotiation context
- It's been on market 69 days — a 6% lower offer ($129k) is reasonable based on typical stale-listing flexibility.
- 5 sale attempts since 10y ago with the ask held roughly flat each time — persistent listings suggest the price (not the market) is what's stuck; bring a comps-based counter.
- Current owner paid $78k; list at $138k implies a 76% gain — meaningful room to come down on a strong offer.
Risks & watch-outs
- Watch-outs: built in 1921 — expect roof / HVAC / electrical / plumbing capex.
Questions for the listing agent
- It's been on market 69 days. Have you received any prior offers? Is the seller open to a 6% concession, seller financing, or rate buy-down credit?
- Can we see the unit-by-unit rent roll, current vacancy, and any below-market leases? What's the average tenancy length?
- What capital expenditures (roof, boiler, parking lot, exteriors) have been made in the last 5 years, and what's planned in the next 2?
- Have any recent inspections been done? Can we get a copy of the seller's disclosures and any deferred-maintenance estimates?
- Built in 1921 — when were the roof, HVAC, electrical panel, plumbing, and water heater last replaced?
- Why hasn't it sold? Are there any deal-killer items the seller is aware of (foundation, flood, title, zoning, code violations)?
- Is there a deadline driving the sale (1031 exchange, divorce, estate, relocation)? That informs how much negotiation room exists.
- Schools are F-rated, which usually means shorter tenancies and higher turnover. Who's the typical renter profile here, and what's been the actual vacancy rate?
- What's the average days-on-market for RENTAL listings here right now (not sales)? A rising rental-DOM trend means longer vacancies and softer asking-rent achievability than the comps imply.
- What's the recent tenant-quality profile in this submarket — average credit score on applications, eviction rate, late-payment / NSF rate, and stable-employment percentage? A property-management company in the area should have these aggregated.
- How much new apartment / multifamily construction is in the pipeline within 1–3 miles? Heavy new supply (>2% of stock underway) typically softens rents 12–24 months out; light construction supports rent growth.
Investment metrics
- 1% rule
- 2.22% ✓
- Cap rate
- 19.09%
- Cash-on-cash
- 45.71%
- DSCR
- 3.03
- GRM
- 3.7
CMA / ARV
No comps found within radius.
Projected returns pro-forma
-3.0% appreciation · 3.0% rent growth · sell at horizon
- IRR
- 42.9%
- Equity multiple
- 2.85×
- Total profit
- $71,160
- Equity at exit
- $20,502
- IRR
- 49.0%
- Equity multiple
- 5.74×
- Total profit
- $182,412
- Equity at exit
- $11,888
Cash invested: $38,500 (down + closing). Projections, not guarantees.
Landlord ↔ Tenant lean methodology
- Overall (STATE)
- 43 Moderately Tenant-Leaning
- State Illinois
- 43 Moderately Tenant-Leaning · D+7
- County
- — inherits STATE
- City
- — inherits STATE
ZIP-level market 62812
- Active inventory
- 73
- Price-to-rent
- 15.0×
Monthly cashflow live
- Estimated rent
- $3,059 medium interval (Pro) →
- Mortgage (P&I)
- −$721
- Tax est. 1.5%
- −$172 /mo · $2,062/yr
- Insurance
- −$57
- HOA
- −$0
- Vacancy / Maint / Mgmt
- −$642
- Net cashflow
- $1,466
Break-even live
4-unit breakdown (identical units grouped — click to expand)
| Units | Beds | Baths | Est. rent |
|---|---|---|---|
| 4× units | 1 | 1 | $3,060 |
| #1 | 1 | 1 | $765 |
| #2 | 1 | 1 | $765 |
| #3 | 1 | 1 | $765 |
| #4 | 1 | 1 | $765 |
| Total (4 units) | $3,059 | ||
UW: 25.0% down · 7.5% · 30yr · 1.5% tax · 5.0% vac · 8.0% maint · 8.0% mgmt
Financing live
Cash to close
- Down payment
- $34,375
- Closing costs
- $4,125
- Reserves months
- —
- Total cash needed
- —
Loan-product check · same deal, 3 products live
Conventional
25% down · 7.5% · 30yr
- Down + closing
- —
- Monthly P&I
- —
- Monthly cashflow
- —
- DSCR
- —
- Eligible?
- —
Personal DTI + credit; lowest rate.
DSCR
20% down · 8.5% · 30yr
- Down + closing
- —
- Monthly P&I
- —
- Monthly cashflow
- —
- DSCR
- —
- Eligible?
- —
No personal income docs; deal must DSCR.
Hard money
10% down · 12.0% · 12mo
- Down + closing
- —
- Monthly P&I
- —
- Monthly cashflow
- —
- DSCR
- —
- Eligible?
- —
Short-term bridge; refi at stabilization.
Listing history 26 events
-
2026-06-18days on market $137,500 Active 69 DOM
-
2026-06-17days on market $137,500 Active 68 DOM
-
2026-06-16days on market $137,500 Active 67 DOM
-
2026-06-15days on market $137,500 Active 66 DOM
-
2026-06-13days on market $137,500 Active 64 DOM
-
2026-06-12days on market $137,500 Active 63 DOM
-
2026-06-09days on market $137,500 Active 60 DOM
-
2026-06-08days on market $137,500 Active 59 DOM
-
2026-06-07days on market $137,500 Active 58 DOM
-
2026-06-07days on market $137,500 Active 57 DOM
-
2026-06-04days on market $137,500 Active 54 DOM
-
2026-06-02days on market $137,500 Active 53 DOM
-
2026-06-01days on market $137,500 Active 52 DOM
-
2026-05-31days on market $137,500 Active 51 DOM
-
2026-05-31days on market $137,500 Active 50 DOM
-
2026-04-10$139,900 Active
-
2021-10-20soldstatus $78,000 113-char remark
Show marketing remark (113 chars)
4 plex with detached garage. All 4 units leased, also 2 of the 3 garage spaces leased. 2 units freshly remodeled.
-
2021-10-20soldstatus $78,000 113-char remark
Show marketing remark (113 chars)
4 plex with detached garage. All 4 units leased, also 2 of the 3 garage spaces leased. 2 units freshly remodeled.
-
2021-08-06historical
-
2021-04-27$82,000 113-char remark
Show marketing remark (113 chars)
4 plex with detached garage. All 4 units leased, also 2 of the 3 garage spaces leased. 2 units freshly remodeled.
-
2021-04-27$82,000 113-char remark
Show marketing remark (113 chars)
4 plex with detached garage. All 4 units leased, also 2 of the 3 garage spaces leased. 2 units freshly remodeled.
-
2016-06-20soldstatus $50,000
-
2016-06-20soldstatus $50,000
-
2016-05-28$58,000
-
2016-05-28$58,000
-
2002-10-15historical
ⓘ Source: listings_history table (triggers on properties + properties_extension) + one-shot
backfill from property_details.listing_events for pre-trigger history.
Nearby sold comps map
Loading sold comps map…
Walkable amenities ~0.75 mi
Loading nearby amenities…
Taxation est. · year 1
- Rental income
- $36,708
- − Mortgage interest
- −$7,702
- − Property taxes
- −$2,062
- − Insurance
- −$688
- − Repairs & maintenance
- −$2,937
- − Management
- −$2,937
- − Depreciation
- −$4,000
- Taxable income
- $16,383
- Est. tax owed @ 24.0%
- −$3,932
- After-tax cash flow
- $13,665/yr
For passive investors: Depreciation is non-cash, so a rental often shows a tax loss while cash-flowing — sheltering income. Rental losses are passive: they offset passive income freely, and up to $25,000/yr can offset ordinary (W-2) income if you actively participate and your MAGI is under $100k (phasing out to $0 by $150k); unused losses carry forward. On sale, claimed depreciation is recaptured at up to 25%, and gains may owe capital-gains tax (a 1031 exchange can defer both). Figures are a year-1 estimate at your 24.0% rate — not tax advice; consult a CPA.
Condition & rehab AI · 12 photos
This 4-unit property requires moderate rehabilitation to improve its condition and increase its resale and rental value.
Repairs flagged
- Major roof — visible wear
- Major exterior siding — weathered condition
- Major landscaping — overgrown vegetation
Value-add opportunities
- Both paint exterior siding — enhances curb appeal and value
- Both replace roof — extends lifespan and improves appearance
- Both landscaping — enhances curb appeal and value
Renovation cost estimate screening
| Repair item | Severity | Est. cost |
|---|---|---|
| roof · visible wear | Major | $15,000–50,000 |
| exterior siding · weathered condition | Major | $15,000–50,000 |
| landscaping · overgrown vegetation | Major | $15,000–50,000 |
| Total estimated repair cost · 3 items | $45,000–150,000 |
Value-add ROI direction
- Both paint exterior siding — enhances curb appeal and value ↑
- Both replace roof — extends lifespan and improves appearance ↑
- Both landscaping — enhances curb appeal and value ↑
ⓘ Cost ranges are severity-bucket heuristics (US national rule-of-thumb). Get contractor quotes + a written scope before underwriting a rehab budget.
Schools (NCES district)
- District
- BentonConsolidatedHsd 103
- NCES district ID
- 1705970
- Math proficiency
- 20% ▬ 0.00%
- Reading proficiency
- 20% ▬ 0.00%
- Median HH income
- $35,473
- Composite
- 19.77/100
- National rank
- #13902
- State rank
- #727 of 919 in IL
Livability — Benton
- Score
- 63/100
- State rank
- #785
- US rank
- #15667
Category grades
Schools grade is shown separately in the Schools card above.
Census & demographics
- Census place
- Benton, IL
- City population
- 11,441
- Population (ZIP)
- 11,441
Population outlook (Franklin County) Hauer SSP2
- Today (2025)
- 37,954 people
- By 2030
- 36,828 · -3.0%
- By 2040
- 34,452 · -9.2%
- By 2050
- 31,855 · -16.1%
- By 2075
- 25,171 · -33.7%
- By 2100
- 18,462 · -51.4%
Race, ethnicity, and origin ACS 2023
- Neighborhood character
- Predominantly White (92%)
- Race & ethnicity
- White 92% Two or more races 6% Hispanic / Latino 3%
- Common ancestry
- Slovak 2% Romanian 2% Lithuanian 1%
- Foreign-born
- 1% · Vietnam, Canada
- Languages at home
- 96% English-only · Spanish 2% Other Indo-European 1% Vietnamese 1%
Political lean MEDSL · Franklin
- 2024 margin
- Solid R (+50.6) · D 24.1% · R 74.6% · Other 1.3%
- 2008→2024 swing
- -47.8pp toward R · 2008: -2.8pp · 2024: -50.6pp
- All cycles
- 2024: R+50.6 2020: R+47.5 2016: R+45.3 2012: R+16.8 2008: R+2.8
Not yet ingested
- Civics
- —
Market trends
- HPI YoY
- ▼ -87.17%
- Current HPI
- 109.0501
- Rent YoY
- —
- Metro
- —
- State GDP YoY
- ▲ 1.59%
- F500 in state
- 60
Industry mix (Fortune 500 HQ in IL)
| Industry | F500 HQs | Revenue |
|---|---|---|
| Insurance | 4 | $201B |
|
||
| Consumer Goods | 4 | $87B |
|
||
| Industrial Machinery | 3 | $64B |
|
||
| Healthcare | 2 | $55B |
|
||
| Retail / Pharmacy | 1 | $148B |
|
||
| Agriculture / Food | 1 | $86B |
|
||
Price history
+141.2% since first listed11 events — show timeline
- 2026-04-10 Listed $139,900 RMLSA as Distributed by MLS Grid
- 2021-10-20 Sold (MLS) $78,000 RMLSA as Distributed by MLS Grid
- 2021-10-20 Sold (MLS) $78,000 MRED as Distributed by MLS Grid
- 2021-08-06 Listing Removed — RMLSA as Distributed by MLS Grid
- 2021-04-27 Listed $82,000 RMLSA as Distributed by MLS Grid
- 2021-04-27 Listed $82,000 MRED as Distributed by MLS Grid
- 2016-06-20 Sold (MLS) $50,000 RMLSA as Distributed by MLS Grid
- 2016-06-20 Sold (MLS) $50,000 MRED as Distributed by MLS Grid
- 2016-05-28 Listed $58,000 RMLSA as Distributed by MLS Grid
- 2016-05-28 Listed $58,000 MRED as Distributed by MLS Grid
- 2002-10-15 Listing Removed — MRED as Distributed by MLS Grid
Cash-flow waterfall
monthlySold comps — $/sqft
last 12 mo · ≤1 miLoading sold comps…