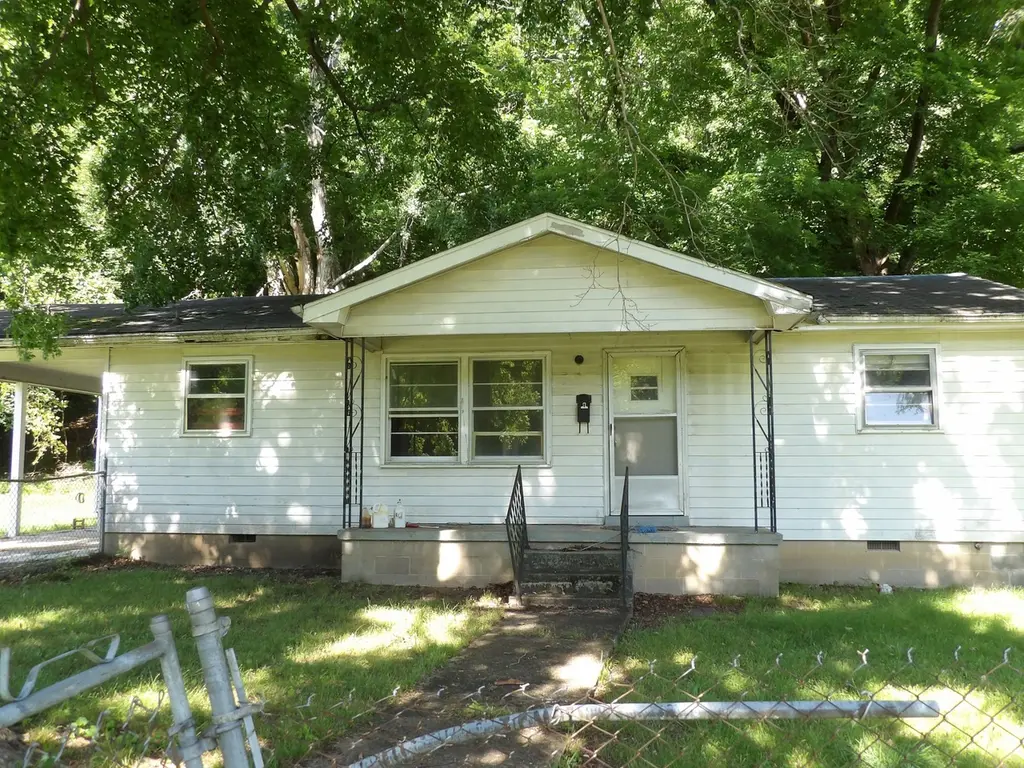
241 Lomax Ave · Waverly, TN
Flood risk 9/10 · Severe
- FEMA flood zone
- X (unshaded)
- Chance of flooding over 30 yrs
- 0.99%
- Est. flood insurance / yr
- $507 – $1,088
Fire risk 4/10 · Minor
- Est. fire insurance / yr
- $949 – $1,763
Heat risk 5/10 · Moderate
- Hot days now (above 107°F)
- 7 days/yr
- Hot days in 30 yrs
- 20 days/yr
Wind risk 4/10 · Minor
- Chance of severe wind over 30 yrs
- 11.0%
Air-quality risk 1/10 · Minimal
- Unhealthy air days now
- 0 days/yr
- Unhealthy air days in 30 yrs
- 0 days/yr
Risk factors via First Street. Map © Google.
Why this score? — see what drove the B grade
The composite is a weighted blend of 9 inputs, each scored 0–100. Each bar is that input's sub-score; the figure is the points it added to the 100-point composite (weight × sub-score).
- Cash flow +30.0/30.0
- 1% rule +10.0/10.0
- DSCR +10.0/10.0
- ARV discount +7.5/15.0
- Livability +3.1/5.0
- Appreciation +2.8/10.0
- Rent growth +2.5/5.0
- Condition / age +2.5/5.0
- Schools +1.9/10.0
$52,900
🖨 Deal sheet 📄 Offer letter ✓ Due diligence
Listing remarks
This house is in need of a complete remodel, including a new roof. The back part of the roof has collapsed and has fallen in one of the bedrooms. This is definately a fixer upper. The house has been in the same family for many years and has been unoccupied for a long time with no maintenance done at all. Included in this sale is the house & lot along with a 3.2 acres that is located behind the house.
Key facts
- 3.65 acre lot
- 5 parking spots
- Built 1965
Property features AI
Exterior
- Parking: Attached parking; Driveway; Carport (1 space); Total 5 parking spaces (4 open, 1 covered)
- Utilities: Public water; Public sewer; Water available
- Home design: Single family residence; One story; Residential property
- Construction: Brick, frame, and wood siding construction; Shingle roof; Block foundation; Built approximately (year approximate)
- Exterior features: Corner lot; Level lot; Wooded lot
Interior
- Kitchen: Eat-in kitchen
- Bedrooms: 2 bedrooms (both on the main level)
- Flooring: Wood flooring; Vinyl flooring
- Bathrooms: 1 full bathroom
- Heating & cooling: No heating; No cooling
- Interior features: Eat-in kitchen; Crawl space basement
- Laundry & utility: Washer hookup; Electric dryer hookup
Neighborhood map
What this means for you Summary
Snapshot
- This is a 2-bed/1.0-bath single-family listed at $53k.
Deal economics
- At list price, monthly cash flow is $537 ($6k/yr) — positive.
- The deal already cash-flows at list — no discount required.
- Meets the 1% rule at list price ($1k rent vs $53k).
- Cap rate 20.0% vs local median 2.8% in Waverly — top-decile yield for the area; either an underpriced asset or a hidden risk that comps aren't pricing in. Stress-test before assuming the spread holds.
Location & tenants
- Location reads 62/100 on livability (#209 in TN) — a middle-class / working-renter tenant base. Strengths: crime A+, cost of living A+, housing A; Watch: amenities F, commute F, employment F.
- Humphreys County (rural): math 21% / reading 24% proficiency, ranked #103 of 139 in TN (top 74%) — low school quality limits family demand, transient renter base, plan for 1-2y turnover.
- Zoned schools: Waverly Elementary (math 47% / reading 37%, grade F, #191 of 952 statewide, top 22%, 359 students, 0% FRL); Waverly Central High School (math 8% / reading 37%, grade F, #156 of 332 statewide, top 49%, 503 students, 0% FRL) — zoned schools average 0% FRL vs 49% district-wide (49 pts lower); this property's tenant base skews higher-income than the district average.
- Market conditions: 155 active listings in the ZIP; 2 comparable units currently listed for rent nearby; 39 units permitted in Humphreys County in 2024 (0 in 5+ unit buildings).
Forward outlook
- Local home prices are declining (-3.0%/yr); year-one equity from $366 of loan paydown is wiped out by about $2k of value loss. Plan a longer hold.
- Humphreys County population projected at -18% by 2050 — secular population decline; favor cash flow + early exit over multi-decade hold.
- At projected returns (-3.0% appreciation + 3.0% rent growth), your $15k cash investment doubles in ~3 years — after that, you're playing with house money.
Negotiation context
- Only 11 days on market — expect competitive offers; lowballing is unlikely to land.
Risks & watch-outs
- Watch-outs: flood insurance adds $66/mo.
- Climate carrying-cost: severe flood risk; extreme-heat days projected 7→20/yr by 2055 (HVAC capex compounding) — expect insurance premiums to compound above CPI over the hold.
Questions for the listing agent
- Built in 1965 — when were the roof, HVAC, electrical panel, plumbing, and water heater last replaced?
- What's the actual annual flood-insurance premium (NFIP or private), and is the property in a SFHA with mandatory coverage?
- Is there a deadline driving the sale (1031 exchange, divorce, estate, relocation)? That informs how much negotiation room exists.
- Schools are D-rated, which usually means shorter tenancies and higher turnover. Who's the typical renter profile here, and what's been the actual vacancy rate?
- What's the average days-on-market for RENTAL listings here right now (not sales)? A rising rental-DOM trend means longer vacancies and softer asking-rent achievability than the comps imply.
- What's the recent tenant-quality profile in this submarket — average credit score on applications, eviction rate, late-payment / NSF rate, and stable-employment percentage? A property-management company in the area should have these aggregated.
- How much new for-sale + rental construction is in the pipeline within 1–3 miles? Heavy new supply typically softens prices + rents 12–24 months out; constrained supply supports both.
Investment metrics
- 1% rule
- 2.33% ✓
- Cap rate
- 19.98%
- Cash-on-cash
- 48.88%
- DSCR
- 3.17
- GRM
- 3.6
CMA / ARV
- ARV (on-the-fly)
- $160,392
- Comps found
- 9
Show comp detail 9 sales within ~0.75 mi
| Address | Dist | Beds/Ba | Sqft | Sold | Price | $/sf | Match |
|---|---|---|---|---|---|---|---|
| 217 Lomax Ave | 0.13mi | 2/1.0 | 941 (-4%) | 11mo | $78,375 | $83 | 77 |
| 409 E Railroad St | 0.54mi | 3/1.0 (+1) | 1,000 (+2%) | 9mo | $109,000 | $109 | 60 |
| 206 Joe St | 0.60mi | 2/1.0 | 904 (-8%) | 1mo | $165,000 | $183 | 57 |
| 203 E Wyly St | 0.51mi | 2/1.0 | 1,080 (+10%) | 10mo | $164,000 | $152 | 51 |
| 204 1/2 Carroll Ave | 0.62mi | 2/1.0 | 1,044 (+6%) | 14mo | $170,000 | $163 | 50 |
| 2041/2 Carroll Ave | 0.62mi | 2/1.0 | 1,044 (+6%) | 14mo | $170,000 | $163 | 50 |
| 203 N Clydeton Rd N | 0.71mi | 3/2.0 (+1) | 1,080 (+10%) | 1mo | $179,000 | $166 | 41 |
| 117 Oak Ridge Dr | 0.68mi | 2/2.0 | 893 (-9%) | 15mo | $195,000 | $218 | 36 |
| 114 Joe St | 0.54mi | 3/1.0 (+1) | 1,107 (+12%) | 24mo | $175,000 | $158 | 29 |
Match score weights: distance 35% · size 25% · config 20% · recency 20%. Top-matched comps best support the ARV.
Projected returns pro-forma
-3.0% appreciation · 3.0% rent growth · sell at horizon
- IRR
- 40.4%
- Equity multiple
- 2.73×
- Total profit
- $25,683
- Equity at exit
- $7,888
- IRR
- 46.7%
- Equity multiple
- 5.50×
- Total profit
- $66,643
- Equity at exit
- $4,574
Cash invested: $14,812 (down + closing). Projections, not guarantees.
Landlord ↔ Tenant lean methodology
- Overall (STATE)
- 87 Strongly Landlord-Friendly
- State Tennessee
- 87 Strongly Landlord-Friendly · R+13
- County
- — inherits STATE
- City
- — inherits STATE
ZIP-level market 37185
- Home prices YoY
- -1.3%
- Active inventory
- 155
- Price-to-rent
- 3.6×
Monthly cashflow live
- Estimated rent
- $1,231 medium interval (Pro) →
- Mortgage (P&I)
- −$277
- Tax from tax record
- −$70 /mo · $834/yr
- Insurance
- −$22
- Flood insurance flood zone
- −$66 /mo · $798/yr
- HOA
- −$0
- Vacancy / Maint / Mgmt
- −$258
- Net cashflow
- $537
Break-even live
UW: 25.0% down · 7.5% · 30yr · 1.5% tax · 5.0% vac · 8.0% maint · 8.0% mgmt
Financing live
Cash to close
- Down payment
- $13,225
- Closing costs
- $1,587
- Reserves months
- —
- Total cash needed
- —
Loan-product check · same deal, 3 products live
Conventional
25% down · 7.5% · 30yr
- Down + closing
- —
- Monthly P&I
- —
- Monthly cashflow
- —
- DSCR
- —
- Eligible?
- —
Personal DTI + credit; lowest rate.
DSCR
20% down · 8.5% · 30yr
- Down + closing
- —
- Monthly P&I
- —
- Monthly cashflow
- —
- DSCR
- —
- Eligible?
- —
No personal income docs; deal must DSCR.
Hard money
10% down · 12.0% · 12mo
- Down + closing
- —
- Monthly P&I
- —
- Monthly cashflow
- —
- DSCR
- —
- Eligible?
- —
Short-term bridge; refi at stabilization.
Rent comps 2 comps
| Address | Beds | Baths | Sqft | Rent | $/sqft | DOM | Units | Dist |
|---|---|---|---|---|---|---|---|---|
| 122 Tank Hill Rd Unit B Waverly, TN | 2.0 | 2.5 | 1006 | $1,250 | $1.24 | 1d | 1 | 0.18mi |
| 311 E Commerce St Unit A Waverly, TN | 1.0 | 1.0 | 640 | $1,150 | $1.80 | 43d | 1 | 0.51mi |
Listing history 9 events
-
2026-06-16status $52,900 Pending 11 DOM
-
2026-06-15days on market $52,900 Active 11 DOM
-
2026-06-13days on market $52,900 Active 9 DOM
-
2026-06-13days on market $52,900 Active 8 DOM
-
2026-06-09days on market $52,900 Active 5 DOM
-
2026-06-08days on market $52,900 Active 4 DOM
-
2026-06-07statusdays on market $52,900 Active 3 DOM
-
2026-06-03remarks 405-char remark
-
2026-06-03$52,900 Coming Soon 1 DOM
ⓘ Source: listings_history table (triggers on properties + properties_extension) + one-shot
backfill from property_details.listing_events for pre-trigger history.
Tax reassessment forecast TN · Resets to sale price
- Current annual tax
- $834 · $70/mo
- Projected year-2 tax
- $834 · $70/mo
- Expected delta
- $0/yr ($0/mo · 0.0%)
ⓘ Screening estimate from a state-policy table — verify with the county assessor before closing.
Climate risk First Street
- Flood 9/10 Extreme FEMA zone X (unshaded) · 99% chance over 30 yrs
- Wildfire 4/10 Moderate
- Heat 5/10 Major 7 d/yr ≥107°F today · 20 d/yr by 30 yrs out
- Wind 4/10 Moderate 11% chance of damaging wind over 30 yrs
- Air quality 1/10 Low 0 unhealthy d/yr today · 0 by 30 yrs out
Nearby sold comps map
Loading sold comps map…
Walkable amenities ~0.75 mi
Loading nearby amenities…
Taxation est. · year 1
- Rental income
- $14,769
- − Mortgage interest
- −$2,963
- − Property taxes
- −$834
- − Insurance
- −$1,062
- − Repairs & maintenance
- −$1,182
- − Management
- −$1,182
- − Depreciation
- −$1,539
- Taxable income
- $6,008
- Est. tax owed @ 24.0%
- −$1,442
- After-tax cash flow
- $5,001/yr
For passive investors: Depreciation is non-cash, so a rental often shows a tax loss while cash-flowing — sheltering income. Rental losses are passive: they offset passive income freely, and up to $25,000/yr can offset ordinary (W-2) income if you actively participate and your MAGI is under $100k (phasing out to $0 by $150k); unused losses carry forward. On sale, claimed depreciation is recaptured at up to 25%, and gains may owe capital-gains tax (a 1031 exchange can defer both). Figures are a year-1 estimate at your 24.0% rate — not tax advice; consult a CPA.
Schools (NCES district)
- District
- Humphreys County
- NCES district ID
- 4701980
- Math proficiency
- 21% ▼ -14.00%
- Reading proficiency
- 24% ▼ -9.00%
- Median HH income
- $41,248
- Composite
- 19.14/100
- National rank
- #8829
- State rank
- #103 of 139 in TN
Livability — Waverly
- Score
- 62/100
- State rank
- #209
- US rank
- #16116
Category grades
Schools grade is shown separately in the Schools card above.
Census & demographics
- Census place
- Waverly, TN
- Population (ZIP)
- 9,120
Population outlook (Humphreys County) Hauer SSP2
- Today (2025)
- 17,256 people
- By 2030
- 16,654 · -3.5%
- By 2040
- 15,437 · -10.5%
- By 2050
- 14,238 · -17.5%
- By 2075
- 11,971 · -30.6%
- By 2100
- 10,575 · -38.7%
Race, ethnicity, and origin ACS 2023
- Neighborhood character
- Predominantly White (88%)
- Race & ethnicity
- White 88% Two or more races 5% Black 3% Hispanic / Latino 3%
- Common ancestry
- Slovak 4% Romanian 2% English 1%
- Foreign-born
- 3% · Canada
- Languages at home
- 98% English-only · Spanish 1% Tagalog/Filipino 1%
Political lean MEDSL · Humphreys
- 2024 margin
- Solid R (+56.1) · D 21.4% · R 77.4% · Other 1.2%
- 2008→2024 swing
- -53.2pp toward R · 2008: -2.9pp · 2024: -56.1pp
- All cycles
- 2024: R+56.1 2020: R+49.8 2016: R+41.5 2012: R+13.5 2008: R+2.9
Not yet ingested
- Civics
- —
Market trends
- HPI YoY
- ▼ -4.36%
- Current HPI
- 335.9664
- Rent YoY
- —
- Metro
- —
- State GDP YoY
- ▲ 2.78%
- F500 in state
- 22
Industry mix (Fortune 500 HQ in TN)
| Industry | F500 HQs | Revenue |
|---|---|---|
| Healthcare | 3 | $91B |
|
||
| Retail | 3 | $72B |
|
||
| Transportation / Logistics | 1 | $88B |
|
||
| Paper / Packaging | 1 | $19B |
|
||
| Insurance | 1 | $13B |
|
||
| Energy | 1 | $12B |
|
||
Price history
1 event — show timeline
- 2026-06-02 Coming Soon $52,900 REALTRACS as Distributed by MLS Grid
Property tax history
+8.8%/yrLatest (2025): $834 · -0.4% YoY. Source: county tax records.
Cash-flow waterfall
monthlySold comps — $/sqft
last 12 mo · ≤1 miLoading sold comps…