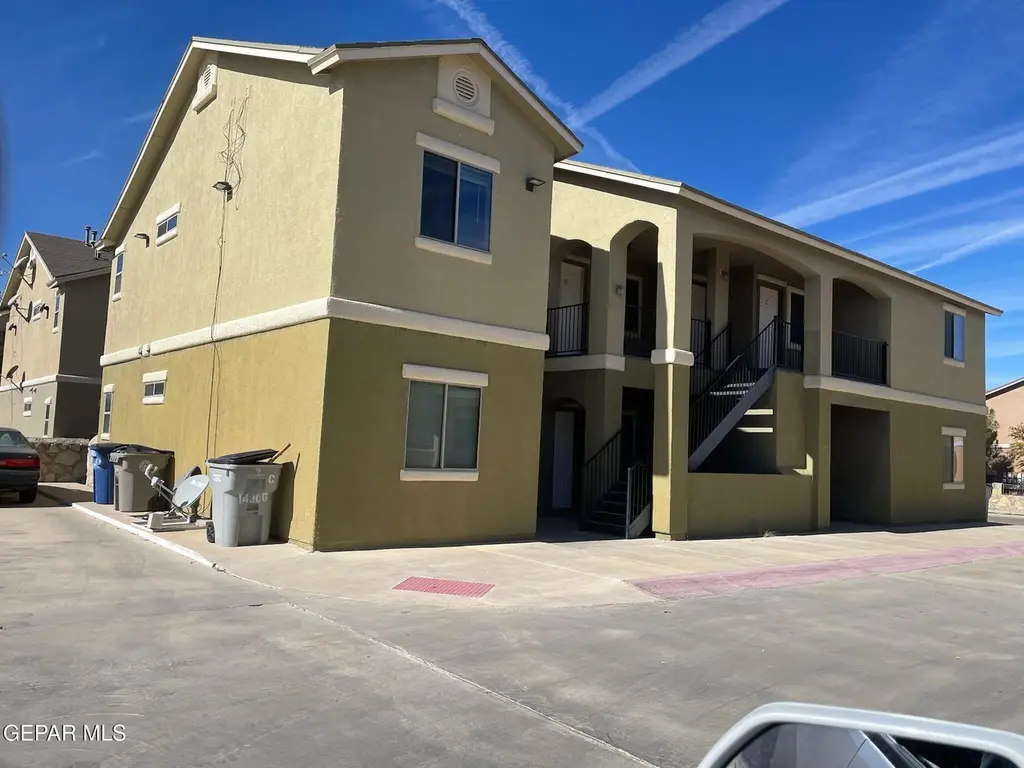
 Fourplex
14306 Gil Reyes Dr Unit D · El Paso, TX
Flood risk 1/10 · Minimal
- FEMA flood zone
- X
- Chance of flooding over 30 yrs
- 0.0%
- Est. flood insurance / yr
- $507 – $1,088
Fire risk 3/10 · Minor
- Est. fire insurance / yr
- $1,222 – $2,270
Heat risk 6/10 · Moderate
- Hot days now (above 101°F)
- 7 days/yr
- Hot days in 30 yrs
- 22 days/yr
Wind risk 1/10 · Minimal
- Chance of severe wind over 30 yrs
- —
Air-quality risk 3/10 · Minor
- Unhealthy air days now
- 2 days/yr
- Unhealthy air days in 30 yrs
- 3 days/yr
Risk factors via First Street. Map © Google.
Why this score? — see what drove the D grade
The composite is a weighted blend of 9 inputs, each scored 0–100. Each bar is that input's sub-score; the figure is the points it added to the 100-point composite (weight × sub-score).
- Cash flow +15.0/30.0
- ARV discount +7.5/15.0
- 1% rule +5.0/10.0
- DSCR +5.0/10.0
- Livability +4.0/5.0
- Rent growth +3.0/5.0
- Schools +2.6/10.0
- Condition / age +2.5/5.0
- Appreciation +0.0/10.0
$1,100
🖨 Deal sheet (PDF) 📄 Offer letter ✓ Due diligence
Multi-family units
County records classify this as Multi-Family (5+ Unit). Listing-text estimate: 4 units. estimate disagrees with records
5+ unit building — per-unit beds/baths from public records are typically unavailable; the breakdown below (if shown) is an estimate from the listing text.
Listing remarks
SPACIOUS 2 BEDROOM 2 BATH QUADRUPLEX ON EAST SIDE. QUIET NEIGHBORHOOD, CUL DE SAC STREET. TEN MINUTES FROM BASE. CLOSE TO PARKS, SCHOOLS AND SHOPPING. .
Key facts
- Close to parks
- Close to schools
- Cul de sac street
Tags
Property features AI
Exterior
- Parking: 2+ spaces per unit
- Utilities: All city utilities
- Home design: Quadruplex
- Construction: Stucco construction; Composition roof
- Exterior features: Stucco exterior; Composition roof; Lot about 0.05 acres
Interior
- Kitchen: Refrigerator; Range hood; Disposal; Dishwasher
- Flooring: Ceramic tile
- Heating & cooling: Central heating; Refrigerated cooling
- Interior features: Ceramic tile flooring
Neighborhood map
What this means for you Summary
Snapshot
- This is a 4 × 2-bed/2-bath units multifamily listed at $1k.
Deal economics
- At list price, monthly cash flow is $4k ($47k/yr) — positive. Per door: $982/mo.
- The deal already cash-flows at list — no discount required.
- Meets the 1% rule at list price ($5k rent vs $1k).
- Recommended offer: $1k (1.5% below list) — sets the bar for market timing.
Location & tenants
- Location reads 81/100 on livability (#23 in TX, #1,375 nationally) — a professional / high-income tenant draw. Strengths: commute A+, cost of living A+, housing A+; Watch: employment D+.
- Socorro ISD (urban): math 23% / reading 36% proficiency, ranked #624 of 826 in TX (top 76%) — low school quality limits family demand, transient renter base, plan for 1-2y turnover; 66% free/reduced lunch — lower-income household profile, screen leases tightly.
- Zoned schools: Chester E Jordan (math 17% / reading 22%, grade F, #3,583 of 4,322 statewide, top 86%, 813 students, 81% FRL); Sun Ridge Middle (math 32% / reading 41%, grade F, #786 of 1,662 statewide, top 48%, 1,045 students, 67% FRL); Pebble Hills H S (math 21% / reading 47%, grade F, #1,002 of 1,632 statewide, top 62%, 2,888 students, 63% FRL) — zoned schools at 70% FRL track the district average.
- Market conditions: Rents rising (+2.1%/yr); 1196 active listings in the ZIP; solid renter incomes; 2,196 units permitted in El Paso County in 2024 (143 in 5+ unit buildings).
- At $4,981/mo this rent would consume 77% of the median local household income ($77k/yr) (locally 900% of renters already pay >50% of income on rent) — very limited rent-growth headroom before tenants either downsize or default.
Forward outlook
- Local home prices are declining (-3.0%/yr); year-one equity from $8 of loan paydown is wiped out by about $33 of value loss. Plan a longer hold.
- El Paso County population projected at +10% by 2050 — modest demand growth; plan on rents tracking national, not racing it.
- At projected returns (-3.0% appreciation + 2.1% rent growth), your $308 cash investment doubles in ~1 year — after that, you're playing with house money.
Negotiation context
- It's been on market 20 days — a 2% lower offer ($1k) is reasonable based on typical stale-listing flexibility.
Risks & watch-outs
- Climate carrying-cost: extreme-heat days projected 7→22/yr by 2055 (HVAC capex compounding) — expect insurance premiums to compound above CPI over the hold.
Questions for the listing agent
- Can we see the unit-by-unit rent roll, current vacancy, and any below-market leases? What's the average tenancy length?
- What capital expenditures (roof, boiler, parking lot, exteriors) have been made in the last 5 years, and what's planned in the next 2?
- Is there a deadline driving the sale (1031 exchange, divorce, estate, relocation)? That informs how much negotiation room exists.
- Schools are B-rated — typically a magnet for longer-tenancy family renters. What's the average tenant stay here, and is there a school-zone premium baked into asking?
- The area grade is low — what's the realistic commute time and amenity access for the typical tenant pool here? Any planned neighborhood developments (good or bad) we should know about?
- What's the average days-on-market for RENTAL listings here right now (not sales)? A rising rental-DOM trend means longer vacancies and softer asking-rent achievability than the comps imply.
- What's the recent tenant-quality profile in this submarket — average credit score on applications, eviction rate, late-payment / NSF rate, and stable-employment percentage? A property-management company in the area should have these aggregated.
- How much new apartment / multifamily construction is in the pipeline within 1–3 miles? Heavy new supply (>2% of stock underway) typically softens rents 12–24 months out; light construction supports rent growth.
Investment metrics
- 1% rule
- 452.82% ✓
- Cap rate
- 4290.72%
- Cash-on-cash
- 15301.51%
- DSCR
- 681.83
- GRM
- 0.0
CMA / ARV
No comps found within radius.
Projected returns pro-forma
-3.0% appreciation · 2.06% rent growth · sell at horizon
- IRR
- —
- Equity multiple
- 797.65×
- Total profit
- $245,367
- Equity at exit
- $164
- IRR
- —
- Equity multiple
- 1680.43×
- Total profit
- $517,265
- Equity at exit
- $95
Cash invested: $308 (down + closing). Projections, not guarantees.
Landlord ↔ Tenant lean methodology
- Overall (STATE)
- 87 Strongly Landlord-Friendly
- State Texas
- 87 Strongly Landlord-Friendly · R+5
- County
- — inherits STATE
- City
- — inherits STATE
ZIP-level market 79938
- Home prices YoY
- -8.6%
- Rents YoY
- 2.1%
- Active inventory
- 1196
- Price-to-rent
- 0.1×
Monthly cashflow live
- Estimated rent
- $4,981 high interval (Pro) →
- Mortgage (P&I)
- −$6
- Tax est. 1.5%
- −$1 /mo · $16/yr
- Insurance
- −$0
- HOA
- −$0
- Vacancy / Maint / Mgmt
- −$1,046
- Net cashflow
- $3,927
Break-even live
Sensitivity live
| Price | -10% $3,928 | -5% $3,928 | +0% $3,927 | +5% $3,927 | +10% $3,927 |
|---|---|---|---|---|---|
| Rent | -10% $3,534 | -5% $3,731 | +0% $3,927 | +5% $4,124 | +10% $4,321 |
| Rate | -1.0pp $3,928 | -0.5pp $3,928 | base $3,927 | +0.5pp $3,927 | +1.0pp $3,927 |
4-unit breakdown (identical units grouped — click to expand)
| Units | Beds | Baths | Est. rent |
|---|---|---|---|
| 4× units | 2 | 2 | $4,980 |
| #1 | 2 | 2 | $1,245 |
| #2 | 2 | 2 | $1,245 |
| #3 | 2 | 2 | $1,245 |
| #4 | 2 | 2 | $1,245 |
| Total (4 units) | $4,981 | ||
UW: 25.0% down · 7.5% · 30yr · 1.5% tax · 5.0% vac · 8.0% maint · 8.0% mgmt
Financing live
Cash to close
- Down payment
- $275
- Closing costs
- $33
- Reserves months
- —
- Total cash needed
- —
Loan-product check · same deal, 3 products live
Conventional
25% down · 7.5% · 30yr
- Down + closing
- —
- Monthly P&I
- —
- Monthly cashflow
- —
- DSCR
- —
- Eligible?
- —
Personal DTI + credit; lowest rate.
DSCR
20% down · 8.5% · 30yr
- Down + closing
- —
- Monthly P&I
- —
- Monthly cashflow
- —
- DSCR
- —
- Eligible?
- —
No personal income docs; deal must DSCR.
Hard money
10% down · 12.0% · 12mo
- Down + closing
- —
- Monthly P&I
- —
- Monthly cashflow
- —
- DSCR
- —
- Eligible?
- —
Short-term bridge; refi at stabilization.
Listing history 10 events
-
2026-06-10days on market $1,100 Active 20 DOM
-
2026-06-09days on market $1,100 Active 19 DOM
-
2026-06-08days on market $1,100 Active 18 DOM
-
2026-06-07days on market $1,100 Active 17 DOM
-
2026-06-05days on market $1,100 Active 14 DOM
-
2026-06-03days on market $1,100 Active 13 DOM
-
2026-06-03days on market $1,100 Active 12 DOM
-
2026-06-01days on market $1,100 Active 11 DOM
-
2026-05-31days on market $1,100 Active 10 DOM
-
2026-04-14$1,100 Active
ⓘ Source: listings_history table (triggers on properties + properties_extension) + one-shot
backfill from property_details.listing_events for pre-trigger history.
Climate risk First Street
- Flood 1/10 Low FEMA zone X · 0% chance over 30 yrs
- Wildfire 3/10 Moderate
- Heat 6/10 Major 7 d/yr ≥101°F today · 22 d/yr by 30 yrs out
- Wind 1/10 Low
- Air quality 3/10 Moderate 2 unhealthy d/yr today · 3 by 30 yrs out
Nearby sold comps map
Loading sold comps map…
Walkable amenities ~0.75 mi
Loading nearby amenities…
Taxation est. · year 1
- Rental income
- $59,772
- − Mortgage interest
- −$62
- − Property taxes
- −$16
- − Insurance
- −$6
- − Repairs & maintenance
- −$4,782
- − Management
- −$4,782
- − Depreciation
- −$32
- Taxable income
- $50,093
- Est. tax owed @ 24.0%
- −$12,022
- After-tax cash flow
- $35,106/yr
For passive investors: Depreciation is non-cash, so a rental often shows a tax loss while cash-flowing — sheltering income. Rental losses are passive: they offset passive income freely, and up to $25,000/yr can offset ordinary (W-2) income if you actively participate and your MAGI is under $100k (phasing out to $0 by $150k); unused losses carry forward. On sale, claimed depreciation is recaptured at up to 25%, and gains may owe capital-gains tax (a 1031 exchange can defer both). Figures are a year-1 estimate at your 24.0% rate — not tax advice; consult a CPA.
Schools (NCES district)
- District
- Socorro ISD
- NCES district ID
- 4840710
- Math proficiency
- 23% ▼ -34.00%
- Reading proficiency
- 36% ▼ -14.00%
- Median HH income
- $49,318
- Composite
- 25.67/100
- National rank
- #7396
- State rank
- #624 of 826 in TX
Livability — El Paso
- Score
- 81/100
- State rank
- #23
- US rank
- #1375
Category grades
Schools grade is shown separately in the Schools card above.
Census & demographics
- Census place
- El Paso, TX
- County
- El Paso County · 761,266 people
- City population
- 630,223
- Metro
- El Paso, TX
- Population (ZIP)
- 99,621
- Household income
- $77,272
- Rent vs Own
- Severe rent burden
- 900.0
Population outlook (El Paso County) Hauer SSP2
- Today (2025)
- 897,899 people
- By 2030
- 922,694 · +2.8%
- By 2040
- 960,492 · +7.0%
- By 2050
- 982,919 · +9.5%
- By 2075
- 997,266 · +11.1%
- By 2100
- 900,630 · +0.3%
Race, ethnicity, and origin ACS 2023
- Neighborhood character
- Predominantly Hispanic (83%)
- Race & ethnicity
- Hispanic / Latino 83% Two or more races 42% White 10% Black 4%
- Hispanic origin (detail)
- Mexican 76% Puerto Rican 1%
- Common ancestry
- Italian 1% Lithuanian 1%
- Foreign-born
- 20% · Canada, Guatemala
- Languages at home
- 36% English-only · Spanish 62%
Political lean MEDSL · El Paso
- 2024 margin
- D (+15.1) · D 57.0% · R 41.8% · Other 1.2%
- 2008→2024 swing
- -17.4pp toward R · 2008: 32.5pp · 2024: 15.1pp
- All cycles
- 2024: D+15.1 2020: D+35.1 2016: D+43.2 2012: D+32.6 2008: D+32.5
Not yet ingested
- Civics
- —
Market trends
- HPI YoY
- ▼ -19.39%
- Current HPI
- 207.2031
- Rent YoY
- ▲ 2.06%
- Metro
- El Paso, TX
- State GDP YoY
- ▲ 3.95%
- F500 in state
- 110
Industry mix (Fortune 500 HQ in TX)
| Industry | F500 HQs | Revenue |
|---|---|---|
| Energy | 16 | $1,198B |
|
||
| Technology | 5 | $198B |
|
||
| Engineering / Construction | 4 | $72B |
|
||
| Energy Services | 3 | $60B |
|
||
| Utilities | 3 | $41B |
|
||
| Healthcare | 2 | $330B |
|
||
Price history
1 event — show timeline
- 2026-04-14 Listed $1,100 GEPARMLS
Cash-flow waterfall
monthlySold comps — $/sqft
last 12 mo · ≤1 miLoading sold comps…