 Duplex
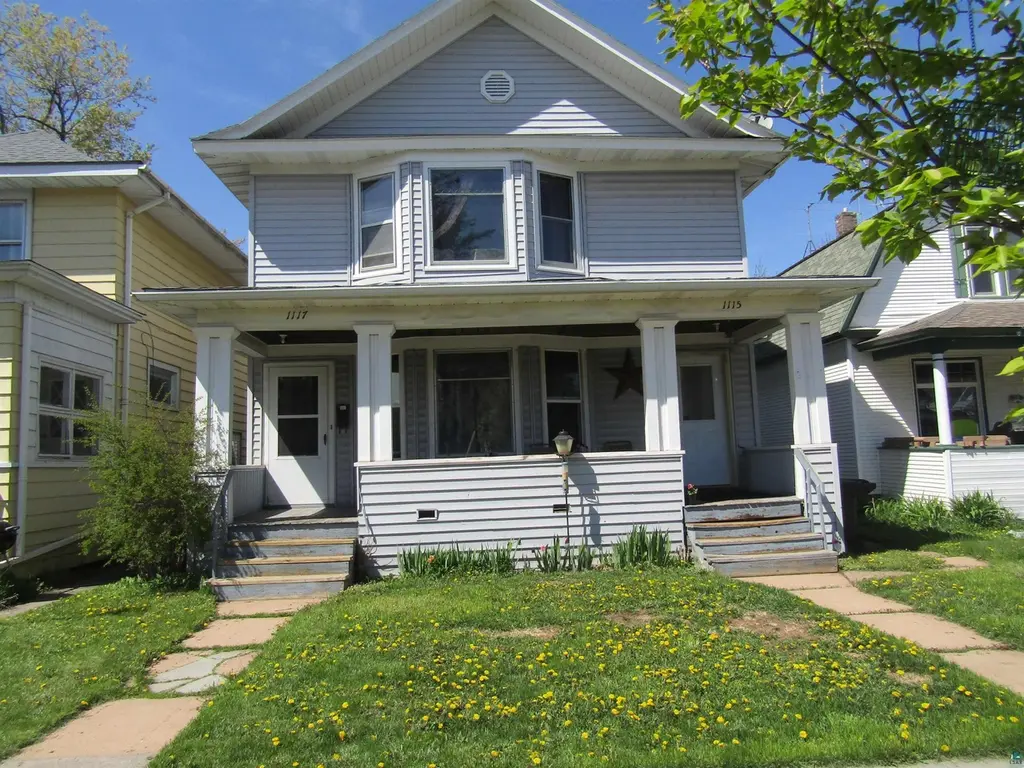
1115 Harrison St Unit 1117 Harrison Street · Superior, WI
Flood risk 1/10 · Minimal
- FEMA flood zone
- X (unshaded)
- Chance of flooding over 30 yrs
- 0.0%
- Est. flood insurance / yr
- $473 – $860
Fire risk 3/10 · Minor
- Est. fire insurance / yr
- $636 – $1,182
Heat risk 2/10 · Minimal
- Hot days now (above 92°F)
- 7 days/yr
- Hot days in 30 yrs
- 13 days/yr
Wind risk 1/10 · Minimal
- Chance of severe wind over 30 yrs
- —
Air-quality risk 2/10 · Minimal
- Unhealthy air days now
- 1 days/yr
- Unhealthy air days in 30 yrs
- 1 days/yr
Risk factors via First Street. Map © Google.
Why this score? — see what drove the B- grade
The composite is a weighted blend of 9 inputs, each scored 0–100. Each bar is that input's sub-score; the figure is the points it added to the 100-point composite (weight × sub-score).
- Cash flow +30.0/30.0
- 1% rule +10.0/10.0
- DSCR +10.0/10.0
- ARV discount +7.5/15.0
- Livability +4.3/5.0
- Rent growth +3.2/5.0
- Schools +2.4/10.0
- Condition / age +2.2/5.0
- Appreciation +0.0/10.0
$239,900
🖨 Deal sheet 📄 Offer letter ✓ Due diligence
Multi-family units
County records classify this as Multi-Family (2-4 Unit). Listing-text estimate: 2 units. confirmed
Listing remarks
Great opportunity with this turn of the century duplex near UWS! Spacious units, natural woodwork, hardwood floors, formal dining rooms with a built-in hutch in both, in unit laundry and both units have access to basement space.
Key facts
- Natural woodwork
- Formal dining rooms
- In unit laundry
Tags
Property features AI
Exterior
- Parking: No dedicated parking
- Utilities: Public water; Public sewer; Cable available
- Home design: Duplex residential income property; 2-story
- Construction: Asphalt shingle roof
- Exterior features: Level lot; City street frontage; Satellite dish
Interior
- Heating & cooling: Natural gas heating
- Interior features: High speed internet; Full unfinished basement with storage space; In-unit laundry
- Laundry & utility: In-unit laundry
Neighborhood map
What this means for you Summary
Snapshot
- This is a 2 × 2-bed/1.0-bath units multifamily listed at $240k. Condition is rated fair.
Deal economics
- At list price, monthly cash flow is $1k ($15k/yr) — positive. Per door: $620/mo.
- The deal already cash-flows at list — no discount required.
- Meets the 1% rule at list price ($4k rent vs $240k).
- Recommended offer: $236k (1.5% below list) — sets the bar for market timing.
- Cap rate 12.5% vs local median 4.6% in Superior — top-decile yield for the area; either an underpriced asset or a hidden risk that comps aren't pricing in. Stress-test before assuming the spread holds.
Location & tenants
- Location reads 86/100 on livability (#21 in WI, #337 nationally) — a professional / high-income tenant draw. Strengths: amenities A+, commute A+, cost of living A+; Watch: schools C-.
- Superior School District (suburban): math 23% / reading 34% proficiency, ranked #290 of 342 in WI (top 85%) — low school quality limits family demand, transient renter base, plan for 1-2y turnover.
- Market conditions: Rents rising (+2.8%/yr); 168 active listings in the ZIP; 110 units permitted in Douglas County in 2024 (0 in 5+ unit buildings).
- At $3,669/mo this rent would consume 64% of the median local household income ($68k/yr) (locally 1018% of renters already pay >50% of income on rent) — very limited rent-growth headroom before tenants either downsize or default.
Forward outlook
- Local home prices are declining (-3.0%/yr); year-one equity from $2k of loan paydown is wiped out by about $7k of value loss. Plan a longer hold.
- Douglas County population projected at -20% by 2050 — secular population decline; favor cash flow + early exit over multi-decade hold.
- At projected returns (-3.0% appreciation + 2.8% rent growth), your $67k cash investment doubles in ~6 years — after that, you're playing with house money.
Negotiation context
- It's been on market 16 days — a 2% lower offer ($236k) is reasonable based on typical stale-listing flexibility.
Risks & watch-outs
- Watch-outs: built in 1911 — expect roof / HVAC / electrical / plumbing capex.
Questions for the listing agent
- Can we see the unit-by-unit rent roll, current vacancy, and any below-market leases? What's the average tenancy length?
- What capital expenditures (roof, boiler, parking lot, exteriors) have been made in the last 5 years, and what's planned in the next 2?
- Have any recent inspections been done? Can we get a copy of the seller's disclosures and any deferred-maintenance estimates?
- Built in 1911 — when were the roof, HVAC, electrical panel, plumbing, and water heater last replaced?
- Is there a deadline driving the sale (1031 exchange, divorce, estate, relocation)? That informs how much negotiation room exists.
- What's the average days-on-market for RENTAL listings here right now (not sales)? A rising rental-DOM trend means longer vacancies and softer asking-rent achievability than the comps imply.
- What's the recent tenant-quality profile in this submarket — average credit score on applications, eviction rate, late-payment / NSF rate, and stable-employment percentage? A property-management company in the area should have these aggregated.
- How much new apartment / multifamily construction is in the pipeline within 1–3 miles? Heavy new supply (>2% of stock underway) typically softens rents 12–24 months out; light construction supports rent growth.
Investment metrics
- 1% rule
- 1.53% ✓
- Cap rate
- 12.50%
- Cash-on-cash
- 22.16%
- DSCR
- 1.99
- GRM
- 5.4
CMA / ARV
No comps found within radius.
Projected returns pro-forma
-3.0% appreciation · 2.76% rent growth · sell at horizon
- IRR
- 14.7%
- Equity multiple
- 1.59×
- Total profit
- $39,313
- Equity at exit
- $35,770
- IRR
- 23.2%
- Equity multiple
- 2.97×
- Total profit
- $132,593
- Equity at exit
- $20,742
Cash invested: $67,172 (down + closing). Projections, not guarantees.
Landlord ↔ Tenant lean methodology
- Overall (STATE)
- 73 Landlord-Friendly
- State Wisconsin
- 73 Landlord-Friendly · R+2
- County
- — inherits STATE
- City
- — inherits STATE
ZIP-level market 54880
- Rents YoY
- 2.8%
- Active inventory
- 168
- Price-to-rent
- 10.9×
Monthly cashflow live
- Estimated rent
- $3,669 medium interval (Pro) →
- Mortgage (P&I)
- −$1,258
- Tax est. 1.5%
- −$300 /mo · $3,598/yr
- Insurance
- −$100
- HOA
- −$0
- Vacancy / Maint / Mgmt
- −$770
- Net cashflow
- $1,241
Break-even live
2-unit breakdown (identical units grouped — click to expand)
| Units | Beds | Baths | Est. rent |
|---|---|---|---|
| 2× units | 2 | 1 | $3,668 |
| #1 | 2 | 1 | $1,834 |
| #2 | 2 | 1 | $1,834 |
| Total (2 units) | $3,669 | ||
UW: 25.0% down · 7.5% · 30yr · 1.5% tax · 5.0% vac · 8.0% maint · 8.0% mgmt
Financing live
Cash to close
- Down payment
- $59,975
- Closing costs
- $7,197
- Reserves months
- —
- Total cash needed
- —
Loan-product check · same deal, 3 products live
Conventional
25% down · 7.5% · 30yr
- Down + closing
- —
- Monthly P&I
- —
- Monthly cashflow
- —
- DSCR
- —
- Eligible?
- —
Personal DTI + credit; lowest rate.
DSCR
20% down · 8.5% · 30yr
- Down + closing
- —
- Monthly P&I
- —
- Monthly cashflow
- —
- DSCR
- —
- Eligible?
- —
No personal income docs; deal must DSCR.
Hard money
10% down · 12.0% · 12mo
- Down + closing
- —
- Monthly P&I
- —
- Monthly cashflow
- —
- DSCR
- —
- Eligible?
- —
Short-term bridge; refi at stabilization.
Listing history 12 events
-
2026-06-18days on market $239,900 Active 16 DOM
-
2026-06-17days on market $239,900 Active 15 DOM
-
2026-06-16days on market $239,900 Active 14 DOM
-
2026-06-15days on market $239,900 Active 13 DOM
-
2026-06-14days on market $239,900 Active 11 DOM
-
2026-06-13days on market $239,900 Active 10 DOM
-
2026-06-10days on market $239,900 Active 8 DOM
-
2026-06-09days on market $239,900 Active 7 DOM
-
2026-06-08days on market $239,900 Active 6 DOM
-
2026-06-07days on market $239,900 Active 5 DOM
-
2026-06-03remarks 228-char remark
-
2026-06-03$239,900 Active 1 DOM
ⓘ Source: listings_history table (triggers on properties + properties_extension) + one-shot
backfill from property_details.listing_events for pre-trigger history.
Climate risk First Street
- Flood 1/10 Low FEMA zone X (unshaded) · 0% chance over 30 yrs
- Wildfire 3/10 Moderate
- Heat 2/10 Low 7 d/yr ≥92°F today · 13 d/yr by 30 yrs out
- Wind 1/10 Low
- Air quality 2/10 Low 1 unhealthy d/yr today · 1 by 30 yrs out
Nearby sold comps map
Loading sold comps map…
Walkable amenities ~0.75 mi
Loading nearby amenities…
Taxation est. · year 1
- Rental income
- $44,028
- − Mortgage interest
- −$13,438
- − Property taxes
- −$3,598
- − Insurance
- −$1,200
- − Repairs & maintenance
- −$3,522
- − Management
- −$3,522
- − Depreciation
- −$6,979
- Taxable income
- $11,768
- Est. tax owed @ 24.0%
- −$2,824
- After-tax cash flow
- $12,063/yr
For passive investors: Depreciation is non-cash, so a rental often shows a tax loss while cash-flowing — sheltering income. Rental losses are passive: they offset passive income freely, and up to $25,000/yr can offset ordinary (W-2) income if you actively participate and your MAGI is under $100k (phasing out to $0 by $150k); unused losses carry forward. On sale, claimed depreciation is recaptured at up to 25%, and gains may owe capital-gains tax (a 1031 exchange can defer both). Figures are a year-1 estimate at your 24.0% rate — not tax advice; consult a CPA.
Condition & rehab AI · 12 photos
This property requires moderate renovations to improve its condition and increase its value. Key areas for improvement include the kitchen, bathrooms, HVAC, and windows.
Repairs flagged
- Major kitchen cabinets — dated and in poor condition
- Major bathroom fixtures — old and in poor condition
- Major HVAC appliances — old and likely inefficient
Value-add opportunities
- Both paint interior walls — improves appearance and value
- Both replace old windows — increases natural light and energy efficiency
- Both update kitchen appliances — modernizes the space and increases value
- Both update bathroom fixtures — modernizes the space and increases value
- Both replace HVAC appliances — increases comfort and energy efficiency
Renovation cost estimate screening
| Repair item | Severity | Est. cost |
|---|---|---|
| kitchen cabinets · dated and in poor condition | Major | $15,000–50,000 |
| bathroom fixtures · old and in poor condition | Major | $15,000–50,000 |
| HVAC appliances · old and likely inefficient | Major | $15,000–50,000 |
| Total estimated repair cost · 3 items | $45,000–150,000 |
Value-add ROI direction
- Both paint interior walls — improves appearance and value ↑
- Both replace old windows — increases natural light and energy efficiency ↑
- Both update kitchen appliances — modernizes the space and increases value ↑
- Both update bathroom fixtures — modernizes the space and increases value ↑
- Both replace HVAC appliances — increases comfort and energy efficiency ↑
ⓘ Cost ranges are severity-bucket heuristics (US national rule-of-thumb). Get contractor quotes + a written scope before underwriting a rehab budget.
Schools (NCES district)
- District
- Superior School District
- NCES district ID
- 5514670
- Math proficiency
- 23% ▼ -12.00%
- Reading proficiency
- 34% ▼ -4.00%
- Median HH income
- $43,659
- Composite
- 24.31/100
- National rank
- #7711
- State rank
- #290 of 342 in WI
Livability — Superior
- Score
- 86/100
- State rank
- #21
- US rank
- #337
Category grades
Schools grade is shown separately in the Schools card above.
Census & demographics
- Census place
- Superior, WI
- County
- Douglas County · 30,312 people
- City population
- 30,312
- Metro
- Duluth, MN-WI
- Population (ZIP)
- 30,312
- Household income
- $68,275
- Rent vs Own
- Severe rent burden
- 1018.0
Population outlook (Douglas County) Hauer SSP2
- Today (2025)
- 42,505 people
- By 2030
- 41,269 · -2.9%
- By 2040
- 37,829 · -11.0%
- By 2050
- 34,043 · -19.9%
- By 2075
- 25,892 · -39.1%
- By 2100
- 19,487 · -54.2%
Race, ethnicity, and origin ACS 2023
- Neighborhood character
- Predominantly White (90%)
- Race & ethnicity
- White 90% Two or more races 5% Hispanic / Latino 2% Black 1% Asian 1% Native American 1%
- Common ancestry
- Portuguese 10% Romanian 9% Lithuanian 4%
- Foreign-born
- 2% · China, Vietnam
- Languages at home
- 97% English-only · Spanish 1%
Political lean MEDSL · Douglas
- 2024 margin
- Lean D (+5.3) · D 52.0% · R 46.6% · Other 1.4%
- 2008→2024 swing
- -27.9pp toward R · 2008: 33.2pp · 2024: 5.3pp
- All cycles
- 2024: D+5.3 2020: D+9.3 2016: D+7.6 2012: D+31.3 2008: D+33.2
Not yet ingested
- Civics
- —
Market trends
- HPI YoY
- ▼ -167.80%
- Current HPI
- 226.557
- Rent YoY
- ▲ 2.76%
- Metro
- Duluth, MN-WI
- State GDP YoY
- ▲ 2.10%
- F500 in state
- 20
Industry mix (Fortune 500 HQ in WI)
| Industry | F500 HQs | Revenue |
|---|---|---|
| Industrial Machinery | 4 | $23B |
|
||
| Industrial Technology | 2 | $36B |
|
||
| Insurance | 1 | $36B |
|
||
| Professional Services | 1 | $19B |
|
||
| Utilities | 1 | $9B |
|
||
| Consumer Goods | 1 | $3B |
|
||
Price history
1 event — show timeline
- 2026-06-02 Listed $239,900 LSAR
Cash-flow waterfall
monthlySold comps — $/sqft
last 12 mo · ≤1 miLoading sold comps…