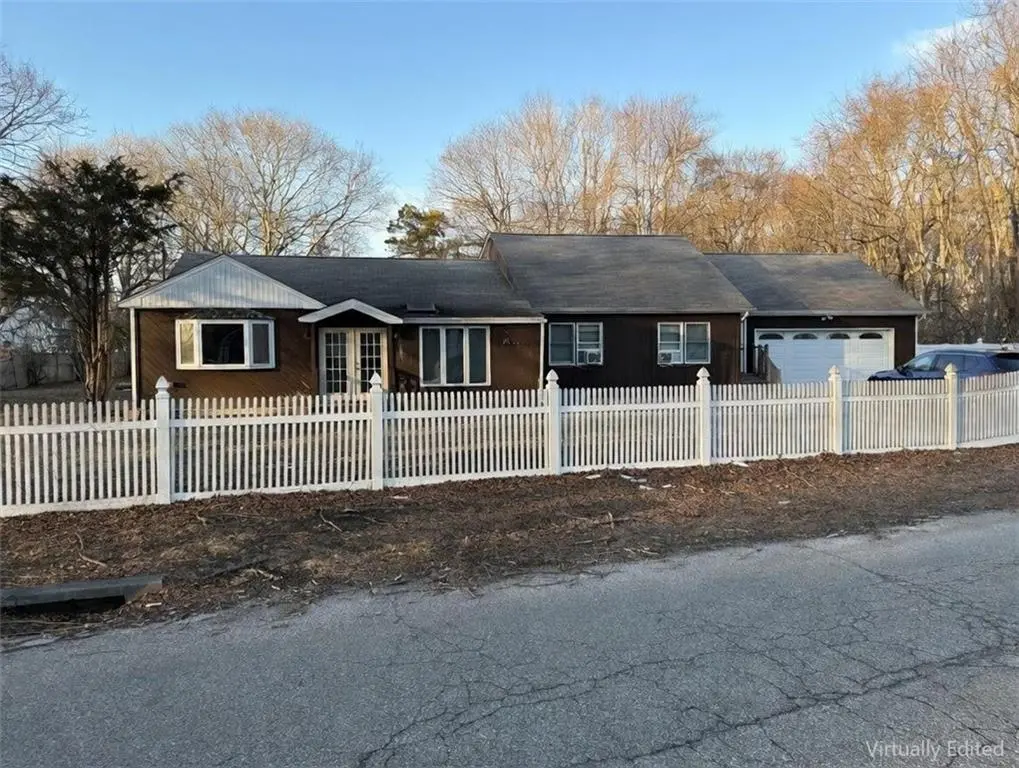
39 Pineway Ave · Mastic Beach, NY
Flood risk 4/10 · Minor
- FEMA flood zone
- X (unshaded)
- Chance of flooding over 30 yrs
- 0.2%
- Est. flood insurance / yr
- $473 – $860
Fire risk 1/10 · Minimal
- Est. fire insurance / yr
- $691 – $1,283
Heat risk 4/10 · Minor
- Hot days now (above 91°F)
- 7 days/yr
- Hot days in 30 yrs
- 19 days/yr
Wind risk 8/10 · Major
- Chance of severe wind over 30 yrs
- 80.0%
Air-quality risk 4/10 · Minor
- Unhealthy air days now
- 3 days/yr
- Unhealthy air days in 30 yrs
- 5 days/yr
Risk factors via First Street. Map © Google.
Why this score? — see what drove the D grade
The composite is a weighted blend of 9 inputs, each scored 0–100. Each bar is that input's sub-score; the figure is the points it added to the 100-point composite (weight × sub-score).
- ARV discount +10.8/15.0
- Appreciation +10.0/10.0
- Cash flow +6.3/30.0
- Schools +4.7/10.0
- Livability +3.1/5.0
- Rent growth +2.5/5.0
- Condition / age +2.5/5.0
- 1% rule +1.4/10.0
- DSCR +0.6/10.0
$595,000
🖨 Deal sheet 📄 Offer letter ✓ Due diligence
Listing remarks MLS
Nestled in the quaint and serene community of Mastic Beach, this expansive single-family residence offers exceptional space, versatility, and potential on a generous .89-acre parcel. The main level features five well-proportioned bedrooms, two full bathrooms, a comfortable living room, and a separate family room, providing ample room for both everyday living and entertaining. The lower level offers a fully functional basement with extra space and a full bathroom, complemented by a separate entrance, ideal for home office or flexible space. An unfinished attic with its own private entrance presents a unique opportunity for customization and future expansion. Completing this impressive offering is a two-car garage and abundant outdoor space, making this property a rare find with endless possibilities.
Key facts
- 0.89 acre lot
- Garage
- Built 1946
Neighborhood map
What this means for you Summary
Snapshot
- This is a 5-bed/2.0-bath single-family listed at $595k.
Deal economics
- At list price, monthly cash flow is $-1k ($-13k/yr) — negative.
- To cash-flow at today's rent, offer at most $407k (31.7% below list).
- To meet the 1% rule (rent ≥ 1% of price), the offer needs to be $380k (36.1% below list).
- Recommended offer: $380k (36.1% below list) — sets the bar for 1% rule.
Location & tenants
- Location reads 61/100 on livability (#936 in NY) — a middle-class / working-renter tenant base. Strengths: employment A+, housing A+; Watch: schools D, crime D, amenities F.
- William Floyd Union Free School District (suburban): math 48% / reading 57% proficiency, ranked #309 of 590 in NY (top 52%) — acceptable for families but not a draw, mixed tenant base, ~2y average lease.
- Market conditions: 133 active listings in the ZIP; 1 comparable units currently listed for rent nearby; 1,366 units permitted in Suffolk County in 2024 (216 in 5+ unit buildings).
Forward outlook
- In year one you build about $64k of equity ($4k loan paydown + $60k appreciation (10.0% local appreciation)).
- Suffolk County population projected to shrink 5% by 2050 — rents likely to lag national; underwrite the cash flow, not the appreciation.
- By year 2, paydown + projected appreciation supports a ~$102k cash-out refi (75% LTV) — recoverable capital for the next deal without selling this one.
Negotiation context
- It's been on market 84 days — a 6% lower offer ($559k) is reasonable based on typical stale-listing flexibility.
- 3 sale attempts since 12y ago with the ask held roughly flat each time — persistent listings suggest the price (not the market) is what's stuck; bring a comps-based counter.
- Current owner paid $175k; list at $595k implies a 240% gain — meaningful room to come down on a strong offer.
Risks & watch-outs
- Watch-outs: built in 1946 — expect roof / HVAC / electrical / plumbing capex.
- Climate carrying-cost: severe wind risk, 80% chance of damaging wind over 30y — expect insurance premiums to compound above CPI over the hold.
Questions for the listing agent
- What do current leases actually rent for vs. the listed asking? Can we see a recent rent roll and the last 12 months of T-12 income?
- It's been on market 84 days. Have you received any prior offers? Is the seller open to a 36% concession, seller financing, or rate buy-down credit?
- Built in 1946 — when were the roof, HVAC, electrical panel, plumbing, and water heater last replaced?
- Why hasn't it sold? Are there any deal-killer items the seller is aware of (foundation, flood, title, zoning, code violations)?
- Is there a deadline driving the sale (1031 exchange, divorce, estate, relocation)? That informs how much negotiation room exists.
- Schools are D-rated, which usually means shorter tenancies and higher turnover. Who's the typical renter profile here, and what's been the actual vacancy rate?
- Crime grade is D in this area — have there been break-ins, vandalism, or insurance claims at this property in the last 3 years? What carrier currently insures it and at what premium?
- The area grade is low — what's the realistic commute time and amenity access for the typical tenant pool here? Any planned neighborhood developments (good or bad) we should know about?
- What's the average days-on-market for RENTAL listings here right now (not sales)? A rising rental-DOM trend means longer vacancies and softer asking-rent achievability than the comps imply.
- What's the recent tenant-quality profile in this submarket — average credit score on applications, eviction rate, late-payment / NSF rate, and stable-employment percentage? A property-management company in the area should have these aggregated.
- How much new for-sale + rental construction is in the pipeline within 1–3 miles? Heavy new supply typically softens prices + rents 12–24 months out; constrained supply supports both.
Investment metrics
- 1% rule
- 0.64% ✗
- Cap rate
- 4.14%
- Cash-on-cash
- -7.68%
- DSCR
- 0.66
- GRM
- 13.0
CMA / ARV
- ARV (median comp)
- $641,688
- List price
- $595,000
- Delta
- -7.28%
- Verdict
- FAIR
- Comps
- 20 within 1.0 mi
Show comp detail 7 sales within ~0.75 mi
| Address | Dist | Beds/Ba | Sqft | Sold | Price | $/sf | Match |
|---|---|---|---|---|---|---|---|
| 24 Lonscreek Pl | 0.34mi | 4/2.5 (-1) | 1,984 (-2%) | 2mo | $515,000 | $260 | 72 |
| 218 Wavecrest Dr | 0.21mi | 4/2.0 (-1) | 1,908 (-6%) | 4mo | $560,000 | $294 | 71 |
| 295 Whittier Dr | 0.50mi | 4/2.0 (-1) | 2,005 (-1%) | 9mo | $610,000 | $304 | 62 |
| 188 Meadowmere Ave | 0.54mi | 6/2.5 (+1) | 2,100 (+3%) | 23mo | $600,000 | $286 | 43 |
| 130 Washington Ave | 0.72mi | 4/1.5 (-1) | 2,100 (+3%) | 16mo | $520,000 | $248 | 40 |
| 290 Cypress Dr | 0.68mi | 4/2.5 (-1) | 1,808 (-11%) | 10mo | $570,000 | $315 | 34 |
| 206 Longfellow Dr | 0.70mi | 4/2.0 (-1) | 1,750 (-14%) | 13mo | $560,000 | $320 | 29 |
Match score weights: distance 35% · size 25% · config 20% · recency 20%. Top-matched comps best support the ARV.
Projected returns pro-forma
10.0% appreciation · 3.0% rent growth · sell at horizon
- IRR
- 18.9%
- Equity multiple
- 2.54×
- Total profit
- $256,167
- Equity at exit
- $536,023
- IRR
- 17.5%
- Equity multiple
- 5.85×
- Total profit
- $807,840
- Equity at exit
- $1,155,954
Cash invested: $166,600 (down + closing). Projections, not guarantees.
Landlord ↔ Tenant lean methodology
- Overall (STATE)
- 15 Strongly Tenant-Friendly
- State New York
- 15 Strongly Tenant-Friendly · D+10
- County
- — inherits STATE
- City
- — inherits STATE
ZIP-level market 11951
- Home prices YoY
- 4.3%
- Active inventory
- 133
- Price-to-rent
- 13.0×
Monthly cashflow live
- Estimated rent
- $3,800 medium interval (Pro) →
- Mortgage (P&I)
- −$3,120
- Tax from tax record
- −$700 /mo · $8,402/yr
- Insurance
- −$248
- HOA
- −$0
- Vacancy / Maint / Mgmt
- −$798
- Net cashflow
- $-1,066
Break-even live
UW: 25.0% down · 7.5% · 30yr · 1.5% tax · 5.0% vac · 8.0% maint · 8.0% mgmt
Financing live
Cash to close
- Down payment
- $148,750
- Closing costs
- $17,850
- Reserves months
- —
- Total cash needed
- —
Loan-product check · same deal, 3 products live
Conventional
25% down · 7.5% · 30yr
- Down + closing
- —
- Monthly P&I
- —
- Monthly cashflow
- —
- DSCR
- —
- Eligible?
- —
Personal DTI + credit; lowest rate.
DSCR
20% down · 8.5% · 30yr
- Down + closing
- —
- Monthly P&I
- —
- Monthly cashflow
- —
- DSCR
- —
- Eligible?
- —
No personal income docs; deal must DSCR.
Hard money
10% down · 12.0% · 12mo
- Down + closing
- —
- Monthly P&I
- —
- Monthly cashflow
- —
- DSCR
- —
- Eligible?
- —
Short-term bridge; refi at stabilization.
Rent comps 1 comps
| Address | Beds | Baths | Sqft | Rent | $/sqft | DOM | Units | Dist |
|---|---|---|---|---|---|---|---|---|
| 192 Cypress Dr Mastic Beach, NY | 4.0 | 2.0 | 1404 | $3,800 | $2.71 | 43d | 1 | 0.91mi |
Listing history 23 events
-
2026-06-18days on market $595,000 Active 84 DOM
-
2026-06-17price $595,000 Active 83 DOM
-
2026-06-17days on market $625,000 Active 83 DOM
-
2026-06-16days on market $625,000 Active 82 DOM
-
2026-06-15days on market $625,000 Active 81 DOM
-
2026-06-13days on market $625,000 Active 79 DOM
-
2026-06-13days on market $625,000 Active 78 DOM
-
2026-06-09days on market $625,000 Active 75 DOM
-
2026-06-08days on market $625,000 Active 74 DOM
-
2026-06-07days on market $625,000 Active 73 DOM
-
2026-06-04days on market $625,000 Active 70 DOM
-
2026-06-03days on market $625,000 Active 69 DOM
-
2026-06-02days on market $625,000 Active 68 DOM
-
2026-06-01days on market $625,000 Active 67 DOM
-
2026-05-31days on market $625,000 Active 66 DOM
-
2026-03-26$625,000 Active 810-char remark
Show marketing remark (810 chars)
Nestled in the quaint and serene community of Mastic Beach, this expansive single-family residence offers exceptional space, versatility, and potential on a generous .89-acre parcel. The main level features five well-proportioned bedrooms, two full bathrooms, a comfortable living room, and a separate family room, providing ample room for both everyday living and entertaining. The lower level offers a fully functional basement with extra space and a full bathroom, complemented by a separate entrance, ideal for home office or flexible space. An unfinished attic with its own private entrance presents a unique opportunity for customization and future expansion. Completing this impressive offering is a two-car garage and abundant outdoor space, making this property a rare find with endless possibilities.
-
2015-06-12soldstatus $175,000
-
2015-05-29soldstatus $175,000 366-char remark
Show marketing remark (366 chars)
This Beautiful Ranch Situated On Nearly One Acre Of Fully Fenced Property Includes 3 Bedrooms, 2 Full Baths, Eat In Kitchen, Formal Dining Room And Office. Large Backyard Complete With Deck And Hot Tub Perfect For Entertaining Or Relaxing. Low Taxes Of $4256 With Star Make This One A Steal., Additional information: Appearance:Excellent,Separate Hotwater Heater:Y
-
2015-05-29soldstatus $175,000 Closed
Show marketing remark (366 chars)
This Beautiful Ranch Situated On Nearly One Acre Of Fully Fenced Property Includes 3 Bedrooms, 2 Full Baths, Eat In Kitchen, Formal Dining Room And Office. Large Backyard Complete With Deck And Hot Tub Perfect For Entertaining Or Relaxing. Low Taxes Of $4256 With Star Make This One A Steal., Additional information: Appearance:Excellent,Separate Hotwater Heater:Y
-
2015-01-19status Under Contract
-
2014-10-20$235,000 New
Show marketing remark (366 chars)
This Beautiful Ranch Situated On Nearly One Acre Of Fully Fenced Property Includes 3 Bedrooms, 2 Full Baths, Eat In Kitchen, Formal Dining Room And Office. Large Backyard Complete With Deck And Hot Tub Perfect For Entertaining Or Relaxing. Low Taxes Of $4256 With Star Make This One A Steal., Additional information: Appearance:Excellent,Separate Hotwater Heater:Y
-
2014-10-20$235,000 366-char remark
Show marketing remark (366 chars)
This Beautiful Ranch Situated On Nearly One Acre Of Fully Fenced Property Includes 3 Bedrooms, 2 Full Baths, Eat In Kitchen, Formal Dining Room And Office. Large Backyard Complete With Deck And Hot Tub Perfect For Entertaining Or Relaxing. Low Taxes Of $4256 With Star Make This One A Steal., Additional information: Appearance:Excellent,Separate Hotwater Heater:Y
-
2000-02-22soldstatus $80,000
ⓘ Source: listings_history table (triggers on properties + properties_extension) + one-shot
backfill from property_details.listing_events for pre-trigger history.
Tax reassessment forecast NY · Partial reset (capped growth)
- Current annual tax
- $8,402 · $700/mo
- Projected year-2 tax
- $9,229 · $769/mo
- Expected delta
- +$827/yr (+$69/mo · 9.8%)
ⓘ Screening estimate from a state-policy table — verify with the county assessor before closing.
Climate risk First Street
- Flood 4/10 Moderate FEMA zone X (unshaded) · 20% chance over 30 yrs
- Wildfire 1/10 Low
- Heat 4/10 Moderate 7 d/yr ≥91°F today · 19 d/yr by 30 yrs out
- Wind 8/10 Severe 80% chance of damaging wind over 30 yrs
- Air quality 4/10 Moderate 3 unhealthy d/yr today · 5 by 30 yrs out
Nearby sold comps map
Loading sold comps map…
Walkable amenities ~0.75 mi
Loading nearby amenities…
Taxation est. · year 1
- Rental income
- $45,600
- − Mortgage interest
- −$33,329
- − Property taxes
- −$8,402
- − Insurance
- −$2,975
- − Repairs & maintenance
- −$3,648
- − Management
- −$3,648
- − Depreciation
- −$17,309
- Taxable loss
- −$23,712
- Est. tax savings @ 24.0%
- +$5,691
- After-tax cash flow
- $-7,105/yr
For passive investors: Depreciation is non-cash, so a rental often shows a tax loss while cash-flowing — sheltering income. Rental losses are passive: they offset passive income freely, and up to $25,000/yr can offset ordinary (W-2) income if you actively participate and your MAGI is under $100k (phasing out to $0 by $150k); unused losses carry forward. On sale, claimed depreciation is recaptured at up to 25%, and gains may owe capital-gains tax (a 1031 exchange can defer both). Figures are a year-1 estimate at your 24.0% rate — not tax advice; consult a CPA.
Schools (NCES district)
- District
- William Floyd Union Free School District
- NCES district ID
- 3618690
- Math proficiency
- 48% ▲ 3.00%
- Reading proficiency
- 57% ▲ 11.00%
- Median HH income
- $70,564
- Composite
- 46.79/100
- National rank
- #2383
- State rank
- #309 of 590 in NY
Livability — Mastic Beach
- Score
- 61/100
- State rank
- #936
- US rank
- #18216
Category grades
Schools grade is shown separately in the Schools card above.
Census & demographics
- Census place
- Mastic Beach, NY
- City population
- 15,830
- Population (ZIP)
- 15,830
Population outlook (Suffolk County) Hauer SSP2
- Today (2025)
- 1,505,262 people
- By 2030
- 1,498,318 · -0.5%
- By 2040
- 1,471,101 · -2.3%
- By 2050
- 1,424,848 · -5.3%
- By 2075
- 1,337,157 · -11.2%
- By 2100
- 1,217,720 · -19.1%
Race, ethnicity, and origin ACS 2023
- Neighborhood character
- Predominantly White (68%)
- Race & ethnicity
- White 68% Hispanic / Latino 17% Two or more races 9% Black 6% Asian 2%
- Hispanic origin (detail)
- Mexican 1% Puerto Rican 6% Cuban 2%
- Common ancestry
- Lithuanian 3% Romanian 2% Italian 2%
- Foreign-born
- 7% · Canada, Vietnam
- Languages at home
- 84% English-only · Spanish 10% Other Indo-European 3% Chinese 1%
Political lean MEDSL · Suffolk
- 2024 margin
- Lean R (+10.0) · D 45.0% · R 55.0%
- 2008→2024 swing
- -16.0pp toward R · 2008: 6.0pp · 2024: -10.0pp
- All cycles
- 2024: R+10.0 2020: R+0.0 2016: R+8.2 2012: D+2.9 2008: D+6.0
Not yet ingested
- Civics
- —
Market trends
- HPI YoY
- ▲ 34.46%
- Current HPI
- 829.86
- Rent YoY
- —
- Metro
- —
- State GDP YoY
- ▲ 2.60%
- F500 in state
- 92
Industry mix (Fortune 500 HQ in NY)
| Industry | F500 HQs | Revenue |
|---|---|---|
| Financial Services | 10 | $950B |
|
||
| Consumer Goods | 9 | $162B |
|
||
| Insurance | 4 | $225B |
|
||
| Telecommunications | 2 | $144B |
|
||
| Pharmaceuticals | 2 | $112B |
|
||
| Media / Entertainment | 2 | $69B |
|
||
Price history
+681.2% since first listed8 events — show timeline
- 2026-03-26 Listed $625,000 BNYMLS
- 2015-06-12 Sold (Public Records) $175,000 Public Records
- 2015-05-29 Sold (MLS) $175,000 MLSLI
- 2015-05-29 Sold (MLS) $175,000 OneKey® MLS as Distributed by MLS Grid
- 2015-01-19 Pending — MLSLI
- 2014-10-20 Listed $235,000 MLSLI
- 2014-10-20 Listed $235,000 OneKey® MLS as Distributed by MLS Grid
- 2000-02-22 Sold (Public Records) $80,000 Public Records
Property tax history
+0.4%/yrLatest (2025): $8,402 · +0.0% YoY. Source: county tax records.
Cash-flow waterfall
monthlySold comps — $/sqft
last 12 mo · ≤1 miLoading sold comps…