 🏷️ Likely Rental
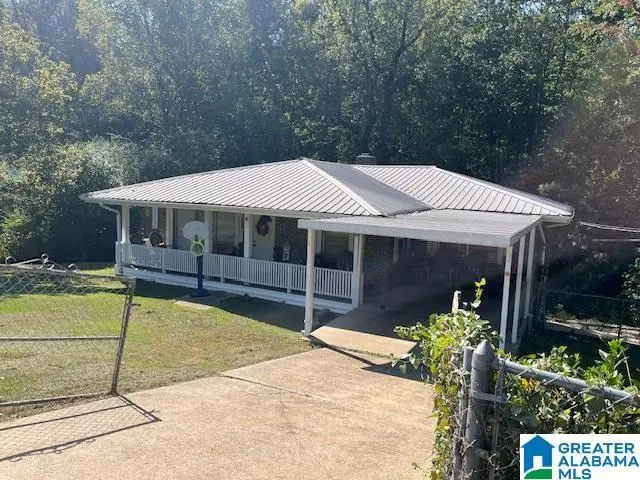
5453 Robin Cir · Adamsville, AL
Flood risk 3/10 · Minor
- FEMA flood zone
- X (unshaded)
- Chance of flooding over 30 yrs
- 0.2%
- Est. flood insurance / yr
- $473 – $860
Fire risk 4/10 · Minor
- Est. fire insurance / yr
- $916 – $1,700
Heat risk 6/10 · Moderate
- Hot days now (above 107°F)
- 7 days/yr
- Hot days in 30 yrs
- 19 days/yr
Wind risk 6/10 · Moderate
- Chance of severe wind over 30 yrs
- 27.0%
Air-quality risk 3/10 · Minor
- Unhealthy air days now
- 3 days/yr
- Unhealthy air days in 30 yrs
- 5 days/yr
Risk factors via First Street. Map © Google.
Why this score? — see what drove the C- grade
The composite is a weighted blend of 9 inputs, each scored 0–100. Each bar is that input's sub-score; the figure is the points it added to the 100-point composite (weight × sub-score).
- Cash flow +17.9/30.0
- ARV discount +15.0/15.0
- DSCR +5.6/10.0
- 1% rule +4.6/10.0
- Livability +2.6/5.0
- Rent growth +2.5/5.0
- Condition / age +2.5/5.0
- Schools +1.8/10.0
- Appreciation +0.1/10.0
$139,000
🖨 Deal sheet 📄 Offer letter ✓ Due diligence
Listing remarks MLS
This is a tenant occupied house located on a cul de sac. The tenant has been in the house since March of 2021.
Key facts
- 0.38 acre lot
- 2 garage spots
- Built 1965
Neighborhood map
What this means for you Summary
Snapshot
- This is a 3-bed/3.0-bath single-family listed at $139k.
Deal economics
- At list price, monthly cash flow is $116 ($1k/yr) — positive.
- The deal already cash-flows at list — no discount required.
- To meet the 1% rule (rent ≥ 1% of price), the offer needs to be $133k (4.5% below list).
- Recommended offer: $122k (12.0% below list) — sets the bar for market timing.
Location & tenants
- Location reads 51/100 on livability (#522 in AL) — a working-class tenant base; expect higher turnover. Strengths: cost of living A+, housing A+; Watch: schools F, crime F, amenities F.
- Jefferson County (suburban): math 9% / reading 32% proficiency, ranked #104 of 129 in AL (top 81%) — low school quality limits family demand, transient renter base, plan for 1-2y turnover.
- Market conditions: 59 active listings in the ZIP; 5 comparable units currently listed for rent nearby; rentals lingering (median 44d on market — plan ~5-8 weeks vacancy on turnover, expect pricing pressure); 60% of comp listings sitting > 30 days — soft ceiling on asking rent; 2,114 units permitted in Jefferson County in 2024 (556 in 5+ unit buildings).
Forward outlook
- Local home prices are declining (-3.0%/yr); year-one equity from $961 of loan paydown is wiped out by about $4k of value loss. Plan a longer hold.
- Jefferson County population projected to shrink 4% by 2050 — rents likely to lag national; underwrite the cash flow, not the appreciation.
Negotiation context
- It's been on market 591 days — a 12% lower offer ($122k) is reasonable based on typical stale-listing flexibility.
- 2 sale attempts since 2y ago with the ask held roughly flat each time — persistent listings suggest the price (not the market) is what's stuck; bring a comps-based counter.
Risks & watch-outs
- Climate carrying-cost: major wind risk, 27% chance of damaging wind over 30y; extreme-heat days projected 7→19/yr by 2055 (HVAC capex compounding) — expect insurance premiums to compound above CPI over the hold.
Questions for the listing agent
- It's been on market 591 days. Have you received any prior offers? Is the seller open to a 12% concession, seller financing, or rate buy-down credit?
- Built in 1965 — when were the roof, HVAC, electrical panel, plumbing, and water heater last replaced?
- Why hasn't it sold? Are there any deal-killer items the seller is aware of (foundation, flood, title, zoning, code violations)?
- Is there a deadline driving the sale (1031 exchange, divorce, estate, relocation)? That informs how much negotiation room exists.
- Schools are F-rated, which usually means shorter tenancies and higher turnover. Who's the typical renter profile here, and what's been the actual vacancy rate?
- Crime grade is F in this area — have there been break-ins, vandalism, or insurance claims at this property in the last 3 years? What carrier currently insures it and at what premium?
- What's the average days-on-market for RENTAL listings here right now (not sales)? A rising rental-DOM trend means longer vacancies and softer asking-rent achievability than the comps imply.
- What's the recent tenant-quality profile in this submarket — average credit score on applications, eviction rate, late-payment / NSF rate, and stable-employment percentage? A property-management company in the area should have these aggregated.
- How much new for-sale + rental construction is in the pipeline within 1–3 miles? Heavy new supply typically softens prices + rents 12–24 months out; constrained supply supports both.
Investment metrics
- 1% rule
- 0.96% ✗
- Cap rate
- 7.29%
- Cash-on-cash
- 3.57%
- DSCR
- 1.16
- GRM
- 8.7
CMA / ARV
- ARV (median comp)
- $180,660
- List price
- $139,000
- Delta
- -23.06%
- Verdict
- UNDERPRICED
- Comps
- 20 within 1.0 mi
Show comp detail 10 sales within ~0.75 mi
| Address | Dist | Beds/Ba | Sqft | Sold | Price | $/sf | Match |
|---|---|---|---|---|---|---|---|
| 5417 Storey Dr | 0.09mi | 4/2.5 (+1) | 1,743 (-2%) | 16mo | $206,000 | $118 | 73 |
| 5509 Valleyview Trl | 0.54mi | 3/2.0 | 1,818 (+3%) | 2mo | $229,900 | $126 | 65 |
| 5106 Gary Kay St | 0.53mi | 4/3.0 (+1) | 1,824 (+3%) | 2mo | $87,000 | $48 | 63 |
| 1533 1st St SE | 0.57mi | 3/2.0 | 1,748 (-1%) | 8mo | $115,000 | $66 | 61 |
| 5800 Longview Dr | 0.42mi | 4/2.0 (+1) | 1,740 (-2%) | 12mo | $189,000 | $109 | 58 |
| 201 Mcallister St | 0.35mi | 4/2.0 (+1) | 1,808 (+2%) | 16mo | $145,000 | $80 | 58 |
| 5305 Bellwood Dr | 0.54mi | 3/2.0 | 1,537 (-13%) | 3mo | $179,200 | $117 | 47 |
| 5425 Robin Cir | 0.14mi | 2/1.0 (-1) | 1,570 (-11%) | 21mo | $49,700 | $32 | 44 |
| 1545 3rd St SE | 0.60mi | 3/1.0 | 1,578 (-11%) | 6mo | $27,500 | $17 | 41 |
| 1014 Union Grove Rd | 0.71mi | 3/2.0 | 1,590 (-10%) | 15mo | $133,000 | $84 | 34 |
Match score weights: distance 35% · size 25% · config 20% · recency 20%. Top-matched comps best support the ARV.
Projected returns pro-forma
-3.0% appreciation · 3.0% rent growth · sell at horizon
- IRR
- -10.7%
- Equity multiple
- 0.61×
- Total profit
- $-15,138
- Equity at exit
- $20,725
- IRR
- -1.4%
- Equity multiple
- 0.91×
- Total profit
- $-3,662
- Equity at exit
- $12,018
Cash invested: $38,920 (down + closing). Projections, not guarantees.
Landlord ↔ Tenant lean methodology
- Overall (STATE)
- 90 Strongly Landlord-Friendly
- State Alabama
- 90 Strongly Landlord-Friendly · R+15
- County
- — inherits STATE
- City
- — inherits STATE
ZIP-level market 35005
- Home prices YoY
- -3.9%
- Active inventory
- 59
- Price-to-rent
- 8.7×
Monthly cashflow live
- Estimated rent
- $1,328 high interval (Pro) →
- Mortgage (P&I)
- −$729
- Tax from tax record
- −$146 /mo · $1,753/yr
- Insurance
- −$58
- HOA
- −$0
- Vacancy / Maint / Mgmt
- −$279
- Net cashflow
- $116
Break-even live
UW: 25.0% down · 7.5% · 30yr · 1.5% tax · 5.0% vac · 8.0% maint · 8.0% mgmt
Financing live
Cash to close
- Down payment
- $34,750
- Closing costs
- $4,170
- Reserves months
- —
- Total cash needed
- —
Loan-product check · same deal, 3 products live
Conventional
25% down · 7.5% · 30yr
- Down + closing
- —
- Monthly P&I
- —
- Monthly cashflow
- —
- DSCR
- —
- Eligible?
- —
Personal DTI + credit; lowest rate.
DSCR
20% down · 8.5% · 30yr
- Down + closing
- —
- Monthly P&I
- —
- Monthly cashflow
- —
- DSCR
- —
- Eligible?
- —
No personal income docs; deal must DSCR.
Hard money
10% down · 12.0% · 12mo
- Down + closing
- —
- Monthly P&I
- —
- Monthly cashflow
- —
- DSCR
- —
- Eligible?
- —
Short-term bridge; refi at stabilization.
Rent comps 5 comps
| Address | Beds | Baths | Sqft | Rent | $/sqft | DOM | Units | Dist |
|---|---|---|---|---|---|---|---|---|
| 208 Spring St Adamsville, AL | 4.0 | 2.5 | 2266 | $1,450 | $0.64 | 43d | 1 | 0.66mi |
| 933 Crestview Ln Adamsville, AL | 3.0 | 1.5 | 1500 | $1,285 | $0.86 | 44d | 1 | 0.69mi |
| 5309 Hazelwood Rd Adamsville, AL | 3.0 | 2.0 | 1526 | $1,325 | $0.87 | 1d | 1 | 0.69mi |
| 958 S Main St Graysville, AL | 3.0 | 2.0 | 1330 | $1,285 | $0.97 | 43d | 1 | 0.90mi |
| 4213 Kendall Ave Adamsville, AL | 4.0 | 2.0 | 1250 | $1,225 | $0.98 | 3d | 1 | 1.37mi |
Listing history 16 events
-
2026-06-18days on market $139,000 Active 591 DOM
-
2026-06-17days on market $139,000 Active 590 DOM
-
2026-06-16days on market $139,000 Active 589 DOM
-
2026-06-15days on market $139,000 Active 588 DOM
-
2026-06-13days on market $139,000 Active 586 DOM
-
2026-06-10days on market $139,000 Active 583 DOM
-
2026-06-09days on market $139,000 Active 582 DOM
-
2026-06-08days on market $139,000 Active 581 DOM
-
2026-06-07days on market $139,000 Active 580 DOM
-
2026-06-03days on market $139,000 Active 576 DOM
-
2026-06-02days on market $139,000 Active 575 DOM
-
2026-06-01days on market $139,000 Active 574 DOM
-
2026-05-31days on market $139,000 Active 573 DOM
-
2025-04-28status Active 110-char remark
Show marketing remark (110 chars)
This is a tenant occupied house located on a cul de sac. The tenant has been in the house since March of 2021.
-
2025-04-14status Pending 110-char remark
Show marketing remark (110 chars)
This is a tenant occupied house located on a cul de sac. The tenant has been in the house since March of 2021.
-
2024-10-21$139,000 Active 110-char remark
Show marketing remark (110 chars)
This is a tenant occupied house located on a cul de sac. The tenant has been in the house since March of 2021.
ⓘ Source: listings_history table (triggers on properties + properties_extension) + one-shot
backfill from property_details.listing_events for pre-trigger history.
Tax reassessment forecast AL · Resets to sale price
- Current annual tax
- $1,753 · $146/mo
- Projected year-2 tax
- $1,753 · $146/mo
- Expected delta
- $0/yr ($0/mo · 0.0%)
ⓘ Screening estimate from a state-policy table — verify with the county assessor before closing.
Climate risk First Street
- Flood 3/10 Moderate FEMA zone X (unshaded) · 20% chance over 30 yrs
- Wildfire 4/10 Moderate
- Heat 6/10 Major 7 d/yr ≥107°F today · 19 d/yr by 30 yrs out
- Wind 6/10 Major 27% chance of damaging wind over 30 yrs
- Air quality 3/10 Moderate 3 unhealthy d/yr today · 5 by 30 yrs out
Nearby sold comps map
Loading sold comps map…
Walkable amenities ~0.75 mi
Loading nearby amenities…
Taxation est. · year 1
- Rental income
- $15,932
- − Mortgage interest
- −$7,786
- − Property taxes
- −$1,753
- − Insurance
- −$695
- − Repairs & maintenance
- −$1,275
- − Management
- −$1,275
- − Depreciation
- −$4,044
- Taxable loss
- −$895
- Est. tax savings @ 24.0%
- +$215
- After-tax cash flow
- $1,606/yr
For passive investors: Depreciation is non-cash, so a rental often shows a tax loss while cash-flowing — sheltering income. Rental losses are passive: they offset passive income freely, and up to $25,000/yr can offset ordinary (W-2) income if you actively participate and your MAGI is under $100k (phasing out to $0 by $150k); unused losses carry forward. On sale, claimed depreciation is recaptured at up to 25%, and gains may owe capital-gains tax (a 1031 exchange can defer both). Figures are a year-1 estimate at your 24.0% rate — not tax advice; consult a CPA.
Schools (NCES district)
- District
- Jefferson County
- NCES district ID
- 0101920
- Math proficiency
- 9% ▼ -24.00%
- Reading proficiency
- 32% ▼ -5.00%
- Median HH income
- $51,712
- Composite
- 18.4/100
- National rank
- #8937
- State rank
- #104 of 129 in AL
Livability — Adamsville
- Score
- 51/100
- State rank
- #522
- US rank
- #25480
Category grades
Schools grade is shown separately in the Schools card above.
Census & demographics
- Census place
- Adamsville, AL
- City population
- 10,982
- Population (ZIP)
- 8,143
Population outlook (Jefferson County) Hauer SSP2
- Today (2025)
- 669,185 people
- By 2030
- 669,694 · +0.1%
- By 2040
- 661,388 · -1.2%
- By 2050
- 643,086 · -3.9%
- By 2075
- 577,267 · -13.7%
- By 2100
- 474,758 · -29.1%
Race, ethnicity, and origin ACS 2023
- Neighborhood character
- Majority Black (60%)
- Race & ethnicity
- Black 60% White 38% Asian 2%
- Common ancestry
- Serbian 2% Lithuanian 1%
- Foreign-born
- 1%
- Languages at home
- 98% English-only · Other Indo-European 1% Spanish 1%
Political lean MEDSL · Jefferson
- 2024 margin
- D (+10.4) · D 54.6% · R 44.2% · Other 1.2%
- 2008→2024 swing
- +5.4pp toward D · 2008: 5.1pp · 2024: 10.4pp
- All cycles
- 2024: D+10.4 2020: D+13.2 2016: D+7.2 2012: D+6.0 2008: D+5.1
Not yet ingested
- Civics
- —
Market trends
- HPI YoY
- ▼ -9.72%
- Current HPI
- 237.5788
- Rent YoY
- —
- Metro
- —
- State GDP YoY
- ▲ 2.94%
- F500 in state
- 4
Industry mix (Fortune 500 HQ in AL)
| Industry | F500 HQs | Revenue |
|---|---|---|
| Financial Services | 1 | $8B |
|
||
| Healthcare | 1 | $5B |
|
||
Price history
3 events — show timeline
- 2025-04-28 Relisted — Greater Alabama MLS
- 2025-04-14 Pending — Greater Alabama MLS
- 2024-10-21 Listed $139,000 Greater Alabama MLS
Property tax history
+10.2%/yrLatest (2025): $1,753 · +0.0% YoY. Source: county tax records.
Cash-flow waterfall
monthlySold comps — $/sqft
last 12 mo · ≤1 miLoading sold comps…