9621 Sunrise Lakes Blvd #302 · Sunrise, FL
Flood risk No data
- FEMA flood zone
- —
- Chance of flooding over 30 yrs
- —
- Est. flood insurance / yr
- —
Fire risk No data
- Est. fire insurance / yr
- —
Heat risk No data
- Hot days now (above threshold)
- —
- Hot days in 30 yrs
- —
Wind risk No data
- Chance of severe wind over 30 yrs
- —
Air-quality risk No data
- Unhealthy air days now
- —
- Unhealthy air days in 30 yrs
- —
Risk factors via First Street. Map © Google.
Why this score? — see what drove the B grade
The composite is a weighted blend of 9 inputs, each scored 0–100. Each bar is that input's sub-score; the figure is the points it added to the 100-point composite (weight × sub-score).
- Cash flow +30.0/30.0
- 1% rule +10.0/10.0
- DSCR +10.0/10.0
- ARV discount +7.5/15.0
- Livability +4.2/5.0
- Schools +4.1/10.0
- Rent growth +2.7/5.0
- Condition / age +2.5/5.0
- Appreciation +0.0/10.0
$94,000
🖨 Deal sheet 📄 Offer letter ✓ Due diligence
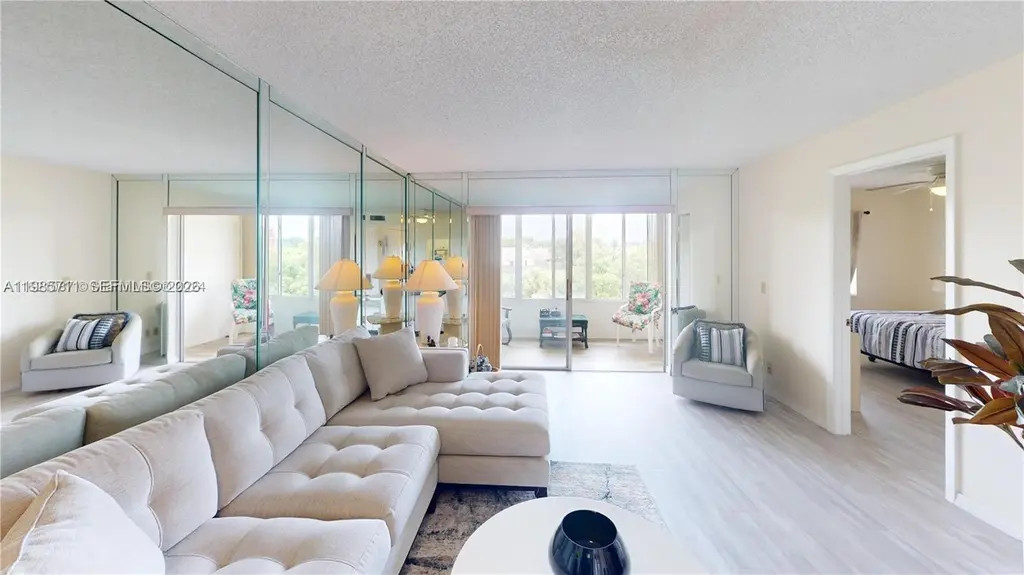
Listing remarks
Don't miss your chance to own this furnished, turnkey, top floor condo features all new waterproof luxury vinyl laminate flooring, new living room and dining room furniture as well as new mattresses. NEWER A/C 2019 keeps the unit nice and cold on hot summer days. The building has a NEW ROOF and ALL ASSESSMENTS PAID BY SELLER! Sunrise Lakes Phase 3 also offers amazing amenities including 10 swimming pools, gym, free golf, tennis, pickleball, racquetball, dances, movies, bingo and so much more! This unit is vacant and easy to show. Maintenance includes, WIFI, cable, pest control, security guards, reserves, etc. Look for the Matterport virtual tour to view in detail!
Key facts
- 10 swimming pools
- Tennis
- Free golf
Tags
Property features AI
Finance
- HOA & community: Monthly association fee; Association fee covers amenities, cable TV, golf, insurance, internet, pest control, recreation facilities, reserve fund, roof, sewer, security, trash and water; Community amenities include clubhouse, fitness center, golf course, laundry, pickleball, pool, putting green, spa/hot tub, storage, tennis courts, trash service and elevators; Golf course community; Senior community
Exterior
- Parking: Assigned parking; Guest parking; One space
- Security: Security guard
- Utilities: Cable available
- Home design: Condo/unit in a multi-story building; Faces west; Entry on level 3; Total building stories: 3
- Construction: Block construction
- Exterior features: Balcony; Screened balcony; Canal access waterfront; Association pool (heated)
Interior
- Kitchen: Dishwasher; Electric range; Disposal; Refrigerator
- Bedrooms: Bedroom on main level
- Flooring: Laminate
- Bathrooms: 2 full bathrooms
- Heating & cooling: Central heat (electric, heat pump); Central electric air conditioning
- Interior features: Furnished; Blinds and metal single-hung windows; Living/dining room; Main living area on entry level; Pantry; Walk-in closet(s)
- Laundry & utility: Common area laundry
Neighborhood map
What this means for you Summary
Snapshot
- This is a 2-bed/2.0-bath condo listed at $94k.
Deal economics
- At list price, monthly cash flow is $461 ($6k/yr) — positive.
- The deal already cash-flows at list — no discount required.
- Meets the 1% rule at list price ($2k rent vs $94k).
- Recommended offer: $86k (9.0% below list) — sets the bar for market timing.
- Cap rate 12.2% vs local median 4.9% in Sunrise — top-decile yield for the area; either an underpriced asset or a hidden risk that comps aren't pricing in. Stress-test before assuming the spread holds.
Location & tenants
- Location reads 83/100 on livability (#56 in FL, #986 nationally) — a professional / high-income tenant draw. Strengths: commute A+, housing A+, health & safety A+; Watch: employment C-, amenities F.
- Broward (suburban): math 42% / reading 53% proficiency, ranked #46 of 73 in FL (top 63%) — families likely to look elsewhere, expect single-tenant / working-renter base with shorter leases.
- Market conditions: Rents flat; 559 active listings in the ZIP; 40 comparable units currently listed for rent nearby; rentals at typical pace (median 24d on market — plan ~3-4 weeks tenant-placement turnaround); 2,111 units permitted in Broward County in 2024 (1,265 in 5+ unit buildings).
- This rent runs 37% of the median local income ($72k/yr) — at the standard rent-burdened threshold; future hikes will face affordability resistance.
Forward outlook
- Local home prices are declining (-3.0%/yr); year-one equity from $650 of loan paydown is wiped out by about $3k of value loss. Plan a longer hold.
- Broward County population projected at +34% by 2050 — long-run rental-demand tailwind backs the buy-and-hold thesis.
- At projected returns (-3.0% appreciation + 0.6% rent growth), your $26k cash investment doubles in ~8 years — after that, you're playing with house money.
Negotiation context
- It's been on market 91 days — a 9% lower offer ($86k) is reasonable based on typical stale-listing flexibility.
- 3 sale attempts since 2y ago with the ask held roughly flat each time — persistent listings suggest the price (not the market) is what's stuck; bring a comps-based counter.
- Current owner paid $44k; list at $94k implies a 112% gain — meaningful room to come down on a strong offer.
Risks & watch-outs
- Watch-outs: HOA is 27% of rent.
Questions for the listing agent
- It's been on market 91 days. Have you received any prior offers? Is the seller open to a 9% concession, seller financing, or rate buy-down credit?
- What does the HOA fee cover, when was the last increase, and are there any pending special assessments or reserve-fund shortfalls?
- Any open or pending special assessments — roof, HVAC, plumbing, elevator, façade? What's the per-unit balance and payoff schedule, and is the seller paying it off at close or rolling it to the buyer?
- Why hasn't it sold? Are there any deal-killer items the seller is aware of (foundation, flood, title, zoning, code violations)?
- Is there a deadline driving the sale (1031 exchange, divorce, estate, relocation)? That informs how much negotiation room exists.
- What's the average days-on-market for RENTAL listings here right now (not sales)? A rising rental-DOM trend means longer vacancies and softer asking-rent achievability than the comps imply.
- What's the recent tenant-quality profile in this submarket — average credit score on applications, eviction rate, late-payment / NSF rate, and stable-employment percentage? A property-management company in the area should have these aggregated.
- How much new apartment / multifamily construction is in the pipeline within 1–3 miles? Heavy new supply (>2% of stock underway) typically softens rents 12–24 months out; light construction supports rent growth.
Investment metrics
- 1% rule
- 2.35% ✓
- Cap rate
- 12.18%
- Cash-on-cash
- 21.01%
- DSCR
- 1.93
- GRM
- 3.6
CMA / ARV
No comps found within radius.
Projected returns pro-forma
-3.0% appreciation · 0.6% rent growth · sell at horizon
- IRR
- 9.4%
- Equity multiple
- 1.35×
- Total profit
- $9,341
- Equity at exit
- $14,016
- IRR
- 15.3%
- Equity multiple
- 2.04×
- Total profit
- $27,303
- Equity at exit
- $8,127
Cash invested: $26,320 (down + closing). Projections, not guarantees.
Landlord ↔ Tenant lean methodology
- Overall (STATE)
- 87 Strongly Landlord-Friendly
- State Florida
- 87 Strongly Landlord-Friendly · R+3
- County
- — inherits STATE
- City
- — inherits STATE
ZIP-level market 33322
- Home prices YoY
- -33.3%
- Rents YoY
- 0.6%
- Active inventory
- 559
- Price-to-rent
- 3.6×
Monthly cashflow live
- Estimated rent
- $2,205 high interval (Pro) →
- Mortgage (P&I)
- −$493
- Tax from tax record
- −$157 /mo · $1,885/yr
- Insurance
- −$39
- HOA
- −$592
- Vacancy / Maint / Mgmt
- −$463
- Net cashflow
- $461
Break-even live
UW: 25.0% down · 7.5% · 30yr · 1.5% tax · 5.0% vac · 8.0% maint · 8.0% mgmt
Financing live
Cash to close
- Down payment
- $23,500
- Closing costs
- $2,820
- Reserves months
- —
- Total cash needed
- —
Loan-product check · same deal, 3 products live
Conventional
25% down · 7.5% · 30yr
- Down + closing
- —
- Monthly P&I
- —
- Monthly cashflow
- —
- DSCR
- —
- Eligible?
- —
Personal DTI + credit; lowest rate.
DSCR
20% down · 8.5% · 30yr
- Down + closing
- —
- Monthly P&I
- —
- Monthly cashflow
- —
- DSCR
- —
- Eligible?
- —
No personal income docs; deal must DSCR.
Hard money
10% down · 12.0% · 12mo
- Down + closing
- —
- Monthly P&I
- —
- Monthly cashflow
- —
- DSCR
- —
- Eligible?
- —
Short-term bridge; refi at stabilization.
Rent comps 40 comps
| Address | Beds | Baths | Sqft | Rent | $/sqft | DOM | Units | Dist |
|---|---|---|---|---|---|---|---|---|
| 9999 Summerbreeze Dr Sunrise, FL | 1.0–2.0 | 1.0–2.0 | 889 | $2,200 | $2.47 | 1d | 9 | 0.24mi |
| 9999 Summerbreeze Dr Sunrise, FL | 1.0–2.0 | 1.0–2.0 | 889 | $2,200 | $2.47 | 18d | 6 | 0.24mi |
| 9999 Summerbreeze Dr Sunrise, FL | 1.0–2.0 | 1.0–2.0 | 889 | $2,200 | $2.47 | 1d | 8 | 0.24mi |
| 9999 Summerbreeze Dr Sunrise, FL | 1.0–2.0 | 1.0–2.0 | 889 | $2,200 | $2.47 | 4d | 9 | 0.24mi |
| 3531 NW 94th Ave Unit 6B Sunrise, FL | 2.0 | 2.0 | 925 | $1,925 | $2.08 | 14d | 1 | 0.38mi |
| 2734 N Nob Hill Rd Sunrise, FL | 2.0 | 2.0 | 954 | $2,400 | $2.52 | 24d | 1 | 0.44mi |
| 2698 N Nob Hill Rd Sunrise, FL | 2.0 | 2.0 | 1008 | $2,275 | $2.26 | 24d | 1 | 0.46mi |
| 3625 NW 94th Ave Unit 3G Sunrise, FL | 2.0 | 2.0 | 925 | $1,995 | $2.16 | 24d | 1 | 0.49mi |
| 3689 NW 94th Ave #51 Sunrise, FL | 2.0 | 2.0 | 925 | $2,250 | $2.43 | 7d | 1 | 0.49mi |
| 3621 NW 95th Ter #523 Sunrise, FL | 2.0 | 2.0 | 970 | $2,150 | $2.22 | 24d | 1 | 0.50mi |
| 3598 NW 91st Ln #3598 Sunrise, FL | 2.0 | 2.0 | 886 | $1,895 | $2.14 | 24d | 1 | 0.52mi |
| 3562 NW 91st Ln #3562 Sunrise, FL | 2.0 | 2.0 | 886 | $1,900 | $2.14 | 24d | 1 | 0.55mi |
| 3624 NW 91st Ln #3624 Sunrise, FL | 2.0 | 2.0 | 886 | $2,000 | $2.26 | 4d | 1 | 0.55mi |
| 9100 NW 26th Pl Sunrise, FL | 2.0 | 2.0 | 1047 | $2,995 | $2.86 | 24d | 1 | 0.57mi |
| 9100 NW 26th Pl Sunrise, FL | 3.0 | 2.0 | 1047 | $2,995 | $2.86 | 21d | 1 | 0.57mi |
| 3776 NW 91st Ln #3776 Sunrise, FL | 2.0 | 2.0 | 886 | $2,000 | $2.26 | 24d | 1 | 0.60mi |
| 9720 NW 24th Pl Unit B Sunrise, FL | 1.0 | 1.0 | 700 | $1,750 | $2.50 | 24d | 1 | 0.63mi |
| 8590 Sunrise Lakes Blvd #106 Sunrise, FL | 1.0 | 1.0 | 640 | $1,475 | $2.30 | 24d | 1 | 0.63mi |
| 8595 Sunrise Lakes Blvd #207 Sunrise, FL | 1.0 | 1.0 | 640 | $1,700 | $2.66 | 24d | 1 | 0.64mi |
| 8595 Sunrise Lakes Blvd #307 Sunrise, FL | 1.0 | 1.0 | 640 | $1,400 | $2.19 | 1d | 1 | 0.64mi |
| 8595 Sunrise Lakes Blvd Sunrise, FL | 1.0 | 1.0 | 640 | $1,550 | $2.42 | 20d | 2 | 0.65mi |
| 9838 Nob Hill Ct #9838 Sunrise, FL | 2.0 | 2.0 | 840 | $1,950 | $2.32 | 14d | 1 | 0.65mi |
| 3100 N Pine Island Rd Sunrise, FL | 1.0–2.0 | 1.5–2.0 | 1002 | $2,300 | $2.29 | 24d | 2 | 0.66mi |
| 9878 Nob Hill Ct #9878 Sunrise, FL | 2.0 | 2.0 | 900 | $2,100 | $2.33 | 11d | 1 | 0.67mi |
| 9878 Nob Hill Ct #9878 Sunrise, FL | 2.0 | 2.0 | 900 | $2,200 | $2.44 | 24d | 1 | 0.67mi |
| 9926 Nob Hill Ct #9926 Sunrise, FL | 2.0 | 2.0 | 915 | $2,400 | $2.62 | 24d | 1 | 0.68mi |
| 8500 Sunrise Lakes Blvd #111 Sunrise, FL | 2.0 | 2.0 | 850 | $1,850 | $2.18 | 10d | 1 | 0.69mi |
| 8500 Sunrise Lakes Blvd #111 Sunrise, FL | 2.0 | 2.0 | 850 | $1,850 | $2.18 | 14d | 1 | 0.69mi |
| 3825 NW 90th Ave #3825 Sunrise, FL | 2.0 | 1.0 | 865 | $2,000 | $2.31 | 24d | 1 | 0.69mi |
| 3825 NW 90th Ave #3825 Sunrise, FL | 2.0 | 1.0 | 865 | $2,000 | $2.31 | 2d | 1 | 0.69mi |
| 9954 Nob Hill Ct #9954 Sunrise, FL | 2.0 | 2.0 | 900 | $1,900 | $2.11 | 24d | 1 | 0.69mi |
| 9982 Nob Hill Ct #9982 Sunrise, FL | 2.0 | 2.0 | 900 | $2,200 | $2.44 | 12d | 1 | 0.70mi |
| 9994 Nob Hill Ct #9994 Sunrise, FL | 2.0 | 2.0 | 840 | $1,975 | $2.35 | 24d | 1 | 0.72mi |
| 8465 Sunrise Lakes Blvd #106 Sunrise, FL | 1.0 | 1.0 | 640 | $1,450 | $2.27 | 24d | 1 | 0.74mi |
| 10002 Winding Lake Rd #101 Sunrise, FL | 2.0 | 2.0 | 760 | $1,900 | $2.50 | 24d | 1 | 0.74mi |
| 3432 NW 86th Way Unit D204 Sunrise, FL | 2.0 | 2.0 | 1040 | $1,900 | $1.83 | 24d | 1 | 0.74mi |
| 3730 N Pine Island Rd Sunrise, FL | 2.0 | 1.0 | 800 | $1,899 | $2.37 | 21d | 1 | 0.77mi |
| 9964 Nob Hill Pl #9964 Sunrise, FL | 2.0 | 2.0 | 986 | $2,100 | $2.13 | 24d | 1 | 0.77mi |
| 9964 Nob Hill Pl #9964 Sunrise, FL | 2.0 | 2.0 | 986 | $2,000 | $2.03 | 7d | 1 | 0.77mi |
| 9943 Nob Hill Pl #9943 Sunrise, FL | 1.0 | 1.0 | 744 | $1,875 | $2.52 | 10d | 1 | 0.77mi |
HOA detail condo
- Monthly dues
- $592 · $7,104/yr
- Likely covers
- waterinternetcablepoolgymsecurity
- Assessments
- None detected in remarks — confirm with the listing agent.
Listing history 25 events
-
2026-06-18days on market $94,000 Active 91 DOM
-
2026-06-17days on market $94,000 Active 90 DOM
-
2026-06-16days on market $94,000 Active 89 DOM
-
2026-06-15days on market $94,000 Active 88 DOM
-
2026-06-13days on market $94,000 Active 86 DOM
-
2026-06-09days on market $94,000 Active 82 DOM
-
2026-06-08days on market $94,000 Active 81 DOM
-
2026-06-07days on market $94,000 Active 80 DOM
-
2026-06-04days on market $94,000 Active 77 DOM
-
2026-06-03days on market $94,000 Active 76 DOM
-
2026-06-02days on market $94,000 Active 75 DOM
-
2026-06-01days on market $94,000 Active 74 DOM
-
2026-05-31days on market $94,000 Active 73 DOM
-
2026-03-11$94,000 Active
-
2025-12-31historical
-
2025-09-17price $94,000
-
2025-09-08status Active
-
2025-08-16historical Active Under Contract
-
2025-07-30price $99,000
-
2025-05-29price $104,000
-
2025-04-15price $114,000
-
2025-03-12price $119,900
-
2024-11-06price $124,500
-
2024-07-10$129,500 Active
-
1980-08-01soldstatus $44,400
ⓘ Source: listings_history table (triggers on properties + properties_extension) + one-shot
backfill from property_details.listing_events for pre-trigger history.
Tax reassessment forecast FL · Resets to sale price
- Current annual tax
- $1,885 · $157/mo
- Projected year-2 tax
- $1,885 · $157/mo
- Expected delta
- $0/yr ($0/mo · 0.0%)
ⓘ Screening estimate from a state-policy table — verify with the county assessor before closing.
Nearby sold comps map
Loading sold comps map…
Walkable amenities ~0.75 mi
Loading nearby amenities…
Taxation est. · year 1
- Rental income
- $26,462
- − Mortgage interest
- −$5,265
- − Property taxes
- −$1,885
- − Insurance
- −$470
- − Repairs & maintenance
- −$2,117
- − Management
- −$2,117
- − HOA
- −$7,104
- − Depreciation
- −$2,735
- Taxable income
- $4,769
- Est. tax owed @ 24.0%
- −$1,144
- After-tax cash flow
- $4,386/yr
For passive investors: Depreciation is non-cash, so a rental often shows a tax loss while cash-flowing — sheltering income. Rental losses are passive: they offset passive income freely, and up to $25,000/yr can offset ordinary (W-2) income if you actively participate and your MAGI is under $100k (phasing out to $0 by $150k); unused losses carry forward. On sale, claimed depreciation is recaptured at up to 25%, and gains may owe capital-gains tax (a 1031 exchange can defer both). Figures are a year-1 estimate at your 24.0% rate — not tax advice; consult a CPA.
Schools (NCES district)
- District
- Broward
- NCES district ID
- 1200180
- Math proficiency
- 42% ▼ -18.00%
- Reading proficiency
- 53% ▼ -5.00%
- Median HH income
- $52,139
- Composite
- 40.88/100
- National rank
- #3621
- State rank
- #46 of 73 in FL
Livability — Sunrise
- Score
- 83/100
- State rank
- #56
- US rank
- #986
Category grades
Schools grade is shown separately in the Schools card above.
Census & demographics
- Census place
- Sunrise, FL
- County
- Broward County · 1,963,430 people
- City population
- 77,492
- Metro
- Miami-Fort Lauderdale-Pompano Beach, FL
- Population (ZIP)
- 41,128
- Household income
- $71,755
- Rent vs Own
- Severe rent burden
- 931.0
Population outlook (Broward County) Hauer SSP2
- Today (2025)
- 2,207,033 people
- By 2030
- 2,360,704 · +7.0%
- By 2040
- 2,661,208 · +20.6%
- By 2050
- 2,946,698 · +33.5%
- By 2075
- 3,602,273 · +63.2%
- By 2100
- 3,970,984 · +79.9%
Race, ethnicity, and origin ACS 2023
- Neighborhood character
- Highly diverse neighborhood (Simpson 0.72)
- Race & ethnicity
- Hispanic / Latino 35% White 32% Black 24% Two or more races 22% Asian 4%
- Hispanic origin (detail)
- Puerto Rican 5% Cuban 6% Dominican 2% Salvadoran 1%
- Common ancestry
- Hispanic 5% Romanian 2% Scotch-Irish 2%
- Foreign-born
- 41% · Canada, Jamaica, South Korea
- Languages at home
- 58% English-only · Spanish 30% French/Haitian/Cajun 6% Other Indo-European 1%
Political lean MEDSL · Broward
- 2024 margin
- D (+17.0) · D 58.0% · R 41.0%
- 2008→2024 swing
- -17.8pp toward R · 2008: 34.7pp · 2024: 17.0pp
- All cycles
- 2024: D+17.0 2020: D+29.8 2016: D+35.0 2012: D+34.9 2008: D+34.7
Not yet ingested
- Civics
- —
Market trends
- HPI YoY
- ▼ -203.34%
- Current HPI
- 407.5452
- Rent YoY
- ▲ 0.60%
- Metro
- Miami-Fort Lauderdale-Pompano Beach, FL
- State GDP YoY
- ▲ 3.28%
- F500 in state
- 36
Industry mix (Fortune 500 HQ in FL)
| Industry | F500 HQs | Revenue |
|---|---|---|
| Industrial Technology | 2 | $29B |
|
||
| Insurance | 2 | $17B |
|
||
| Retail | 1 | $60B |
|
||
| Technology Distribution | 1 | $58B |
|
||
| Homebuilding | 1 | $35B |
|
||
| Technology Manufacturing | 1 | $35B |
|
||
Price history
+111.7% since first listed12 events — show timeline
- 2026-03-11 Listed $94,000 MARMLS
- 2025-12-31 Listing Removed — MARMLS
- 2025-09-17 Price Changed $94,000 MARMLS
- 2025-09-08 Relisted — MARMLS
- 2025-08-16 Contingent — MARMLS
- 2025-07-30 Price Changed $99,000 MARMLS
- 2025-05-29 Price Changed $104,000 MARMLS
- 2025-04-15 Price Changed $114,000 MARMLS
- 2025-03-12 Price Changed $119,900 MARMLS
- 2024-11-06 Price Changed $124,500 MARMLS
- 2024-07-10 Listed $129,500 MARMLS
- 1980-08-01 Sold (Public Records) $44,400 Public Records
Property tax history
+9.1%/yrLatest (2025): $1,885 · +0.2% YoY. Source: county tax records.
Cash-flow waterfall
monthlySold comps — $/sqft
last 12 mo · ≤1 miLoading sold comps…